Liquidity Zones in trading: How to Master the Chart (Diagrams + Case Studies)

After studying this guide, you will learn how to identify zones where real money accumulates. This will protect your deposit from market traps and drastically improve your entry precision, allowing you to trade in sync with major players.
Market Structure + Liquidity Zones
Market structure and liquidity zones are two inseparable concepts. Many liquidity zones only make sense through market structure, and many market structure levels become meaningless without liquidity concepts.
Defining Liquidity and Its Role in Smart Money
Due to their huge trading volumes (millions of USD), major players (smart money) cannot simply enter the market at any moment without causing a sharp price spike. Smart money is a collective term for these large players, such as central banks, hedge funds, and other institutions that manage enormous amounts of capital and drive the main market movements.
Without accounting for major players and understanding liquidity zones, there's no point in trading, because smart money sees retail traders' stop‑losses as fuel for their own trades. Let's break it all down.
What Is Liquidity?
When whales want to buy a currency pair, they need sellers in the market. The existing ability to place those positions is called liquidity. Liquidity is essentially determined by the placement of stop‑losses. Where stop‑losses are located, liquidity is found. Whales rely on triggering stop‑losses to enter the market strategically.

Where stop‑losses are, there liquidity is. Liquidation maps help visualise these clusters and pools in real time, showing at which price levels the largest volume of closing orders is concentrated. This allows smart money to efficiently open their positions.
Equal Highs and Lows as Liquidity Zones
There are many types of liquidity in the market. The first type is equal highs and lows. As the name suggests, price forms equal lows when the low points are roughly at the same level.

Similarly, price forms equal highs when the highs are roughly at the same level. What does this mean from a price action perspective? Double or triple bottoms formed on the chart are excellent places for many retail traders to look for trading opportunities.
They expect a bounce upward when price touches that area again, so they open long positions at these levels and place their stop‑losses somewhere below that area.

As we already mentioned, smart money aims to trigger stop‑losses. Therefore, you should enter the market after liquidity has been harvested. If there is a demand zone below the equal lows, there is a high probability that price will break below those equal lows, sweep liquidity, and continue moving upward.

This is essentially one of the secret trading patterns in smart money concepts: wait for price to harvest retail traders' stop‑losses, and only then enter the market in the demand zone.
Bearish Liquidity Sweep Scenario
The same scenario occurs in a bear market. When price touches a resistance zone, retail traders open short positions expecting a pullback. Their stop‑losses will be somewhere above that zone, so a lot of liquidity accumulates above that area.

If smart money wants to sell this pair, the conditions are ready: push price above that resistance level to capture liquidity, then drive price back in the original bearish direction.

As a smart money trader, you enter the position after stop‑losses have been swept. Now let's look at real chart examples.
Real Trading Examples
It's important to understand that if a support or resistance level looks too beautiful and obvious even to a beginner, it will most likely become a trap, not an entry point. Let's look at real examples.
30‑Minute Chart Example
On the 30‑minute chart we see a clear uptrend. There is a recent support level from which the market has bounced multiple times. When price approaches this level, many traders will open long positions expecting another bounce. This is shown on the right.
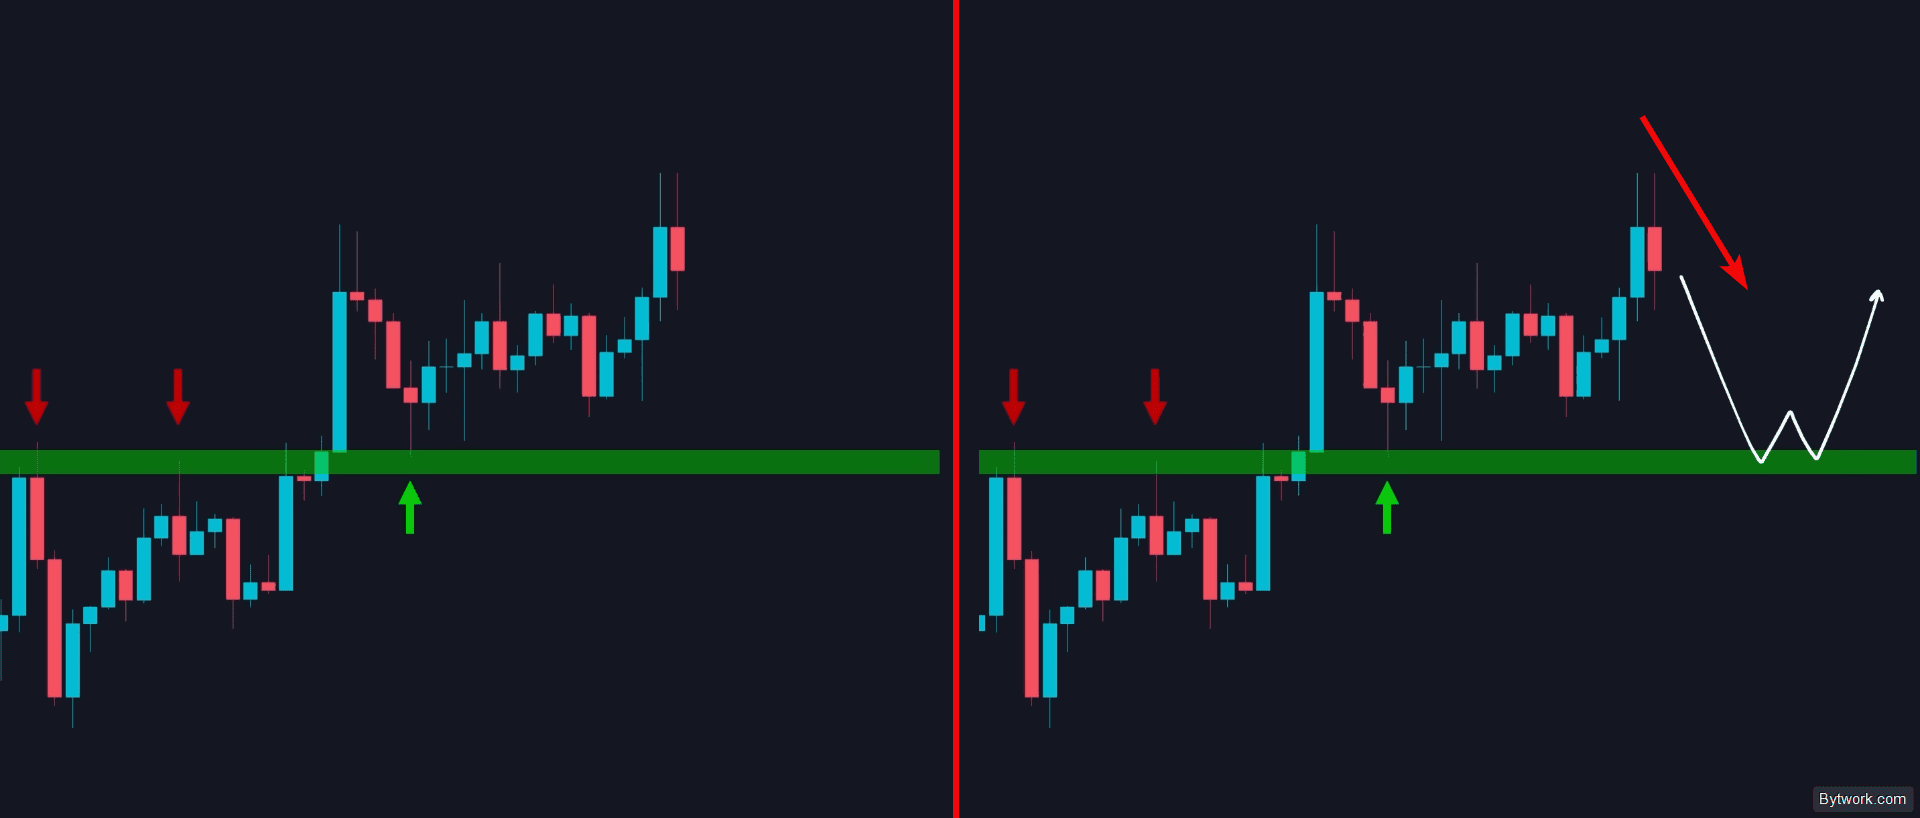
On the other hand, traders who previously opened long positions here will hold them.
Thus, this area is considered a key liquidity level, and stop‑losses are gathering somewhere below this area.
Now the question: where could the point of interest be for large‑capital traders to enter the market? Look to the side: we can notice a fair value gap (FVG), which is an extreme demand zone.

If we consider the start and end of the last impulsive move and apply a Fibonacci retracement, we see that the FVG lies within the discount side of the range.

This is an ideal opportunity: place a limit buy order in this zone and set your stop‑loss below the swing low.
Price swept liquidity, immediately bounced from the FVG zone, and moved higher as expected.

But when trading real markets, you will inevitably encounter many losing and missed trades. That is why it is so important to follow the rules of your trading system and risk management plan to survive and profit from winning opportunities.
Remember: trading is always about the future, and the nature of the future is unpredictable!
15‑Minute Chart Example
On the 15‑minute chart we see a strong uptrend. The last impulsive move created an equal lows area that will act as support when price touches this zone again. Thus, a lot of liquidity sits below these equal lows.
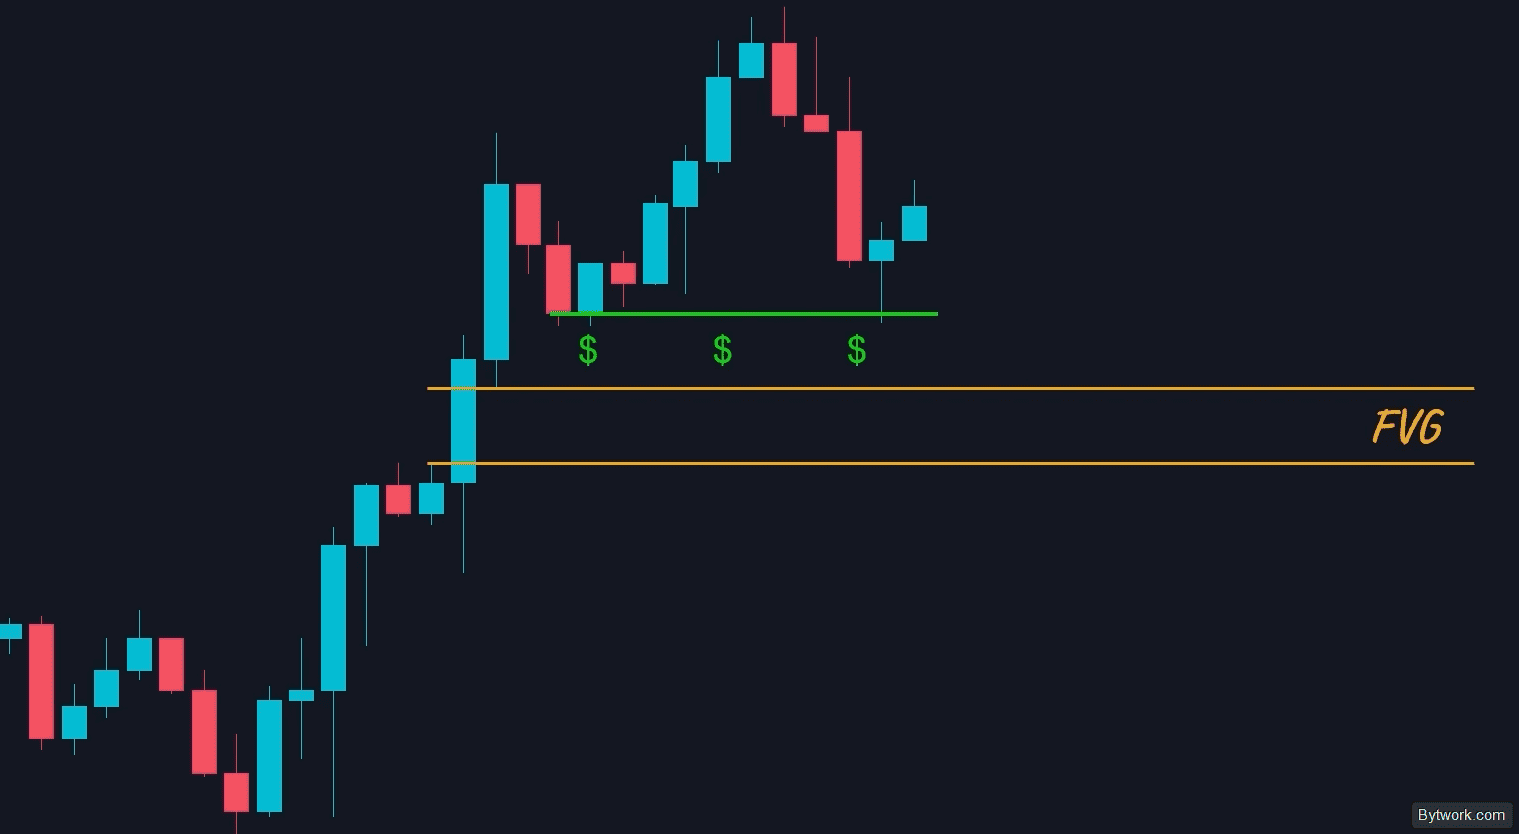
You will see an FVG area that will also act as a strong demand zone right under the liquidity zone. So the ideal trading idea is to wait for price to break the equal low, capture liquidity, and then you can go long in the FVG zone. That way, as a smart money trader, we enter the market after stop‑losses have already been swept!
But you might say: doesn't a break below this area count as a change of character and a shift in market direction? The answer is yes. Normally this would be considered a change of character, indicating no more bullishness. However, in this specific scenario, the change of character is invalid.

This is exactly what we meant earlier when we said that many market structure levels become meaningless without liquidity concepts. Therefore, liquidity and market structure are inseparable concepts in trading.
Combining Market Structure and Liquidity
It is crucial to understand that a break of structure may not be a trend reversal signal, but simply a manipulation to gather liquidity before filling an institutional order. Hence, it's important to understand liquidity zones in conjunction with market structure.
What Is Market Structure in Trading?
When we talk about market structure, we refer to swing highs and lows, price moves, and areas that the market has previously reacted to. We consider all these elements as part of market structure – they act as the skeleton of price movement.

Now let me show you some basic market structure concepts within a smart money trading plan. As you know, in a perfect uptrend the market constantly makes higher highs and higher lows. Each time the market breaks the previous high to the upside, we call that a break of structure, and it indicates that the market wants to continue moving in the same bullish direction.
On the other hand, if the market breaks the previous low to the downside, we call that a change of character, signalling a possible trend reversal.

So, let's define valid changes of character. To do that, you first need to identify your swing lows. In a bullish scenario, the lowest point between two consecutive highs is identified as the swing low. Here you have two consecutive highs, so the lowest point between them is your swing low.

As long as price stays above this level, it means a bullish market, and we will only look for buying opportunities. For a valid change of character, you need to see a candle break and close below this level. Here you have another break of structure caused by this move.
So again, the lowest point of two consecutive highs is defined as the swing low. Keep in mind that the same concept applies to a bearish scenario.
Now the question arises: when can we confidently say that a change of character will reverse the trend?
When Does a Change of Character Actually Reverse the Trend?
To answer this question, we need to understand the actual nature of the market. Imagine you have a clear uptrend on the 4‑hour timeframe with a series of impulsive and corrective moves. The market constantly makes higher highs and respects higher lows. If you zoom in to the 1‑hour timeframe, you will notice that this 4‑hour impulsive wave consists of impulsive and corrective moves that, in an ideal scenario, respect the lows.

However, in a non‑ideal scenario, price will create false breaks before moving up to form higher highs. When most traders see these false breaks, they assume price will reverse and open short positions in the supply zone, only to get stopped out.

So if you have deep knowledge of market structure, you will understand that because the higher timeframe is in a clear uptrend, you will avoid that move and instead find a demand zone and go with the dominant trend.

The correct entry logic for the "non‑ideal" scenario is shown.
Another important point: the best trading areas are those where the lower‑timeframe and higher‑timeframe trends align in the same direction.
How to Align Timeframes?
On a 1‑minute chart you see impulsive and corrective moves. But if you zoom out to a 5‑minute chart, you only see these moves as larger candles.

Thus, in areas where the 1‑minute and 5‑minute charts are pointing in the same direction, trading makes more sense! This is clearly shown in the example below:

Now that we have explained some basic market structure concepts, let's move to an advanced phase.
Advanced Example – Liquidity Weakens the Market
There are cases where the liquidity concept weakens the strength of market structure levels. For example, here is a market structure diagram showing higher highs and higher lows.
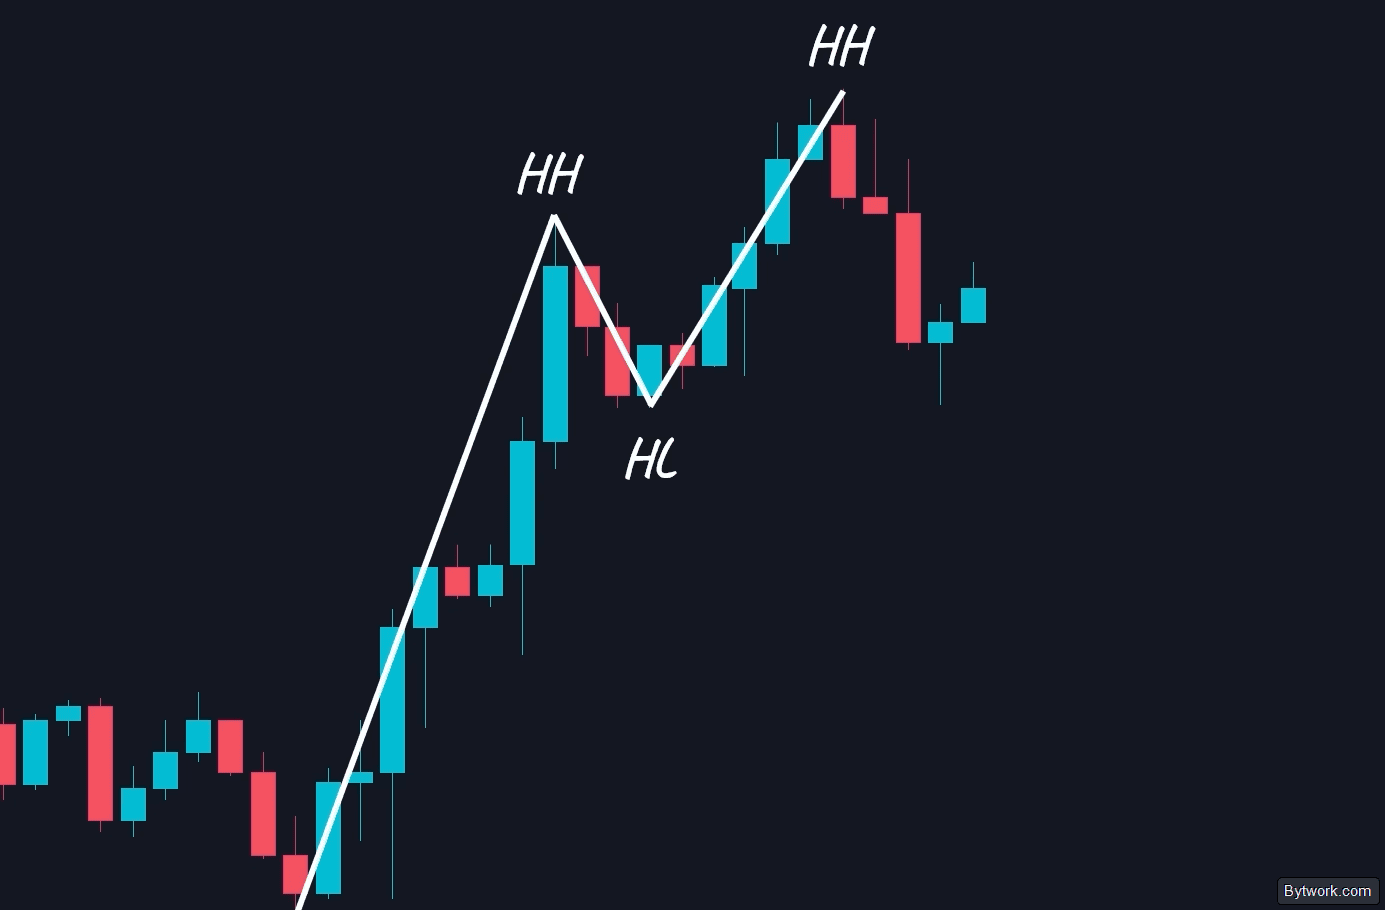
Usually a break of a low would be seen as a trend reversal, but it may actually be a demand zone (fair value gap) where smart money collects liquidity before continuing higher:
To avoid falling into the trap of an imperfect trend, use the big traders' checklist: structure, fair value gaps, equal extremes as liquidity zones, supply/demand, and potential entries.

To select a quality zone from the mass of noise on the chart, use 3 filters:
- Candles in the move away from the zone should be large and clean, with no wicks (institutional impulse). For precise filtering of market noise and determining the true strength of such an impulse, use Heikin Ashi candles.
- The zone should not have been tested before.
- The move out of the zone should result in breaking a previous significant high or low.
Other Liquidity Zones and an Order Block Example
There are many liquidity zones, such as trendlines, consolidation areas, and even major moving averages, etc. But we mainly focus on equal highs and lows. We want to keep everything as simple as possible and be able to use this concept to our advantage.

The combination of liquidity and market structure also appears in order blocks. The gap between candles acts as a magnet: price tends to fill it, capture liquidity below the first order block, then soften the second block and continue rising.

It's important to understand two key points:
- always look left before entering to avoid unnecessary risk;
- if there is a gap and a second order block below the first, the break is NOT a change of character – it is most likely a liquidity grab, not a reversal.
What Are the Drawbacks of Liquidity Zones?
Smart Money strategies are effective, but working with liquidity is dangerous. Let's cover the drawbacks for completeness of the guide.
- No guarantees. Liquidity zones and FVGs do not predetermine a reversal. Even correct analysis does not protect you from a loss, especially with leverage.
- Traps. The market creates false breaks to harvest your stop‑losses. Familiar levels lose their meaning – you may confuse a liquidity sweep with a reversal. In a strong trend, a break of a high will continue the move, not reverse it! To avoid falling into a trap, use Pi Cycle Top.
- Timing. Entering before liquidity is swept = stop‑loss hit. Always wait for confirmation – a reversal candle or a break on the lower timeframe. In crypto, manipulations are common.
- Psychology. Price is not obligated to react. Don't invent levels – if it's not obvious, better skip the trade. The market creates inducement near your point of interest, turning your stop into someone else's liquidity.
- Level conflict. An FVG at a strong support/resistance level gives way to supply/demand zones.
The bottom line is that liquidity is context, not a signal. Without confirmations and risk management, trading turns into a lottery.
Conclusion
Liquidity zones are clusters of retail traders' stop‑losses beyond significant support levels (below lows) and resistance levels (above highs). Large whales intentionally push price into these zones, triggering stop‑losses and causing cascading buying or selling pressure, allowing them to enter or exit with minimal slippage.
There are also limitations in identifying liquidity zones. These include the lack of objective criteria to distinguish deliberate manipulation from market noise and volatility, as well as the high risk of false breaks of levels without a subsequent reversal if additional filters (volume, candlestick patterns) are not used.
We have been trading since 2018 and have tested hundreds of strategies and indicators. The trading section will help you choose a trading system! And if you are not yet confident in your charting skills, you can watch experienced players' trades and copy them via copy trading.
Also always remember that risk management and backtesting are the most important factors determining a trader's success.
Pavel Grachev, specifically for bytwork.com.

Now reading


In DePin, people create networks themselves, share traffic or capacity, and receive rewards in tokens from these projects.