Secrets of the Moving Average in trading: How to Use, build, and trade

You will learn about 3 ways to use the moving average indicator to obtain precise trading signals. Determining trends, price reversals, and dynamic support/resistance, combined with understanding the differences between moving average types (MA, EMA, AMA), will help you better understand market structure. Let's start with the basics.
What is a Moving Average?
A Moving Average (MA) is a simple technical indicator that calculates the average closing price of an asset over a specific period. For example, a 10-period moving average calculates the average closing price of the last 10 candles and shows the trend.
Simple analogy: sellers offer apples at 12, 8, 10 rubles, etc. The average is 8.5 rubles (across 6 sellers). A price of 4 rubles is low, while 12 rubles is high. The average changes when the period changes.
The diagram below shows how a moving average works as a filter for market noise. False signals or price spikes are marked with red circles. The black line represents market noise, while the green line is the moving average.

Why is the line called moving? Because the calculation is recalculated with each new candle, the indicator line does not stand still but continuously follows price movement. This creates the visual impression that the average value is sliding across the chart.
For effective use, it's necessary to understand its calculation principle, so let's briefly examine the essence.
How is a Moving Average Calculated?
A moving average is characterized by its length (number of periods) and type. The length depends on the timeframe: EMA 20 on a daily chart means 20 days, on an hourly chart it means 20 hours.
There are also 2 main types: SMA (Simple) and EMA (Exponential Moving Average).

The formula for a simple moving average: the sum of closing prices over n periods, divided by n.
Example for SMA 5: (7 + 6 + 5 + 4 + 3) / 5 = 5.
Why Use Periods 20, 50, 100, and 200?
Different moving averages are used for different trends: the 200-period moving average helps determine the long-term trend, while the 20-period helps determine the short-term trend. The periods 20, 50, 100, and 200 are among the most popular settings.

- 20 (short-term trend) - a fast line for intraday trading. Reacts sensitively to price but often gives false signals.
- 50 (medium-term trend) – offers a balance between speed and stability. Acts as a support/resistance level.
- 100 (long-term trend) - for fundamental analysis. Filters out market noise.
- 200 (global trend) - the gold standard. Price above the line = bull market, below = bear market. Most effective when horizontal, often leading to strong bounces.
It's important to understand that a moving average is a lagging indicator because it uses mathematical calculations based on past periods. The larger the period setting (e.g., 200 instead of 20), the more past data is considered and the more pronounced the lag.

To reduce these lags, you can use exponential averages (EMA). But more on that below.
Let's first delve into specific ways to use it that will help you make informed trades.
Why Use a Moving Average?
The moving average (MA) has 3 functions:
- determining the trend - price above MA or the line sloping up indicates an uptrend; price below or the line sloping down indicates a downtrend.
- identifying trend changes - occurs when the line is broken.
- determining support and resistance levels - acts as a dynamic zone from which price often bounces.

Since the moving average is a trend-following indicator, its task is to help you understand the price direction through trend analysis.
Before using moving averages, it's important to understand how Japanese candlesticks are formed and what patterns exist. Let's see how to determine a trend.
How to Determine a Trend?
Three techniques are used to determine a trend. The first is comparing price and the moving average.
The position of the price relative to the moving average helps determine the market trend. If the price is above the moving average and consistently holds above it, the market is considered to be in an uptrend.
As logical traders, you'll want to trade with the trend, so in such a case, you should look for buying opportunities.

If the price is below the moving average and remains below it for some time, it's a downtrend, and you should look for selling opportunities.

Finally, in a sideways (flat) market, the price does not stay above or below the moving average for a long time – it swings from one side to the other like a pendulum. In such situations, it's better to refrain from trading and wait for a clear trend.

In the absence of a clear market direction, the moving average loses its effectiveness and generates many false signals.
Using 2 Moving Averages
For higher-quality analysis, you can use 2 moving averages with different periods – this gives you both a short-term and a long-term perspective on price.
Consider a simple example: on the chart below, there are 2 moving averages – the yellow line (20 MA) and the blue line (200 MA). The 20 MA is the short-term average, showing the short-term trend, while the 200 MA is the long-term average, reflecting the long-term trend.

If we temporarily ignore the 200 MA and focus only on the 20 MA, then during periods when the price is above it, we see an uptrend and look for buying opportunities.

Similarly, when the price is below the 20 MA, it's a downtrend, and we look for selling opportunities, as shown below.

However, upon closer inspection below, you can see that during these downward moves, there was no significant price impulse. If we bring back the 200 MA to the chart, you'll notice that the price remained above it all this time, indicating a long-term uptrend. This additional information suggests that selling during that period would have been risky, as you would have been going against the long-term trend!

Here's another example. When zooming in on a section of the chart, you see that the price fluctuated around the 20 MA for a long time, meaning it was in a short-term sideways trend. But at the same time, the price remained above the 200 MA. This indicates a long-term uptrend.

So, we have sideways movement with a long-term upward bias. In such a case, either avoid trading due to the range, or look to buy near the lower boundary of the range. Selling near the upper boundary should be avoided because it would contradict the long-term trend!

Using 2 moving averages doesn't guarantee more profitable trades, but it helps avoid bad ones.
Moving Average Slope
The slope of the moving average also gives you an idea of the trend's strength. In an uptrend, the moving average points upward. In a strong uptrend, the slope is steep, close to 45 degrees; in a weak one, it's shallow.

The same holds true for a downtrend: during a strong downward move, the slope is steep (around 45 degrees); during a weak one, it's shallow.

This information is useful because in a strong trend, you can be more aggressive when entering a trade, while in a weak trend, you should exercise caution.
Large and Small Moving Averages
Another way to determine the trend is to use 2 moving averages and look at their relative position.
For example, let's plot 50- and 200-period moving averages on the chart. The 50-period is called the fast average, and the 200-period is the slow (long period) average.

- When the 50 MA is above the 200, the price is considered to be in an uptrend, and we look for buying opportunities (see image below).
- When the 50 MA is below the 200, the price is in a downtrend, and as logical traders, we look for selling opportunities.

To determine the stability of a trend, several periods are analyzed simultaneously (e.g., 9, 20, and 50, or 20, 50, and 200).
So, we've covered 3 techniques for determining a trend using a moving average. Now let's move on to using the moving average to identify reversals.
How to Identify Reversals?
There are 2 methods for identifying reversals – moving average crossovers and price crossovers. In professional slang, these crossovers are called "Golden Cross" and "Death Cross".
Moving Average and Price Crossover
In an uptrend, the price typically stays above the moving average, and in a downtrend, below it. Based on the same logic, when the price crosses the moving average from top to bottom, it signals that the uptrend has ended and a downtrend is beginning – a bearish reversal.

When the price crosses the moving average from bottom to top, it indicates the end of a downtrend and the start of an uptrend – i.e., a bullish reversal.

Remember: not all crossovers are signals; many of them can be false!

A buy signal – if the price crosses the moving average from bottom to top, indicating the start of an uptrend (long). A sell signal – when the price breaks the indicator from top to bottom, signaling a downward move (short).
Moving Average Crossovers
Moving average crossovers are one of the most popular ways to use the indicator. You'll need 2 moving averages with different periods – again, let's use 50 and 200 MA.

Earlier, we determined that in an uptrend, the shorter average is above the longer one, and in a downtrend, it's below. Following the same logic, when the shorter average crosses the longer one from top to bottom, it indicates a transition from an uptrend to a downtrend – i.e., a bearish reversal. This is called a Death Cross.

Conversely, when the shorter average crosses the longer one from bottom to top, it's a transition from a downtrend to an uptrend, i.e., a bullish reversal. This is called a Golden Cross.

We do not recommend opening trades based solely on these signals, but they can be used in combination with other factors for more informed decisions. For example, you can add support/resistance levels, candlestick patterns, or oscillators (RSI, stochastic) to confirm momentum.
Dynamic Support and Resistance Levels
Usually, when talking about support and resistance, we mean fixed price levels from which the price will bounce. However, moving averages can act as dynamic levels.

In an uptrend, the price stays above the moving average, and each time the price returns to it, it finds support. Therefore, in an uptrend, you can look for buying opportunities near the moving average. In the example below, the average acted as support three times.

In a downtrend, the price is below the moving average, and each approach of the price to it encounters resistance. So, in a downtrend, look for selling opportunities near the moving average. In the example below, the price found resistance 5 times.

This is how a moving average can act as a support or resistance level.

Experienced traders don't just look for touches of the lines but for a change in candle color in the MA zone. For example, during a pullback to support, you should wait until a green candle fully engulfs (neutralizes) the previous red candle right on the average line.
What Types of Moving Averages Are There? SMA, EMA, and AMA
There are 3 types of moving averages, differing in their calculation formula:
- SMA (Simplest) - arithmetic mean of closing prices with equal weight. Slow to react to changes, significant lag.
- EMA (Exponential) - gives more weight to recent data, reacts faster and stays closer to price.
- AMA (Adaptive) - takes volatility into account. Slows down in a flat market, speeds up in a trend.

The type of MA used depends on the strategy and timeframe, but the difference between EMA and SMA is critical, as shown below.

|
Moving Average Type |
When to use? |
|
SMA (Simple) |
• Long-term trends (SMA 200) |
|
EMA (Exponential) |
• Intraday trading and scalping |
|
AMA (Adaptive) |
• Frequent trend/range transitions |
Besides the classic types, there are also adaptive types:
- WMA (Weighted) - each price has its own weight, but recent values are most significant. Reacts faster than SMA.
- HMA - combines fast reaction and smoothing. Considered much more "responsive" compared to classic EMA and SMA, but due to its sensitivity, it may generate more false signals.
- ALMA - uses Gaussian distribution for smoothness and noise reduction.
- Zero Lag EMA - a modification of EMA to minimize lag. Allows you to get entry signals significantly earlier than classic EMA. This is important in volatile crypto markets.
- VWMA - takes trading volume into account.
- SMMA (Smoothed) - minimizes the impact of random spikes and makes the line smoother.
By combining different types, you can build complex indicators like MACD (the difference between 2 EMAs).
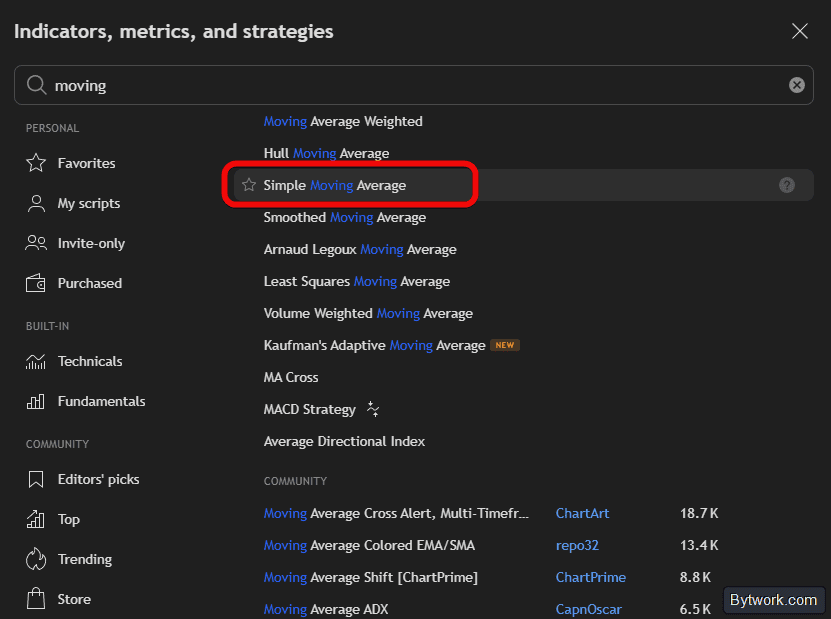
How to Add MA to a Chart?
To add a moving average to a chart in TradingView, click on Indicators at the top of the screen and search for moving average. Options for Simple Moving Average (SMA) and Exponential Moving Average (EMA) will appear. Add your preferred indicators to your favorites so they are always accessible in the Favorites tab.
After clicking on the indicator, it will appear on the chart. If necessary, click on it multiple times to add several moving averages simultaneously.
After adding, open the settings by clicking the gear icon and go to the Inputs tab. Here, select the period for each average. Instead of the rarely used period 9, we recommend considering values like 50, 100, and 200. The 50-period acts as a short-term trend indicator, 100 as medium-term, and 200 as long-term.
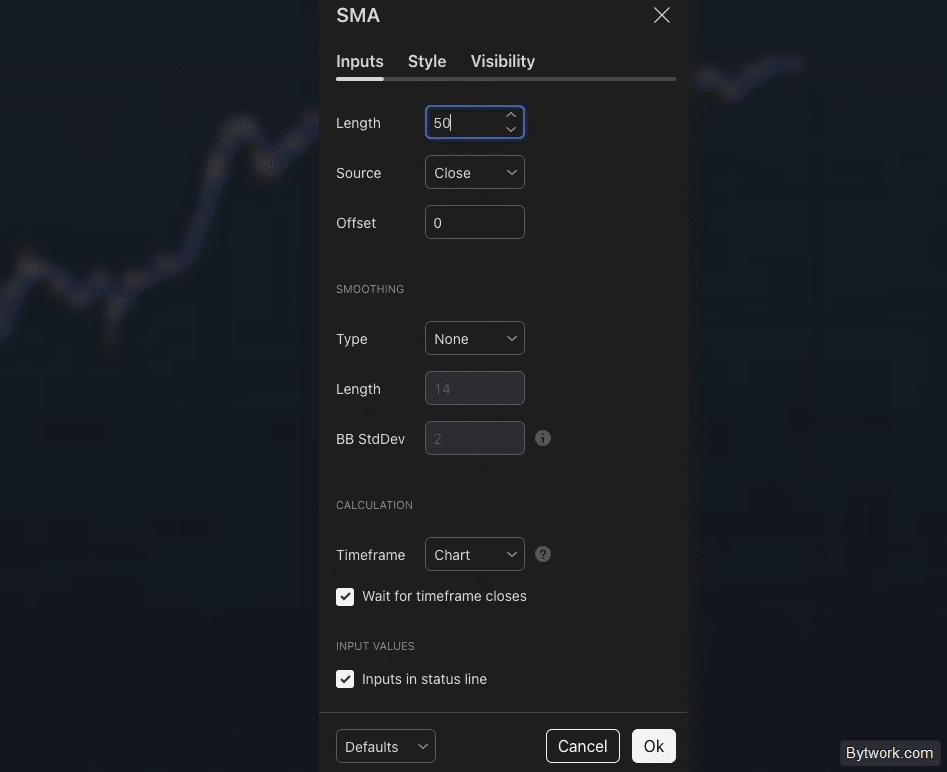
Set, for example, the period 50 for the first average, 100 for the second, and 200 for the third, and you'll see how they are calculated and displayed differently on the chart.
By default, the moving average period is tied to the chart's timeframe: on a weekly chart, a 50-period MA is calculated as 50 weeks; when switching to a daily chart, it's 50 days. In the indicator settings, you can manually set a fixed interval, for example, displaying a weekly average on a daily chart.
If you need to add another one, simply open another instance of the same indicator.
What Advanced Insights Are There for the Crypto Market?
The crypto market is more aggressive than the stock market. Using MA in its raw form here is a recipe for losses due to sharp volatility spikes.
1. Noise and False Signals
Bare MAs give many unprofitable entries. For altcoins, HMA is too fast; it's better to use ALMA – it's more resistant to noise.
2. The Second Crossover
The first MA crossover in crypto is often false. Within the global trend (150 EMA), it's safer to enter on the second signal.
3. 200 MA as a Level
On ETH, the 200 MA often acts as a ceiling before a breakout. On the daily chart, a break of the 200 MA defines a cycle shift.
4. RSI Filtering and EMA Channel
Use EMA 20 High/Low as a zone. If RSI > 50, a pullback inside the zone is a correction, not a reversal. We enter based on a color change of Heikin Ashi when exiting the zone.
5. Combining Signals
It is also recommended to combine MA crossovers with other systems, such as Fibonacci, to avoid entering a trade based on a single indicator.
It's important to understand that MAs in crypto only work as part of a system with levels and confirmations. A single line is often unprofitable. But these are not the only risks.
What are the Disadvantages and Risks?
Obviously, the fundamental disadvantage of a moving average is its lag. Let's examine the problems with MA and how they can be addressed.
Table 1 - Fundamental Limitations of MA
|
Disadvantage/Trap |
What happens and how to minimize? |
|
Lag Effect |
Problem: MA is built on past prices – signals arrive when the trend has already passed or is about to reverse. |
|
Sideways Market (Range) |
Problem: In the absence of a trend, price crosses the MA back and forth (sawtooth effect) and generates many false signals. A horizontal MA loses its predictive power. |

Table 2 - Strategic Traps
|
Disadvantage/Trap |
What happens and how to minimize? |
|
Golden Cross |
Problem: The 50/200 MA crossover often occurs at the end of a cycle at maximum overbought levels – entering a long means buying at the peak (highs). |
|
Thin Line |
Problem: Traders perceive MA as a pinpoint price, but it's a dynamic zone. Price can easily pierce the line without an actual breakout. |
|
Over-optimization |
Problem: Multiple MAs on the chart cause analysis paralysis. |
|
Structural Conflict |
Problem: Trading based on an MA signal when price is hitting a strong historical horizontal resistance level is a fatal mistake. |
It's also important to understand that on lower timeframes (1-5 minutes), the risk of false signals is significantly higher due to market noise.
Summary
The market does not move randomly. It follows structure, order flow, and intentions. By mastering the application of moving averages, you will be able to better see these market intentions.
The methodology relies on 3 elements:
- using moving averages with fixed periods (20, 50, 200),
- analyzing the slope angle (from shallow to 45°) to gauge trend strength,
- and mandatory confirmation of signals on a higher timeframe (15 min - 1 hour, 1 hour - daily).
It's important to understand that the 3 strategies – support/resistance, breakout, crossovers (death cross and golden cross) – provide signals that on average lag by several candles, while the number of false triggers increases in a range or during low volatility.

This is precisely why standard SMA lags significantly, and we more often use ALMA, EMA, and additional filtering through RSI, TSI, and Heikin Ashi candles.
And the length settings (9, 20, 50, 100, 200) and type (SMA/EMA), as we've shown, directly affect signal lag and the frequency of false triggers.
For example, a strategy is often based on 3 elements:
- 20-period EMAs from high and low forming dynamic support/resistance zones,
- entry signals determined by the color change of Heikin Ashi candles,
- and the RSI's position relative to the 50 level (above = bullish momentum, below = bearish momentum) acting as a filter.

Classic crossovers (Golden Cross) are often unprofitable if you don't know the following nuances:
- The first crossover of averages is often false and creates liquidity for whales/manipulation.
- Advanced insight – wait for the second crossover in the direction of the global trend (e.g., 150 EMA).
- If the price temporarily moves outside the MA zone, but the next candle brings it back inside (fences it in), this is a more reliable signal than a simple touch.
- The market doesn't obey all averages at once. You need to find the one the last pullback bounced from. If the price bounced off the 13 MA, then that one is dominant, and the 20 MA can be temporarily ignored.
Final Pro Checklist:
- Always filter moving averages using a higher timeframe or the 200 MA.
- An MA breakout is considered valid only with an increase in volume and the formation of an impulse bar (2-4 times larger than previous ones).
- Safe trades are more important than their quantity. Focus 80% of your trades only on bounces from a flat 200 MA or a sloping 20 MA.
- Use standard periods (20, 50, 200) because most market participants see them. This makes the levels more respected by the market.
- The best signal is when a dynamic level (MA) coincides with a horizontal historical level or a 0.618 Fibonacci level.
A moving average should never be perceived as a thin line. Professional traders (e.g., Oliver Velez) consider it a dynamic area or zone with thickness.
.
We have been trading since 2018 and have tested hundreds of strategies and indicators. The trading section will help you choose a trading system! Your editor is Pavel Grachev for bytwork.com.
This material is for informational purposes only and is not financial advice.

Now reading


In DePin, people create networks themselves, share traffic or capacity, and receive rewards in tokens from these projects.


The Ellipal firmware update enhances security (fixes vulnerabilities), adds support for new cryptocurrencies and tokens, and optimizes the interface and operational stability.


