Does the BTC Power-Law model actually work? And why does it pencil in $1 million?
- Bitcoin behaves like a living organism, not a stock. Its price follows power laws, much like the growth of cities, technologies, or trees.
- The model accounts for 92% of historical price movements.
- The theory also allows for the possibility of Bitcoin reaching $10 million per coin, assuming adoption by only a small fraction of the global population.
- However, the model may be overfitted to historical data and overlooks black swan events and speculative dynamics.

Astrophysicist Giovanni Santostasi revealed the law of Bitcoin's price path to $1 million, and his publication from 7 years ago looks frighteningly accurate. Let's fully understand this theory. You'll get a fascinating insight into the fundamentals of how BTC works and a calculator for your own calculations at the end.
According to the Bitcoin Power Law Theory (PLT), the price and metrics of BTC do not follow classical financial models, but obey universal power laws, as in natural phenomena: the growth of cities, technologies, trees, and animals. In other words, BTC is considered an organism because its code has built-in growth drivers.
And this makes its behavior and price significantly more predictable than it seems!

The figure shows a chart of BTC's price growth since its creation. Black shows the price, red – the power law. The coefficient R² = 0.92101 shows that the model explains about 92% of the data variability. A good result.
This theory was developed by Giovanni Santostasi, who holds a PhD in astrophysics. He worked as a neurobiologist at Northwestern University, studying consciousness, intelligence, memory, and the role of sleep. At the same time, the theory does not contradict BTC's price surges and crashes due to market manipulations.

Dr. Santostasi insists that this is the only complete scientific theory of Bitcoin, mathematically confirming its resilience. Let's see if this is true.
How the Bitcoin Power Law Theory works
A power law is a mathematical model of the form y = axⁿ, which describes phenomena where the result becomes the input for the next cycle. This can be clearly seen by plotting the Bitcoin price on a logarithmic scale - it forms a straight line. This is striking because no other asset follows a power law with such precision.

Chart source here.
Such laws are found not in finance, but in nature. For example, the spread of a virus. At an early stage, infected people infect new ones, and the process grows not linearly, but exponentially, until external factors intervene - vaccines, isolation, etc.
From this perspective, Bitcoin resembles the spread of a virus:
- The current network power influences future power,
- current users bring in new ones,
- network growth is a cyclical process, not just accumulation.
Before we continue, calculate for yourself the projected Bitcoin price according to the power law:
Bitcoin Power Law Calculator
The calculator estimates the fair price based on the cost of mining one bitcoin and the power law formula. Below we will look at where such a formula comes from.
Now let's look at all 7 points of the theory to understand if it works or to refute it.
Point 1 of the theory - Interest
Satoshi created Bitcoin, and people started mining it on their laptops, while others invested in it out of curiosity. Over time, interest grew, and people began to participate more seriously in discussions and trading.

The figure shows the projected action of this theory until 2040.
Point 2: Price and Users
The second point states that the price of Bitcoin, and in general the value of the network itself, began to increase in proportion to the square of the number of users. This empirical observation is based on a power law between price and the number of addresses, which serves as an approximate indicator of the number of network users, and it confirms a theoretical result known as Metcalfe's Law.
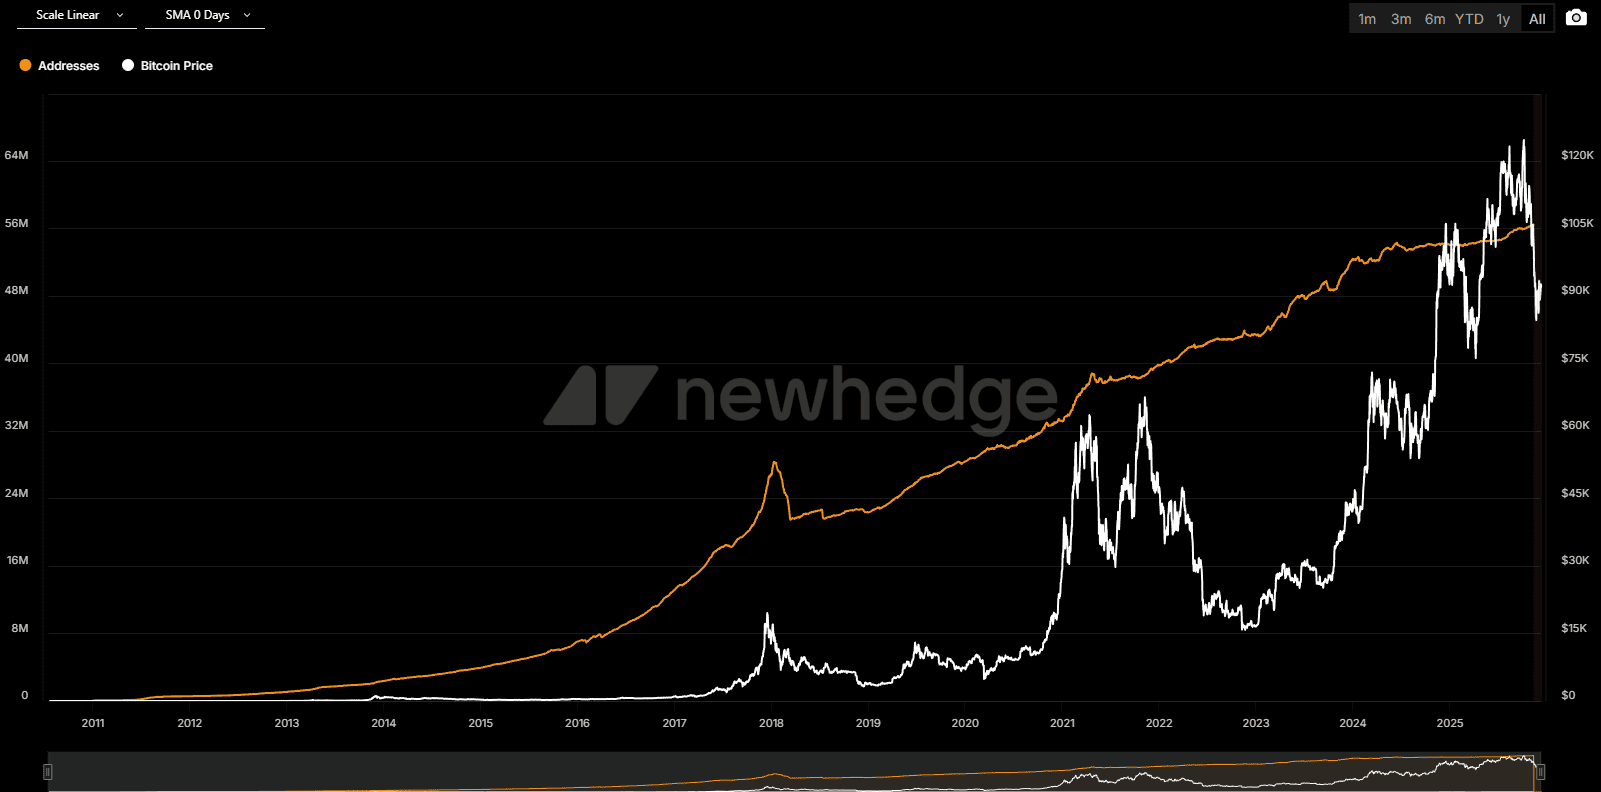
Red line: as the number of users (active addresses) grows, so does the price.
Satoshi probably didn't think about power laws when creating Bitcoin, but he definitely created ingenious mechanisms that ensure the system's stability through mining and difficulty adjustment.
Mining and Difficulty Adjustment Mechanism
The system is balanced. The difficulty adjustment automatically regulates mining difficulty so that 2016 blocks are mined in approximately 2 weeks (10 minutes per block). If blocks are found faster due to increased network power, difficulty increases; if slower, it decreases.
Power laws arise here from feedback loops: price rises, attracts miners, hashrate increases quadratically, and the mechanism balances everything.
Point 3: Inflow of Resources
The growth of Bitcoin's price following the increase in its user base attracted more resources, particularly mining power and capabilities.
People create increasingly advanced and larger mining farms, competing for their share of coins.

Point 4: Compensation Mechanism
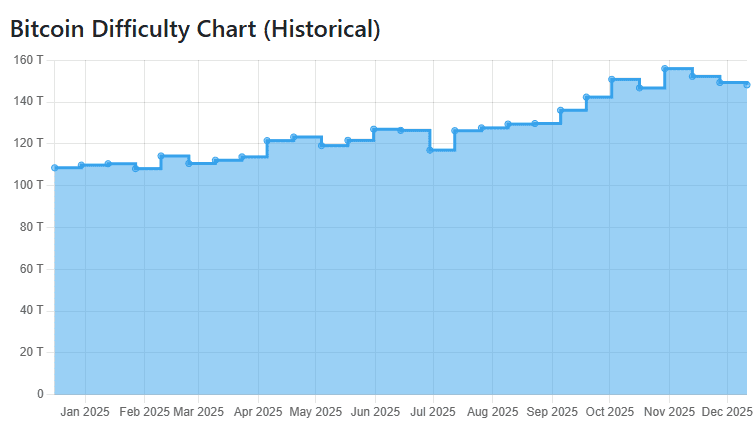
In some analyses of this theory, the dependence of other quantities is additionally considered. For example, hashrate or network value. According to the model, these metrics demonstrate a quadratic dependence on price (exponent P^2).
Simply put, if the price doubles, the corresponding metric (e.g., network power) grows approximately fourfold.

Yellow line – price, orange – mining difficulty, blue - network power.
This simplified calculation and logical reasoning are confirmed by the empirical observation of a power law where P^2 is proportional to hashrate in Bitcoin data.
Point 5: Security Growth
The increase in hashrate improved the system's security, and this attracted more users worldwide. Some might say that most people buy Bitcoin not for security, but indirectly it is true, because if the system were not secure, huge amounts of capital would not be invested in it.

Thus, the security of the system directly or indirectly attracted more users.
Point 6: Technology Adoption Growth
The number of Bitcoin users grows in proportion to the cube of time. This is a new discovery of this theory. Most Bitcoin adoption models refer to S-curves typical for the adoption of many technologies, such as televisions, refrigerators, cars, and cell phones; however, Bitcoin does not follow an initially exponential S-curve.
Instead, it follows a power law of the cube of time. It turns out that many phenomena based on an S-curve adoption mechanism actually become power laws if there is some limiting mechanism present.

In the case of Bitcoin, this mechanism is served by both difficulty adjustment and the risk inherent in any investment, so empirically one can observe that Bitcoin adoption growth obeys a power law of the cube of time.
Point 7: Interrelation of the 7 Laws
The seventh and final point of the Theory states that the power law growth of Bitcoin adoption, combined with its other power laws (addresses, price, and network power) are interrelated into a single cause-and-effect picture. Establishing this cause-and-effect relationship allows us to claim that PLT is a full-fledged Theory, not just a model.

On the other hand, a theory is not yet a law, it's just a theory. It's time to look for its flaws.
Criticism of the theory
It is quite possible that Santostasi's work is not a scientific law, but rather a manipulation of historical data. Santostasi merely straightens the curve – it's simple mathematics. One could also call it chart manipulation.
|
Criticism |
Essence of the criticism |
|
Data Manipulation |
The author (Santostasi) straightens the curve by fitting numbers and changes parameters for future cycles. Even after that, the model line does not exactly match the data. |
|
Ignores Many Factors |
The model only considers price and time, ignoring demand, supply, economic variables, and black swan events. |
|
Relies Only on BTC History |
The model extrapolates the past into the future, which is hypothetical and may not account for real future events. |
|
Exaggerated Status |
The term 'theory' is more appropriate than 'law', as the latter exaggerates the model's accuracy for a complex system. |
|
Speculative Nature of the Market |
Growth may be more driven by speculation (a zero-sum game) rather than real technology adoption, which the model does not account for. |
Moreover, the author of the theory, Santostasi, probably just earns money from this. He monetizes his popularity by speaking at numerous podcasts, conferences, and platforms.

On the other hand, the double logarithmic scale chart of Bitcoin still shows a straight line. This means that Bitcoin does not need to be adopted by the majority to reach a high price but will continue to grow, following its scaling-cyclic path.
Forecasts according to the model
According to PLT, Bitcoin could reach $1 million around 2033. This is also confirmed by a calculation showing that Bitcoin will increase its value by 10.63 times in 8 years (i.e., by the time it turns 24 years old),. This corresponds to approximately $1 million.
Santostasi also claims that only a small part of humanity is enough to push Bitcoin's price to $10 million.
Forecast of $13 million by 2045
Although this is not a direct forecast by Santostasi, he mentions that the average scenario presented at a conference predicted $13 million by 2045. Santostasi's own calculation for 2045 gives about $4.5 million.
Forecast for the end of 2026 (cycle bottom)
After the peak in 2025, a correction is expected, which will last about a year, and by the end of 2026, the price will return to the support line at around $65,000.
Read: History of Bitcoin cycles and 4-year growth charts
What about bubbles?
Bubbles are deviations on the price chart from the average trend in the form of the power law's straight line. The theory explains their behavior through self-correcting mechanisms that distinguish Bitcoin from purely speculative assets.
Bitcoin has anti-bubble mechanisms: the price always returns to the line of fair value, regardless of growth cycles or crashes. A crash occurs when the price rises too fast compared to hashrate, because mining infrastructure cannot be scaled instantly, and the system corrects itself.
Bubbles arise from fear of missing out, not from fundamental adoption: the address growth model hardly reproduces them.
Bubbles form regular 4-year cycles: one year of growth to a peak, one year of correction to the support line, and 2 years of consolidation around it. The exponential rise is compensated by a fall, and fluctuations around fair value almost balance each other out.
Historical verification of the theory's calculations
Calculations show that the formula predicts the price very accurately. For example, substituting 6009 days, the formula gave a result of $17,250, and this was almost exactly the market price.
When calculating how long it took Bitcoin to reach $1, the formula predicted 880 days, while in reality it took 915 days. This is a discrepancy of only a few weeks.
How to calculate Bitcoin's growth yourself?
Santostasi offers a simple formula for calculating Bitcoin's fair price based on its age.
3 steps for calculation:
- Determine Time (Days)
Count the days since January 3, 2009. - Power Law Formula
P = 10-17 × (Days)5.83- 10-17 – to get a price ~0 on the first day.
- Exponent 5.83 – reflects nonlinearity.
- Calculation
Substitute the days into the formula (calculator or browser). The result is the fair price according to PLT.
Calculating the future price can be done by simply extrapolating the current growth. For example, doubling Bitcoin's age (from 16 to 24 years) should lead to an approximately 10.63x increase in price. This essentially corresponds to the $1 million forecast.
Dr. Santostasi compares the BTC phenomenon to physics:
"From the perspective of the power law, time for Bitcoin slows down as it grows."
This means that Bitcoin does not need to radically change its behavior to reach the next orders of magnitude. It simply continues doing what it has been doing since the very beginning.
Historical facts about growth
Bitcoin is the fastest-growing asset in human history. In 15 years, it has grown approximately 100 million times since the first transactions.
Bitcoin's growth surpasses any other asset, including Amazon, Apple, Microsoft, and Nvidia, and they are not even in the same order of magnitude!
The theory includes a strong support line that Bitcoin's price almost never crosses. This support line is a physical limit determined by the cost of mining.

According to a CoinShares report, the average cost of mining one bitcoin is ~$55,950, and including non-cash expenses (depreciation, employees) it reached ~$106,000. Mining remains profitable at a Bitcoin price of $100,000.
Conclusions
This is a theory, not investment advice or a prophecy.
The Bitcoin Power Law is one of the most coherent and elegant models explaining:
- why BTC doesn't grow like a stock,
- why bubbles repeat,
- why the price can be predicted,
- and why all of this is not randomness, but a system.

Now reading


In DePin, people create networks themselves, share traffic or capacity, and receive rewards in tokens from these projects.


The Ellipal firmware update enhances security (fixes vulnerabilities), adds support for new cryptocurrencies and tokens, and optimizes the interface and operational stability.


