Fibonacci in Cryptocurrency: A Complete guide to applying levels for BTC and altcoins

The Fibonacci system helps identify optimal entry points in a trend, eliminating the dilemma of buying at the peak or waiting for a pullback. The tool shows 3 main retracement levels where the price is highly likely to reverse, allowing you to enter at a favorable price and plan your exit.
The most confusing part of Fibonacci analysis is the subjectivity in choosing swing points.
We will offer a mechanical method that eliminates guesswork and makes level construction objective. You will also learn how to avoid trading traps.
Let's briefly review what the Fibonacci sequence is and why it works.
What is Fibonacci?
Fibonacci is a universal mathematical sequence of numbers (1, 1, 2, 3, 5, 8, 13, 21, etc.), where each subsequent number is the sum of the 2 preceding ones. The system is familiar to many as a spiraling pattern, and you can find it everywhere in nature – from the structure of seashells to the spirals of galaxies.

Leonardo Fibonacci discovered this pattern, and it works not because of "magic," but due to the combination of natural rhythms (impulse and correction waves) and the collective attention of traders, which turns mathematical levels into real physical barriers for price.
How Does Fibonacci Work in Crypto Trading?
In chart analysis, what matters are not the numbers themselves, but the ratios – the proportions obtained by dividing them. The most significant is 0.618, known as the Golden Ratio. – A zone for price reversal.

In addition to the 61.8% level itself, traders highlight 2 areas:
- Golden Zone – the area between 0.5 and 0.618. It is considered the zone of highest probability for price reversal after a correction.
- Golden Pocket – most often defined as a narrow range between
0.618and0.65. In this area, the greatest number of trading orders are concentrated, as millions of traders and algorithms watch these levels simultaneously.

Fibonacci tools (retracement and extension grids) solve 2 problems:
- Finding entry points (retracement). When an asset's price makes a sharp move (impulse), it rarely moves in a straight line. Usually a pullback follows. Fibonacci levels predict where this pullback will end, and the price will resume the trend.
- Determining targets (extension). Fibonacci helps calculate the levels to which the price may rise in the future, allowing timely profit-taking.
Why Do Fibonacci Levels Work?
Fibonacci numbers work on the principle of a self-fulfilling prophecy. It's not magic. It's mathematics.
Since the global practice of trading education highlights the levels 0.5 and 0.618 as key, a huge number of traders simultaneously place orders and stop-losses exactly at these points.
Fibonacci is a magnet for liquidity!
These points act as a magnet for liquidity. Therefore, large players use these zones to accumulate positions or create traps for retail traders. Whales know that there is a maximum concentration of trading orders. Add to this trading bots that also focus on these levels.
Joint buying or selling actions create real pressure on the market, causing the price to bounce or reverse exactly where Fibonacci predicted.
There are 3 methods in Fibonacci:

- Fibonacci retracements – determine the zones where a pullback ends (levels 38.2%, 50%, 61.8%) for entering the trend – acting as support/resistance.
- Fibonacci extensions – forecast Take Profit targets after a pullback, beyond the extremes.
- and Fibonacci projections – measure the length of a new impulse wave (using 3 points) as 100% + of the previous one.
Retracements carry the main idea: after a strong impulse move, the price returns by a certain percentage before resuming the trend.
So let's understand what Fibonacci retracements are.
What is Fibonacci Retracement?
Price moves in a zigzag: impulses in the direction of the trend are followed by pullbacks. The best moment to enter a trade is when the pullback ends and a new impulse is about to begin.

The Fibonacci grid, drawn from the start to the end of a trend move, shows 3 key price levels where a pullback typically occurs.

Upon reaching these pullback levels, the price is highly likely to reverse and continue the trend. These levels are Fibonacci retracements.
Let's look at the meaning of each level, paying special attention to deep and shallow pullbacks.
How to Read Fibonacci Pullback Levels?
When the price pulls back to the 38.2% level, it indicates a strong trend, as each pullback is seen by traders as an opportunity to enter. But such trends are rare, and trading off it is not recommended. The price more often pulls back to the golden zone (50%–61.8%), which indicates the maturity of the trend.

However, the 50% and 61.8% levels by themselves don't say much, and moreover, they carry traps for traders. It all comes down to a structural understanding of the market.
- The basis of analysis is the 3 market states and its structure. Without structure, Fibonacci settings are meaningless!
- Structure is the foundation, and Fibonacci is just a measuring tool.
The market exists in only 3 states:

- uptrend, impulse
- downtrend, impulse
- or range (sideways).
In a trend, there are impulses and corrections, while in a range, price moves between support and resistance. Therefore, Fibonacci does not work in a range: it requires a trending environment!
In a sideways market, the 50% and 61.8% levels become traps, the price takes out stops and returns back. That's why most traders lose money in a range.
But the sideways market isn't the only one creating traps.
Why Do Fibonacci Levels Create Traps for Traders?
Since millions of traders enter at these levels 0.5 and 0.618, Fibonacci automatically becomes a trap. The point is that the 61.8% and 50% levels are not reversal points, but liquidity zones. Retail traders are taught to buy or sell at these levels, while institutions use them to hunt small traders.
What's the essence? Price touches the 50% level, retail traders prematurely enter the market, then institutions push the price deeper to the 61.8% level. This final push takes out most stop-losses, and as soon as liquidity is gathered, the real move begins.
Familiar in volatile crypto, isn't it?

At the 61.8% and 50.0% levels, retail traders sell, while institutions buy their positions, then reverse the price upward.
That's why Fibonacci may seem inconsistent; it's not about the levels themselves, but what manipulators do around them.
Understanding that the 50% and 61.8% levels are liquidity magnets allows you to stop trading Fibonacci like a retail trader and start reading it the way institutions use it!
By itself, the 50-61.8% range is not an entry point, but a place where a trap is set. Based on this, add Fibonacci only in a trending market after a structure breakout.
How to Add Fibonacci to a Chart?
In trading platforms, Fibonacci is in the tools menu. Select Fibonacci Retracement. You'll be able to draw the levels on the chart.
Levels are drawn strictly along the impulse move (the strongest candle wave) within the current trend:
- In an uptrend – the pullback is measured from the low point of the impulse (Swing Low) to the high point of the impulse (Swing High).
- In a downtrend – the pullback is measured from the high point of the impulse (Swing High) to the low point of the impulse (Swing Low).

Important:
- Fibonacci only works in a trend (uptrend or downtrend). Using it in a flat market is pointless, as there is no impulse move to measure.
- Due to the high volatility of the crypto market, Fibonacci should be drawn from the wick tips, not the candle bodies, to account for real liquidity zones.
If you want to make the grid more professional, you need to make a number of settings:

- To clear the chart of noise, disable background fill and price labels for levels below
0.236, and convert values from decimals to percentages. - To increase entry accuracy, add specific levels to the grid: the golden pocket zone (
0.65), deep discount levels (0.705, 0.71, 0.79), and the significant retracement level0.33. - For profit-taking, expand the settings with negative values (
-0.27, -0.618) and ratios above one (1.27, 1.618).
As mentioned earlier, many traders struggle with identifying swing points for constructing levels. Let's improve the data obtained from Fibonacci.
How to Improve Fibonacci Data?
To improve Fibonacci data, we use a simple indicator called Fractals. They help identify reversal points, marking them with arrows. There are 2 types of fractals: upper and lower.

- An upper fractal forms when a candle's high is higher than the highs of the 2 preceding and 2 following candles, signaling a bearish reversal.
- A lower fractal occurs when a candle's low is lower than the lows of the 2 preceding and 2 following candles, signaling a bullish reversal.
To add this indicator on TradingView, click the Indicators button, type Fractals, and select it.
By default, fractals mark all minor reversals, cluttering the chart. Change the period to 5 to highlight only strong points.

Then, in a trending market, draw Fibonacci on the impulse between fractals: in an uptrend – from the lower to the upper, in a downtrend – vice versa. The price often pulls back to the golden zone (0.618) and reverses.

Now that we've covered the basics, it's important to understand the Premium/Discount zones to avoid the risk of buying at the peak of a pullback and not becoming "liquidity" for large players.
Premium and Discount Zones – How to Know If the Price Is Favorable?
The concept of Premium and Discount is based on a simple rule: buy low, sell high. Using premium and discount zones helps avoid entering a trade too early and ensures a better risk-to-reward ratio (R:R).
The golden rule – always look for an entry in the discount zone (for longs) or premium zone (for shorts), preferably where Fibonacci levels form a cluster with other technical confirmations.

- Discount Zone (below 0.5): in an uptrend, this is the area of cheap prices. You should look for long entry points only in this zone. Buying above
0.5(in premium) is risky, as the market often makes a deep pullback to clear liquidity before continuing the rise. - Premium Zone (above 0.5) – in a downtrend, this is the area of expensive prices. You should only sell (short) here, when the price pulls back above the
0.5level. - The 0.5 level on the Fibonacci grid divides any trading impulse in half and is called Equilibrium.
Completing the full understanding of Fibonacci are clusters. Clusters on the chart form when at least 3–5 Fibonacci levels (e.g., 0.382, 0.618, 0.786) from different grids, drawn on impulses of the main trend and local moves, converge in a narrow price zone up to 0.5–1% of the amplitude wide.
The coincidence of such levels with additional signals – support/resistance levels or EMAs (e.g., 50-period and 200-period) – increases the probability of a price reversal to 70–85% according to backtests on volatile crypto markets.

Professional traders only enter such A+ setups with a risk/reward ratio of at least 1:3, where the confluence of factors minimizes false breakouts. These are advanced Fibonacci strategies, not just a grid.
Advanced Fibonacci Strategies
Let's look at real crypto trading strategies using Fibonacci and its combinations with other indicators and confluence.
It's important not to rely solely on Fibonacci levels in trading, but to flexibly use different strategies depending on the market structure.
Reliable analysis works only on higher timeframes (4H, 1D), as lower intervals are filled with noise.
Strategy 1 – Confluence of Mirror Levels (Swap Zones)
Mirror levels are one of our favorite techniques to add confirmation to any strategy. Essentially, they are support and resistance levels that switch roles after a breakout. When price breaks a support level downward, it becomes resistance, and when it breaks a resistance level upward, it becomes support. A Swap Zone is when a broken support becomes resistance or vice versa.

Combining this concept with Fibonacci retracements can identify trading opportunities. For example, in an uptrend, after a resistance level is broken upward, it turns into support. If the golden zone of the Fibonacci retracement drawn on the impulse move coincides with this support level, we get double confirmation.

When price pulls back to this area, look for an entry point.
Similarly, in a downtrend, after a support level is broken downward, it becomes resistance. If the golden zone coincides with this resistance, expect a price reversal downward when approaching this confirmation area.

Often, price may make a brief spike (poke) above the 0.618 level to gather retail traders' stop-losses, and only then begin the real downward move. Therefore, the most reliable signal is considered to be the candle closing back below the level after such a spike.
Strategy 2 – Confluence with Moving Average
Moving averages can act as dynamic support and resistance levels. In an uptrend, a moving average can act as support, and in a downtrend, as resistance.

For this strategy, we use the 50-period exponential moving average (EMA). In an uptrend, where price trades above the EMA and the EMA itself is pointing upward, expect price to find support at the EMA. If the Fibonacci golden zone coincides with the 50 EMA, we get strong confirmation and look for a buying opportunity near this area.

In a downtrend, where price is below the EMA and the EMA is pointing downward, expect the moving average to act as resistance. If the golden zone coincides with the EMA, look for sell trades on a price pullback to this area.

The strategy is considered highly accurate (A+ setup) if the Fibonacci Golden Zone (0.5–0.618) coincides with the moving average line. At this point, resistance is amplified many times over.
Strategy 3 – Using RSI with Fibonacci
What matters are not standard divergences, but hidden ones. This is when price forms a higher low, while RSI forms a lower low. Such a situation signals a strong trend continuation, if you know how to spot them.
Now overlay the Fibonacci grid: if the pullback lands right in the 0.618 zone, and at the same time RSI shows a hidden divergence – this is a golden signal to enter.

- The second factor is the coincidence of the
0.618level with a previously identified support or resistance zone where price has reversed in the past. - The third filter level is the coincidence of the
0.618mark with the previous day's high or low, which act as liquidity magnets for large players.
The combination of all 3 factors in one point creates a high-probability zone.
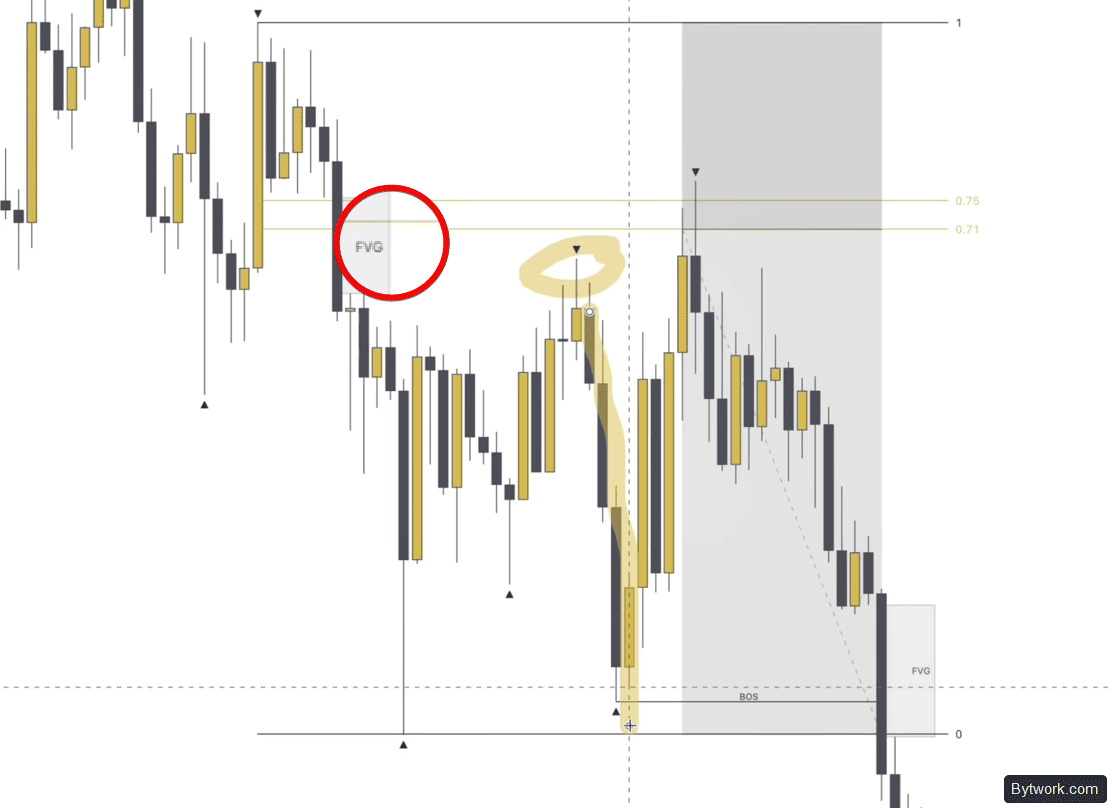
Strategy 4 – Imbalance (Fair Value Gap (FVG))
Imbalance or Fair Value Gap (FVG) is a market inefficiency that occurs during a sharp impulse move.
It is a 3-candle pattern where there is an empty gap between the low of the first candle and the high of the third candle.
The market dislikes inefficiency and tends to return to fill this gap.
The strongest signal occurs when a Fibonacci level (e.g., 71% or 61.8%) coincides with the imbalance zone. Entering at such a point often gives minimal drawdown, as price quickly reacts to filling the FVG and reverses in the trend direction.
The risk here is subjectivity in determining the range boundaries for the Fibonacci grid and the risk of no pullback to the target level in a strong trend.
When price reaches Fibonacci, fills the imbalance (FVG), shows a hidden divergence on RSI, and all this happens at the intersection of a Fibonacci time line – you get a window of maximum probability. But these are not the only strategies.
Strategy 5 – Confluence with Anchored VWAP
Anchored VWAP is a high-precision tool for identifying strong support and resistance areas. It displays VWAP from a selected starting point and, like a moving average, can act as dynamic support or resistance.

- In an uptrend, when price falls below AVWAP, buyers often come in, pushing price up.
- In a downtrend, when price rises above AVWAP, sellers usually push price down.

By drawing an anchored VWAP from the start of the impulse move and combining it with Fibonacci retracement, you can identify strong trading setups. If the golden zone coincides with AVWAP, this area becomes a strong support or resistance level. When price pulls back to this area, look for entry opportunities.

However, entering a trade simply based on touching the line is risky. A confirming signal is needed, for example:
- Engulfing Pattern – the trend candle engulfs the pullback candle
- Long wicks – the market rejects the price, ready for a reversal
So let's discuss our entry technique to help realize these opportunities.
What Are the Entry Techniques?
We use engulfing candles as an entry trigger.
Entry Trigger: Engulfing Candles
An engulfing candle is a 2-candle pattern where the second candle completely engulfs the first. This means its high is higher than the previous candle's high, and its low is lower than the previous candle's low.
There are 2 types:
- bullish engulfing candle (green), signaling a bullish reversal,
- and bearish engulfing candle (red), signaling a bearish reversal.

For example, in an uptrend using anchored VWAP, if price pulls back to the golden zone and forms a bullish engulfing candle, this indicates a potential upward reversal, and we would initiate a buy trade.

In a downtrend using the mirror zone, if price reaches the golden zone and forms a bearish engulfing candle, this signals a downward reversal, and we would enter a sell trade.

Bearish engulfing in the Golden zone is an important entry trigger. This pattern signals that buyers have lost strength and sellers have aggressively taken over.
Risks and How to Reduce Them?
Risk management is a critical aspect of Fibonacci trading. These levels do not guarantee a price reversal in 100% of cases.
1. Which Market Environment to Choose?
Fibonacci tools are best used only in a trending market. In a sideways move, the levels measure noise, not price structure, so the grid should not be drawn!

Avoid trading during major news events – strong economic events often cause sharp spikes that ignore any mathematical levels.
Volume is also important. Trade mainly during periods of high volume. At other times, low liquidity increases the risk of false breakouts.
2. Where to Place Stop-Loss?
Every trade should have a Plan B – a clear stop-loss that limits losses and protects against sudden moves.
Classically, a stop-loss is placed just above or below the 1 (100%) level – the point where the impulse began. If price breaks this level, the correction is considered complete and your idea is invalid.

To reduce risk, you can place a stop-loss outside the Golden zone (38.2–61.8%) or beyond the confirming candle, giving the trade more room to move.
3. Leverage and Position Size
When trading cryptocurrencies and futures, attention should be paid to margin and position size. Pros recommend risking only a small portion of capital per trade – for example, from 0.1% to 1%. This reduces the impact on the deposit during a series of losses.
The liquidation price should always be further away than your stop-loss. For example, if your stop-loss is 10%, 10x leverage would be too aggressive – even a small move against the position could wipe out the entire account.
4. Profit Taking and R:R
Aim to find trades with a profit-to-risk ratio of at least 1:1.5–1:2. On higher timeframes, many traders achieve 1:3 and above.

Part of the position can be closed at the previous high/low (level 0), leaving the remainder as a free trade to run to the Fibonacci extension targets.
After reaching the first take-profit, the stop-loss can be moved to the entry level or to the previous Fibonacci level to ensure at least breakeven and preserve some profit.
5. Risk Filtering and Trading Rules
The simplest way to reduce risk is not to enter blindly at the first touch of the line. Wait for the market's reaction at the Fibonacci level.
Then look for confirming candlestick patterns in the Golden zone – for example, engulfing or long wicks, which show that price is being rejected and a reversal is possible.
Always check signals on higher timeframes:
- If you are looking for an entry on the 1-minute (1M) chart, confirm the trend direction on the 15-minute (15M) chart.
- For 5-minute trading, use the 30-minute chart to determine the overall context.
- For 15-minute trades, look at the 1-hour or 4-hour trend.
- When trading on the 1-hour chart, confirmation should come from the daily chart, etc.

If the trend on the higher timeframe is against your trade on the lower timeframe, the probability of failure increases significantly.
It's important to understand that after 2 consecutive losses with a strategy, it's better to stop trading and check if the market has entered a consolidation phase, where Fibonacci levels work less effectively.
Conclusions?
No matter the asset, BTC or ETH or even the stock market – Fibonacci levels always work if the trend is correctly identified and there is confirmation of signals. But unlike stocks, in crypto the 38.2% and 50% retracement levels are often broken, so deeper zones like 61.8% and 78.6% serve as more reliable entry points.

Whales and manipulators in cryptocurrencies deliberately manipulate price, piercing popular levels to gather liquidity and stop-losses of small traders. Therefore, we draw the grid from wick tips, not candle bodies, to account for real liquidity zones.
It's important to understand that Fibonacci is not a holy grail or magic. You can earn for a year, and then lose it all in one moment. Therefore, it's important to use stop-losses.
Fibonacci does not work if not confirmed by higher timeframes or if the trend is weak. The ability to see the market structurally is the real grail.
We have been trading cryptocurrencies since 2018 and have tested hundreds of indicators and strategies. Whether to use Fibonacci or choose another trading system – as always, it's up to you. Happy trading! Your editor – Maxim Anisimov for bytwork.com.
This material is for informational purposes only and is not financial advice.

Now reading


In DePin, people create networks themselves, share traffic or capacity, and receive rewards in tokens from these projects.


The Ellipal firmware update enhances security (fixes vulnerabilities), adds support for new cryptocurrencies and tokens, and optimizes the interface and operational stability.


