Spot market tops in crypto using the Pi Cycle Top indicator - and explore alternative indicators
Pi Cycle Top is one of the notable indicators used to identify the Bitcoin price peak, and its historical accuracy has been striking.
The indicator correctly predicted 4 BTC peaks: twice in 2013, then in 2017 and 2021. And in the last 4 times it signaled a top, BTC fell 52%–86% after reaching the peak.
It's crucial to understand this indicator, its historical precedents, and why it matters so much.
Additionally, you'll learn how it directly relates to your altcoin investments and whether Pi Cycle can be used to forecast prices.
Alright - we know the Pi Cycle indicator did quite well historically, but how exactly does it work?
What it is and how it works
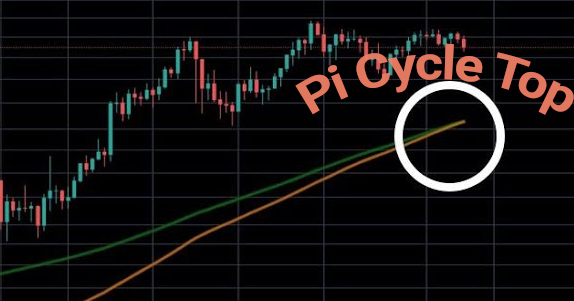
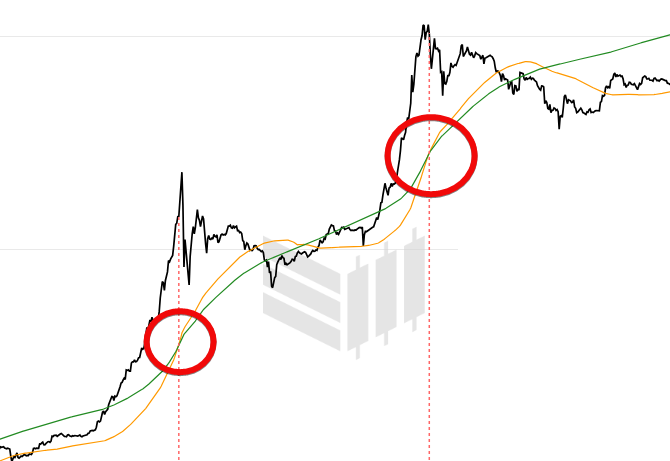
The Pi Cycle Top Indicator consists of two lines derived from past Bitcoin prices. When the faster line crosses the slower line, it signals that BTC price may be nearing a local maximum and could start to decline.
- The fast line (orange) is the average Bitcoin price over the last 111 days.
- The slow line (green) is the average Bitcoin price over the last 350 days, multiplied by 2.
These lines on the chart are moving averages - simply the average Bitcoin price over the last X days, updated daily. Historically, when these lines crossed, a price peak tended to follow - and then a crash.
Below are charts of this indicator on various websites. Pick the one you find most convenient:
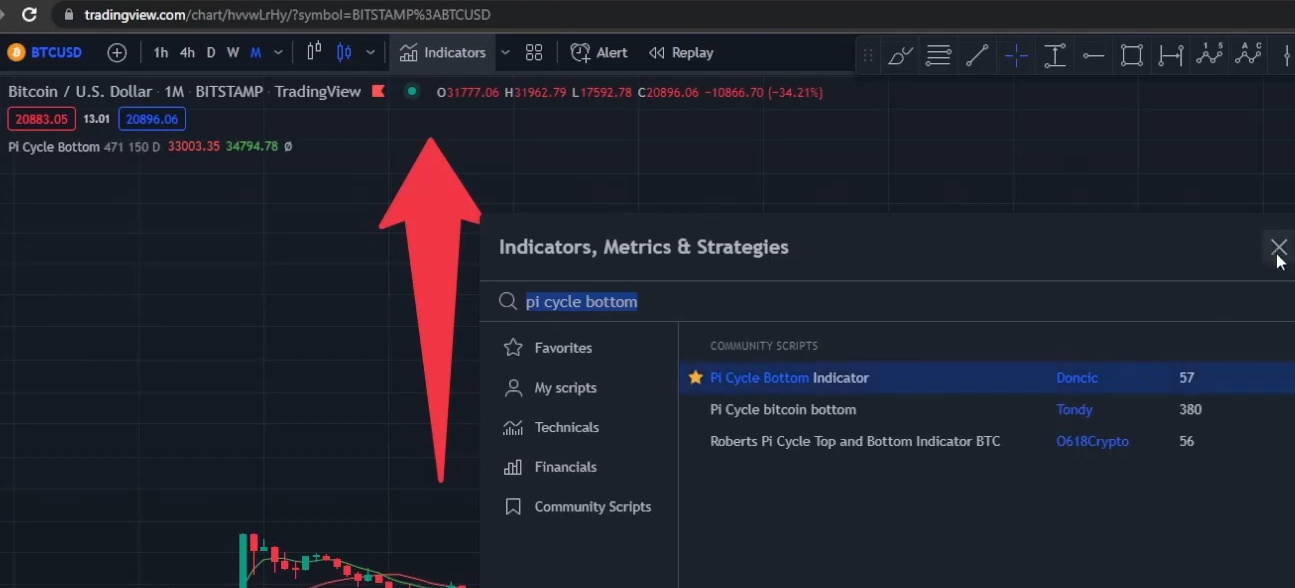
If you want to use the Pi Cycle indicator, it’s available in TradingView’s indicator list. To add it, click “Indicators” in the top-left corner, type “Pi Cycle”, select it from the results and click on it. The indicator will be added to the chart.
It's important to remember that no indicator is perfect, and there may come a time when it stops working. Although it performed exceptionally well in the past, that doesn't guarantee future results.
Still, historically this indicator has validated its usefulness.
Why Pi Cycle Top works
There are three theories explaining why the indicator works. The truth may be a mix of all three.
- Behavioral theory. The crossing of moving averages signals an overly extended rally. When the short-term average crosses above the doubled long-term average, it suggests the rally is overstretched and a pullback is likely.
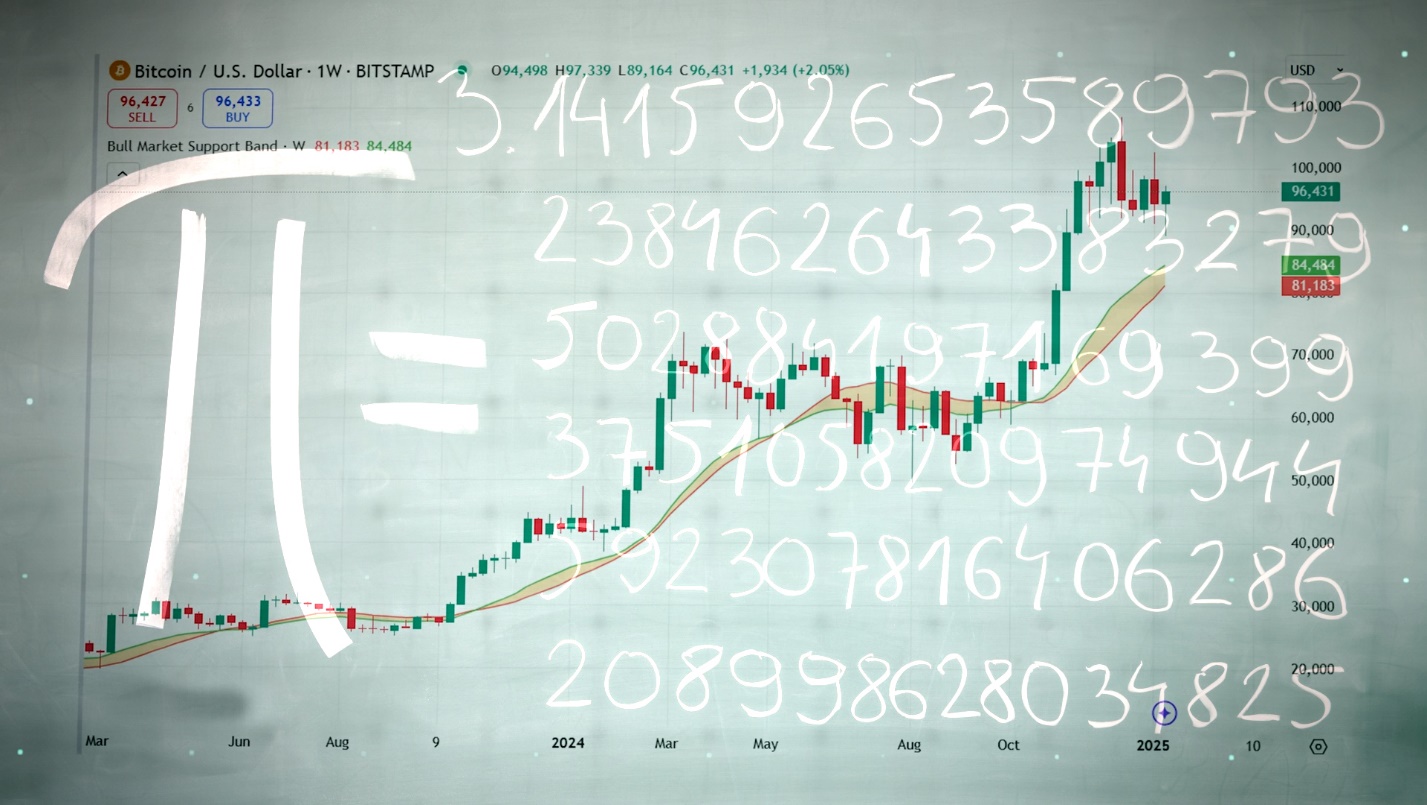
- Mathematical theory. This relates to the number π. Dividing 350 by 111 gives about 3.153, while π ~ 3.142 to three decimal places. π appears in many natural patterns - in circle geometry, wave calculations, river shapes and planetary orbits - so some propose that similar numeric relationships might appear in Bitcoin cycles as well.
- Structural theory. The indicator is well-known among crypto traders and investors, so when it signals, many market participants may preemptively start selling. That selling pressure can itself push the price down.
Take a look at the history of Pi Cycle Top’s past predictions.
Historical accuracy
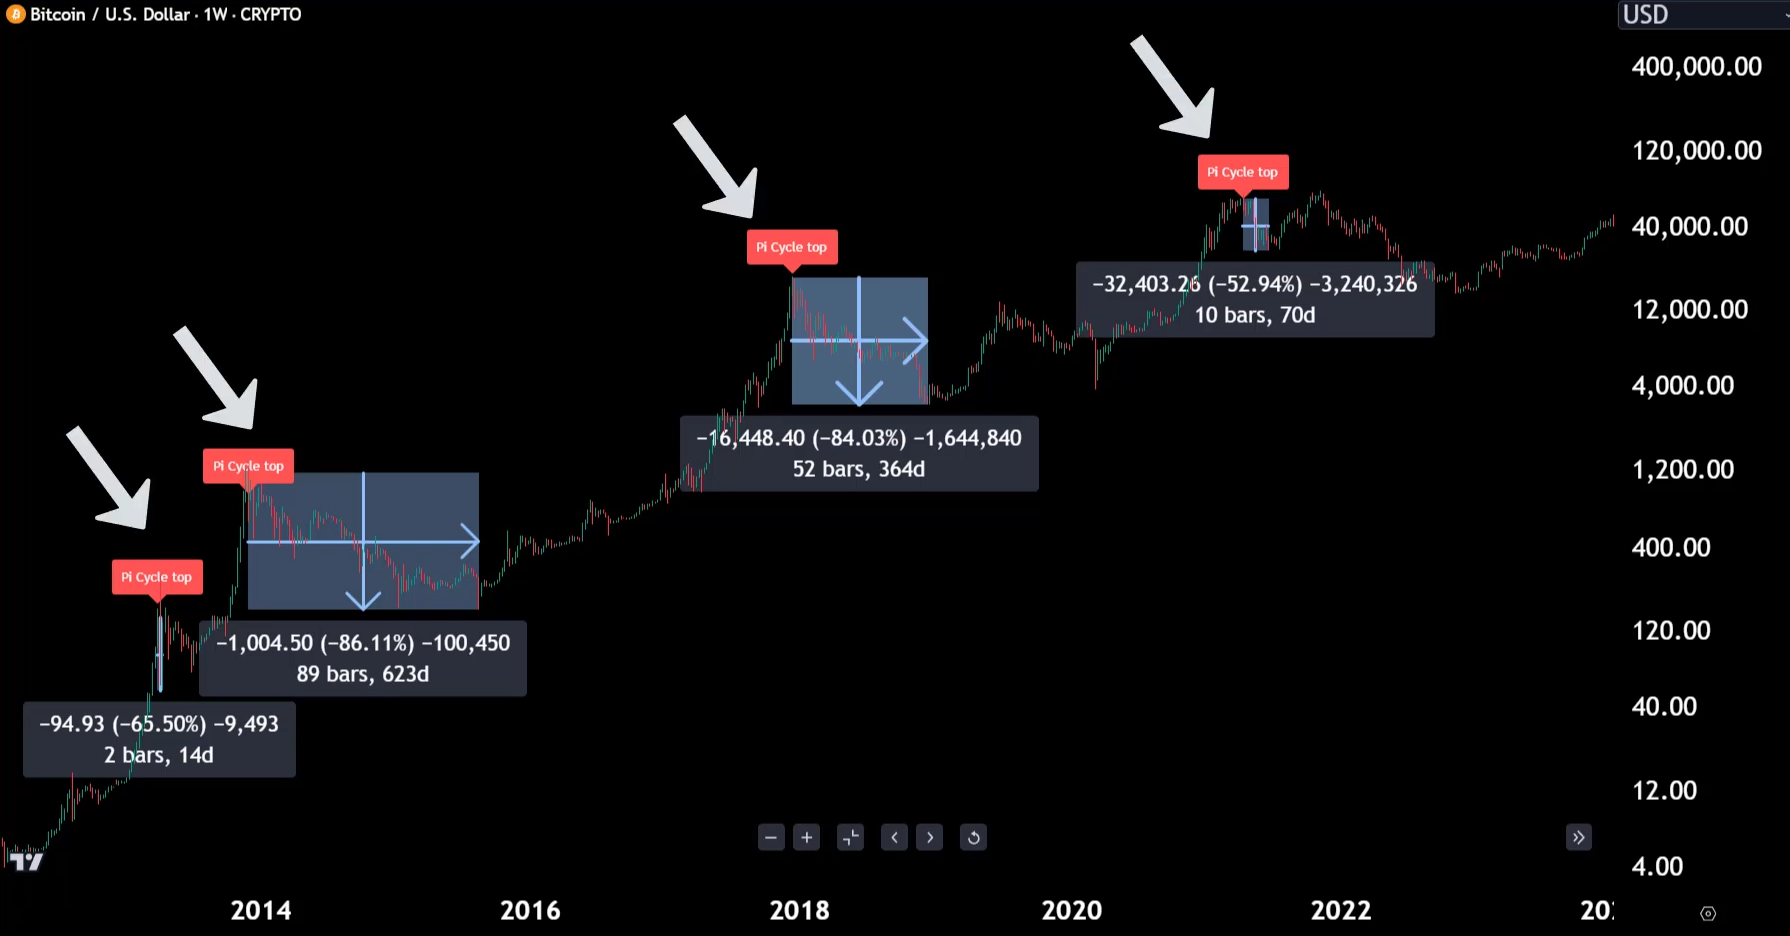
Since 2013 the indicator has issued 4 Bitcoin top signals, each occurring within a few days of a major price maximum.
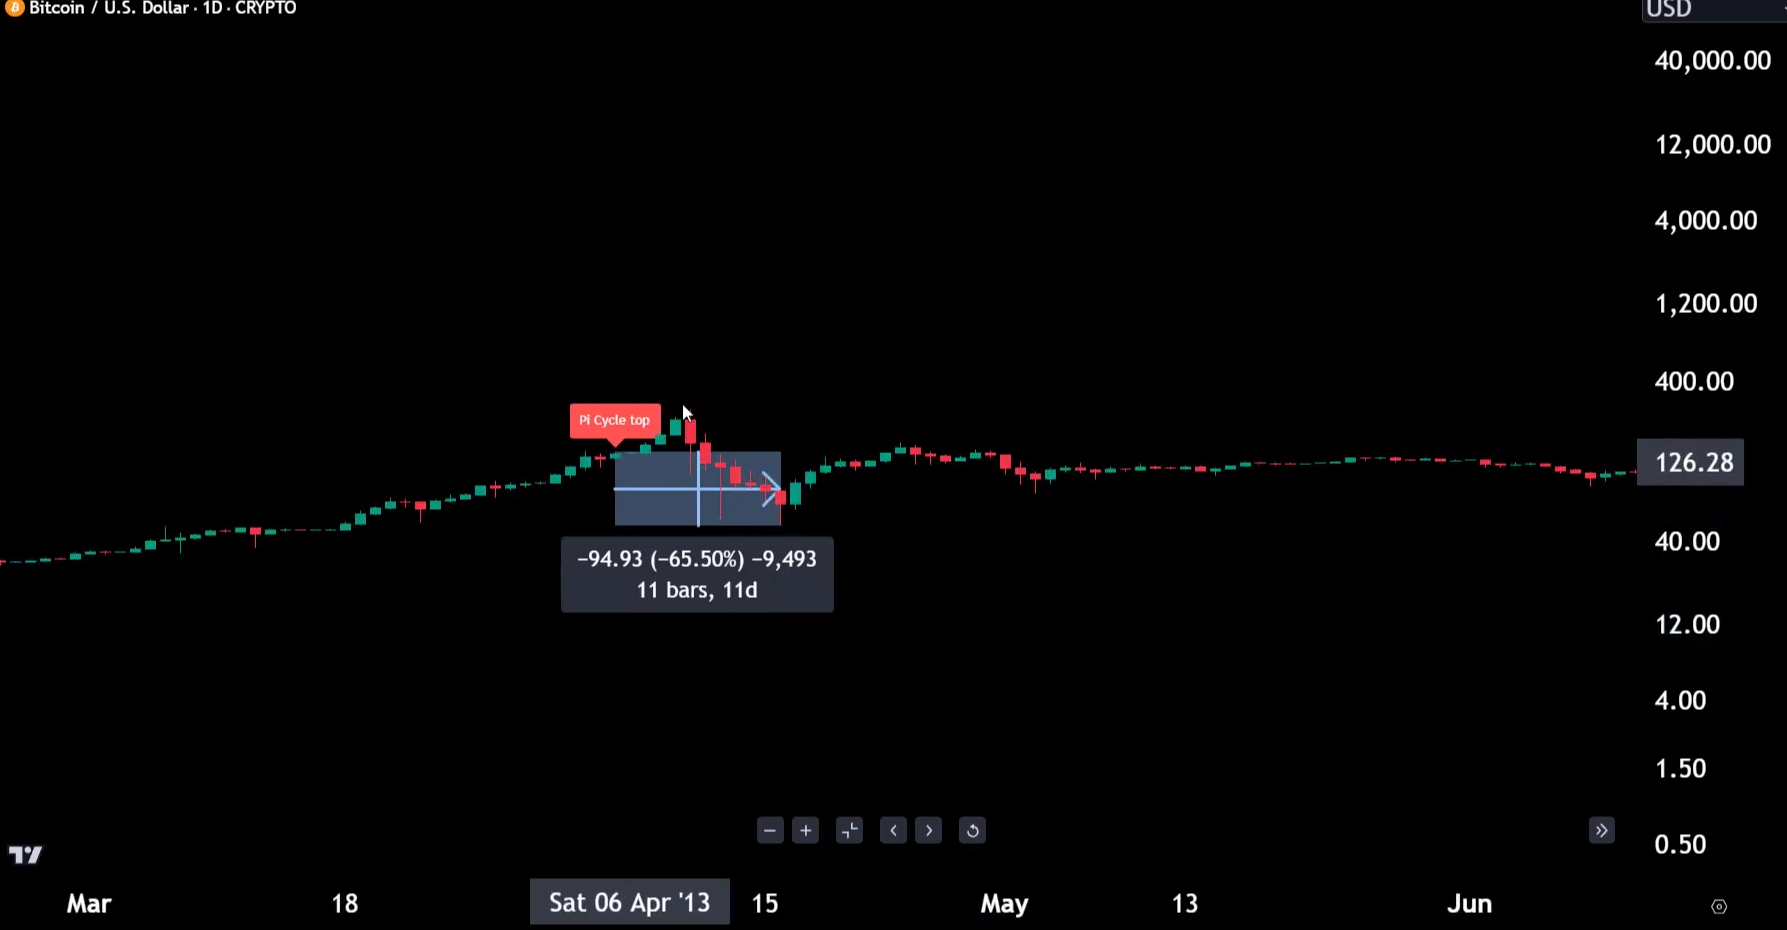
1st peak signal came on April 6, 2013 - after it, Bitcoin's price dropped 65.5% over the next 11 days. Although the price nearly doubled in the first 4 days after the signal, that rally proved unsustainable.
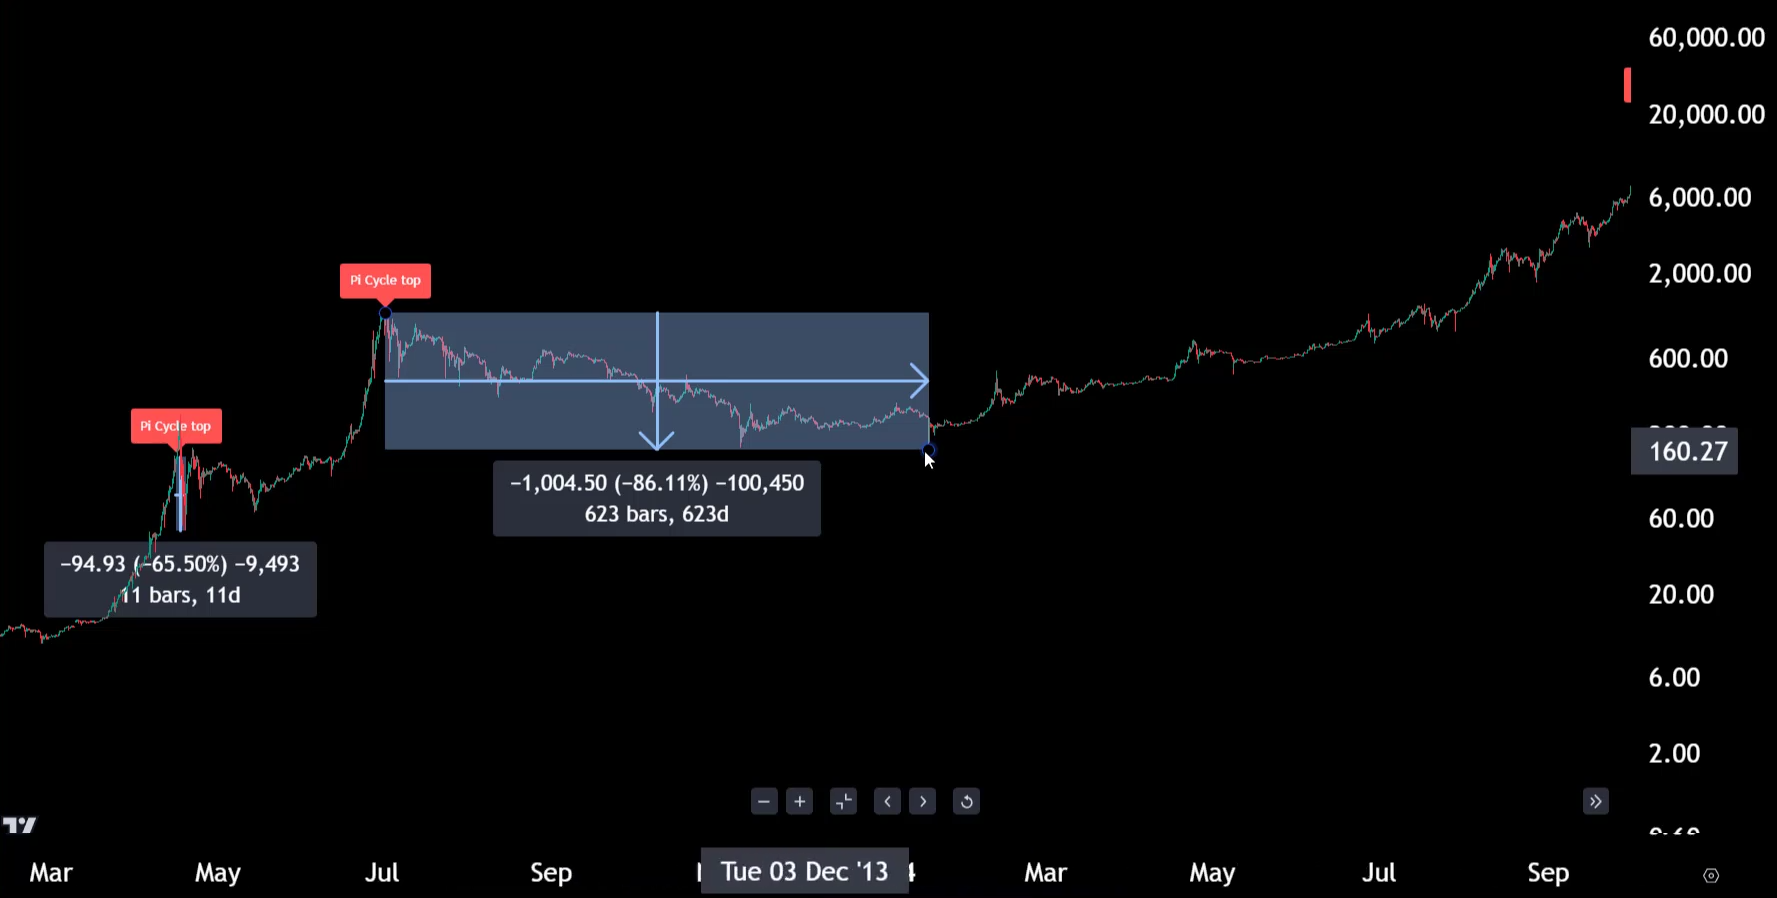
2nd peak signal triggered on December 3, 2013 - just one day before that cycle’s actual peak. Over the next 623 days Bitcoin fell 86.11%.
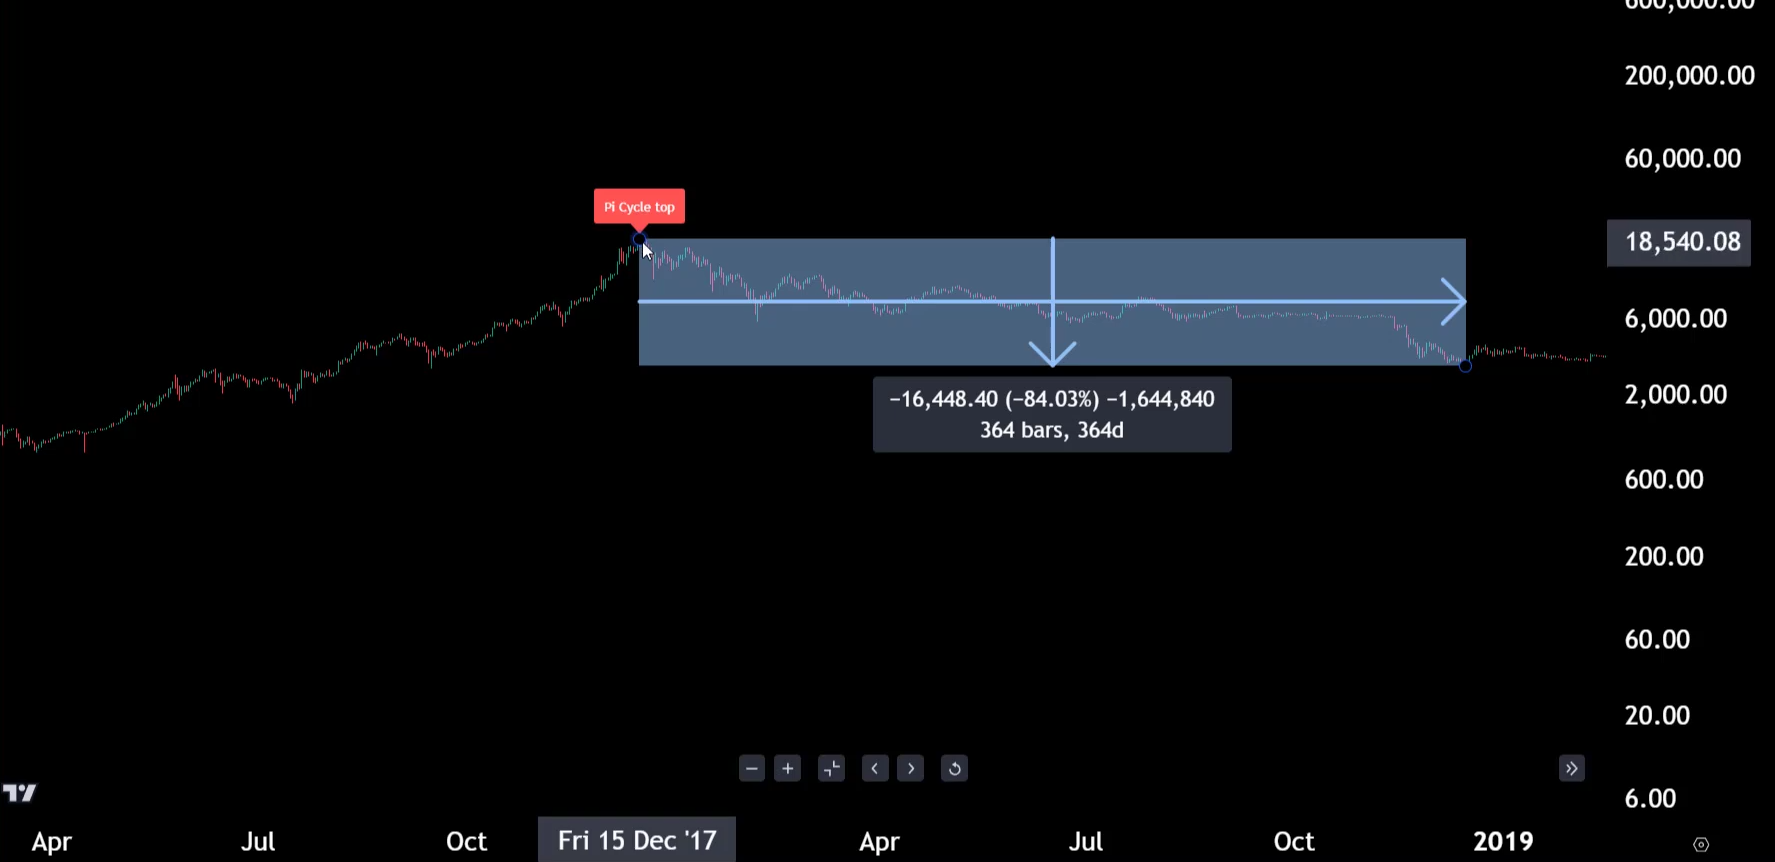
3rd signal occurred on December 17, 2017, again one day before that bullish cycle’s peak. After this signal Bitcoin dropped 84.3% over 364 days.
Finally, the fourth signal came on April 13, 2021. Two days later the price reached a peak just under $65,000 per coin, and from April 12 to June 22 (71 days) Bitcoin fell 52.94%.
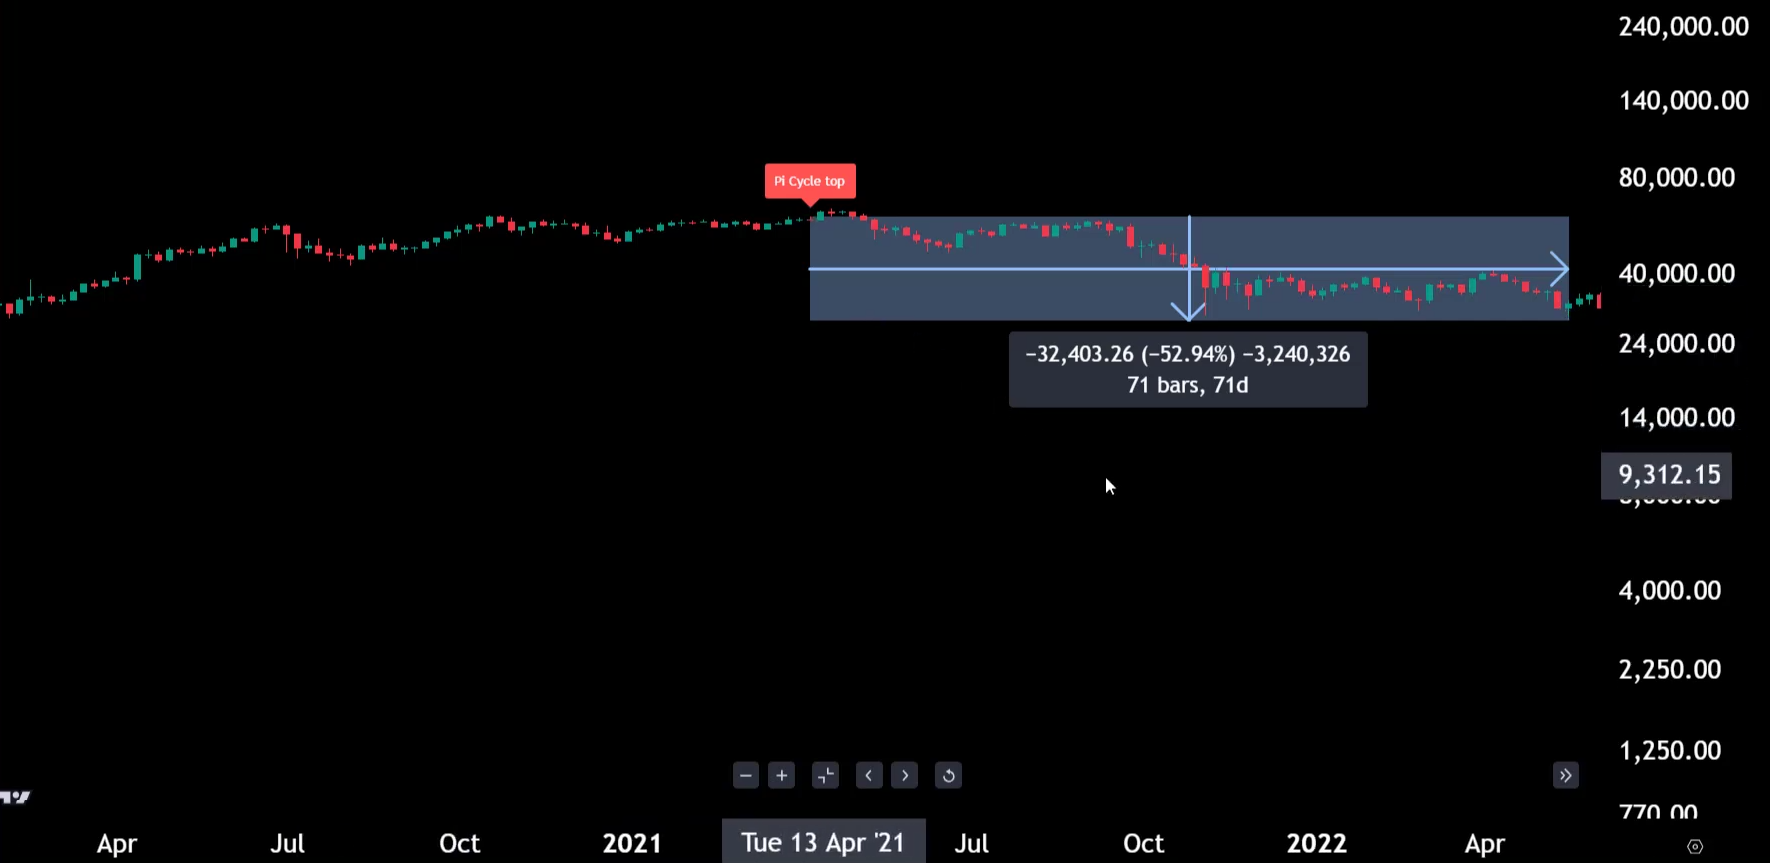
This decline was smaller than previous ones, but by that time Bitcoin’s market cap had exceeded a trillion dollars, which somewhat reduced relative volatility compared with earlier cycles.
The takeaway is that the Pi Cycle demonstrates Bitcoin’s cyclicality. When price surges, the short-term average (111D) shoots up and overtakes the long-term average (350D). Such crossings often serve as correction signals, typically followed by a crash.
Does it always work?
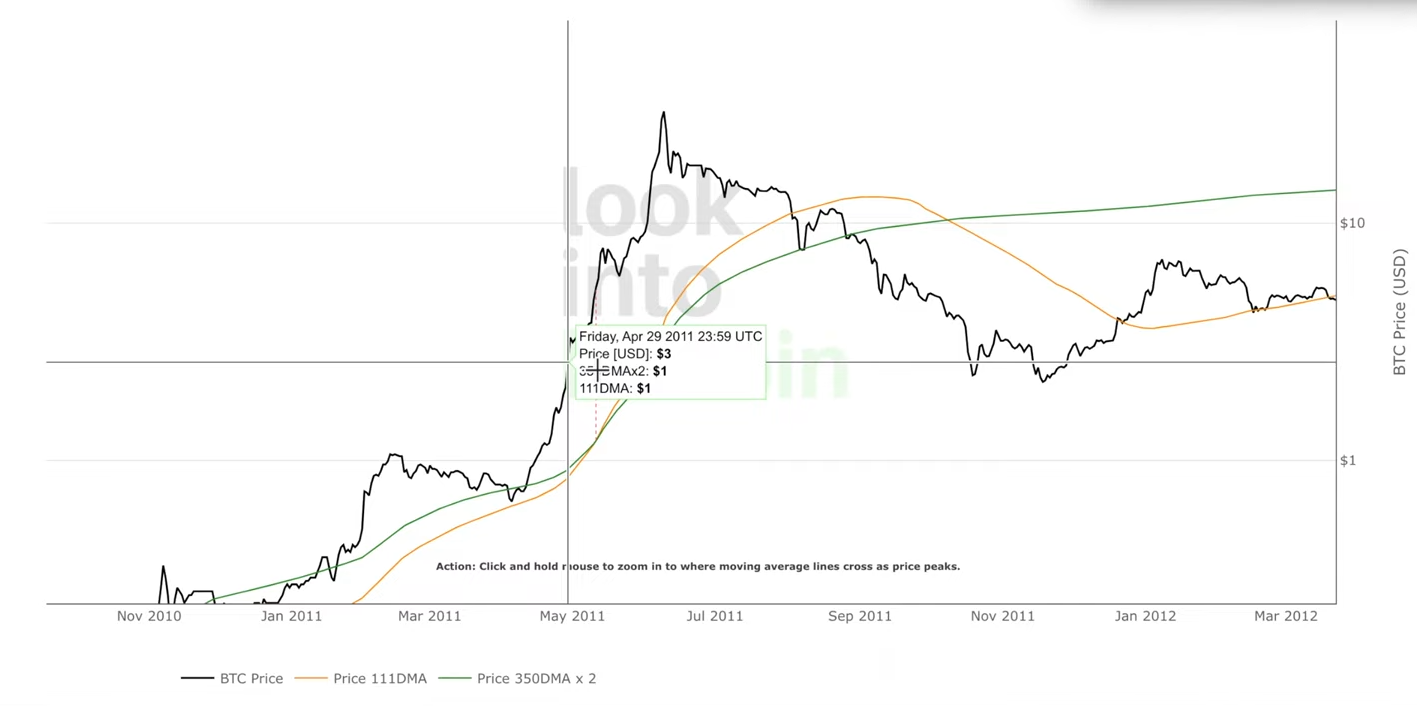
We think timing matters. For example, if you look at the first recorded Bitcoin peak in 2011, you can see that when momentum really picked up, the Pi Cycle top signal did appear, but price still continued upward for some time after that.
Bitcoin has also reached peaks without a Pi Cycle signal. For example, on June 26, 2019 Bitcoin lost 71.9% over 261 days, and on November 10, 2021 it fell 77.57% over 376 days.
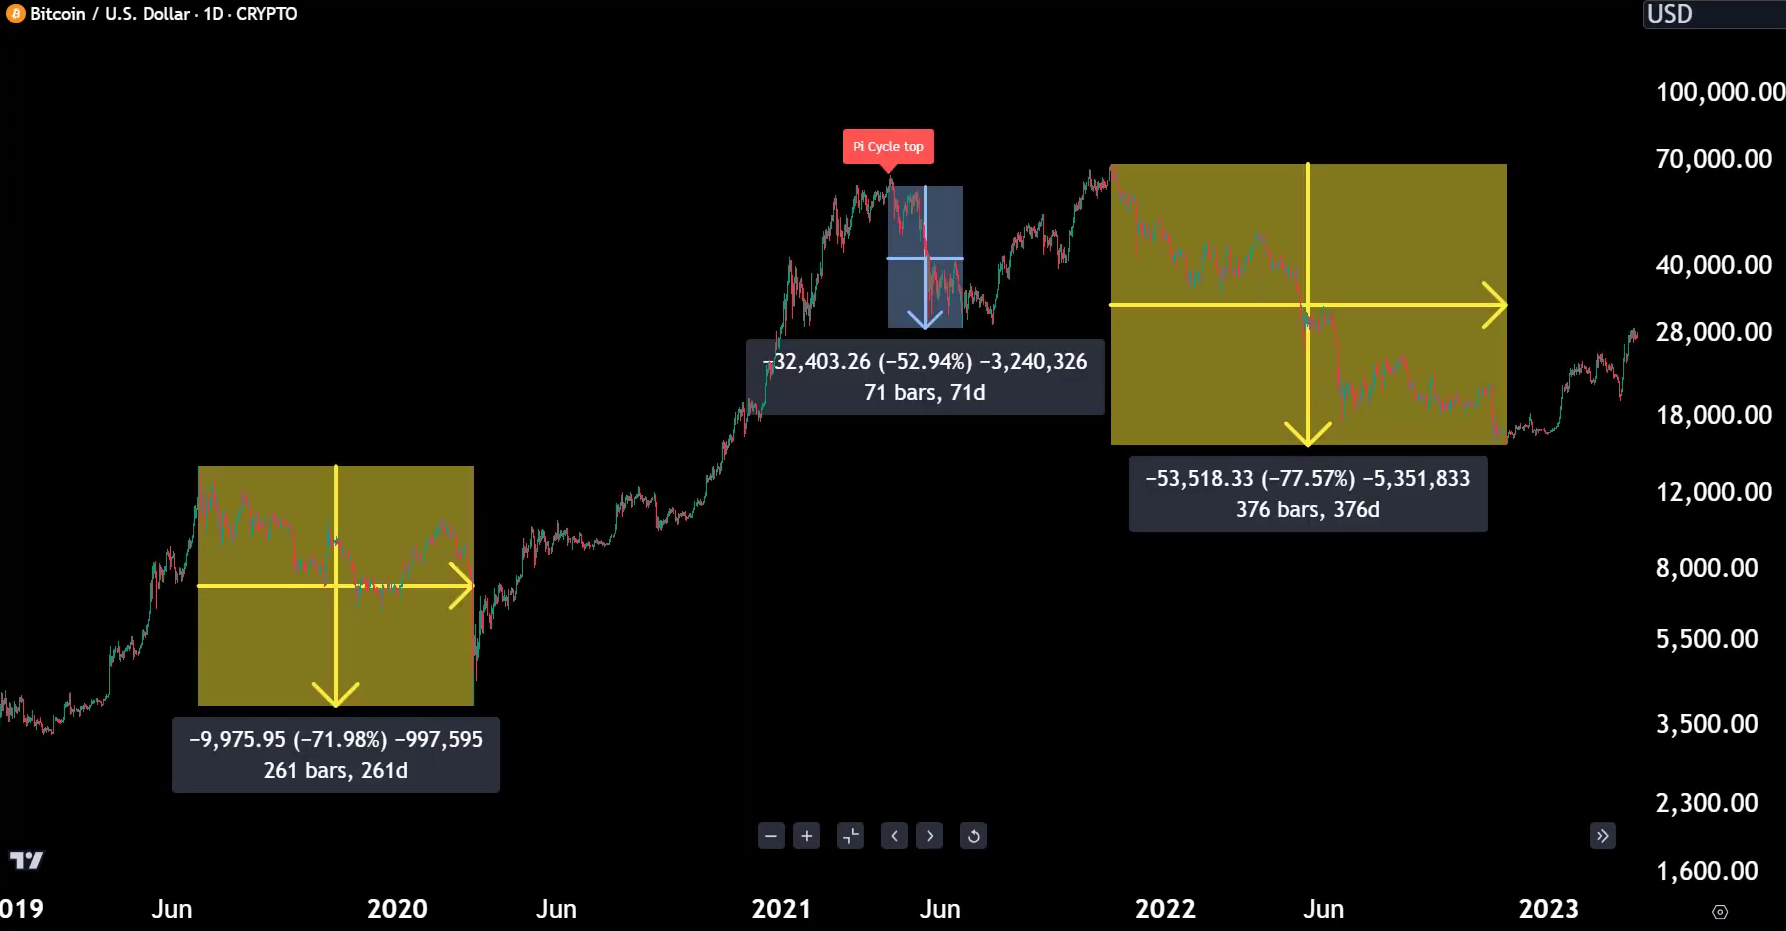
So, although the indicator has a strong history of signals, it hasn't captured every single peak.
Does PI Cycle provide forecasts?
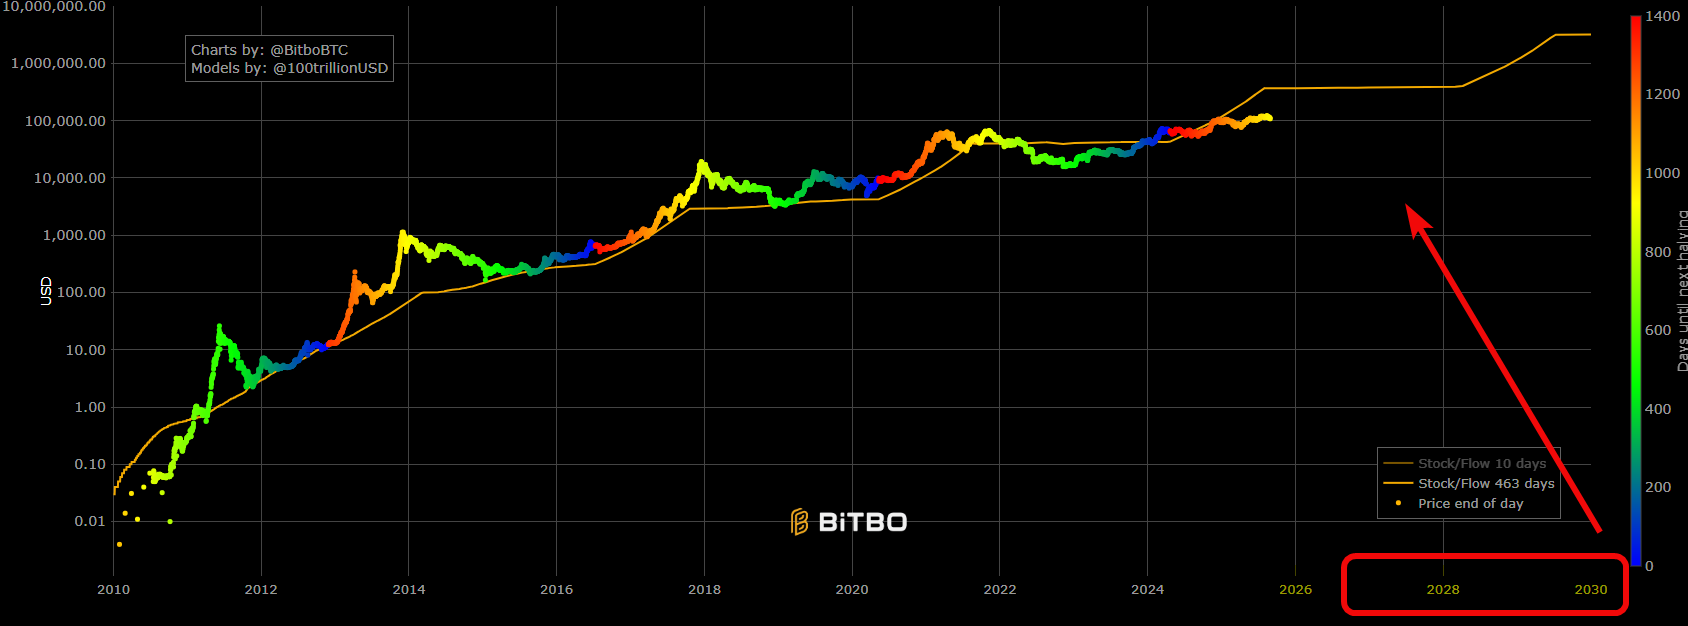
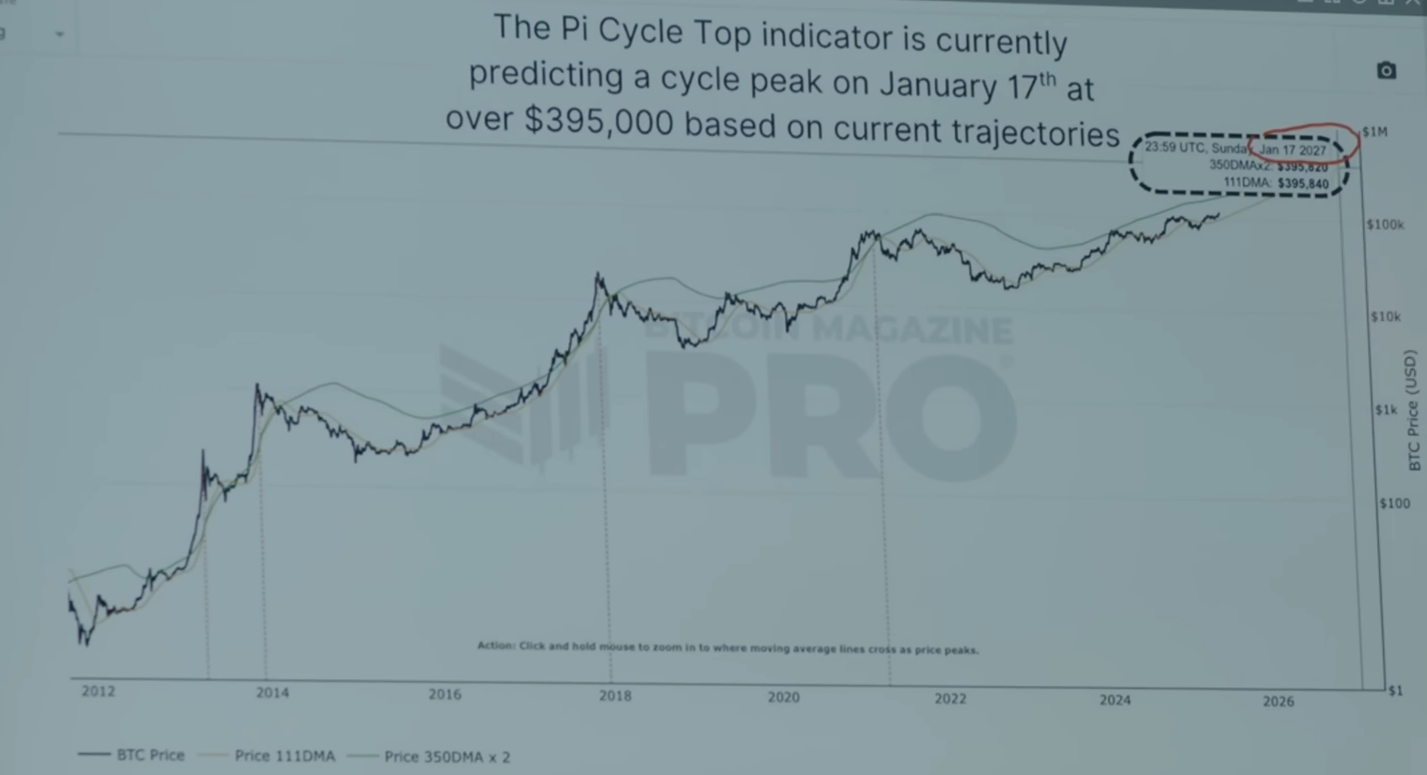
There is another version of this chart that attempts to project the exact peak using extrapolation. Some forecasts point to $256K in 2026. However, these are nothing more than eye-catching headlines without solid foundations.
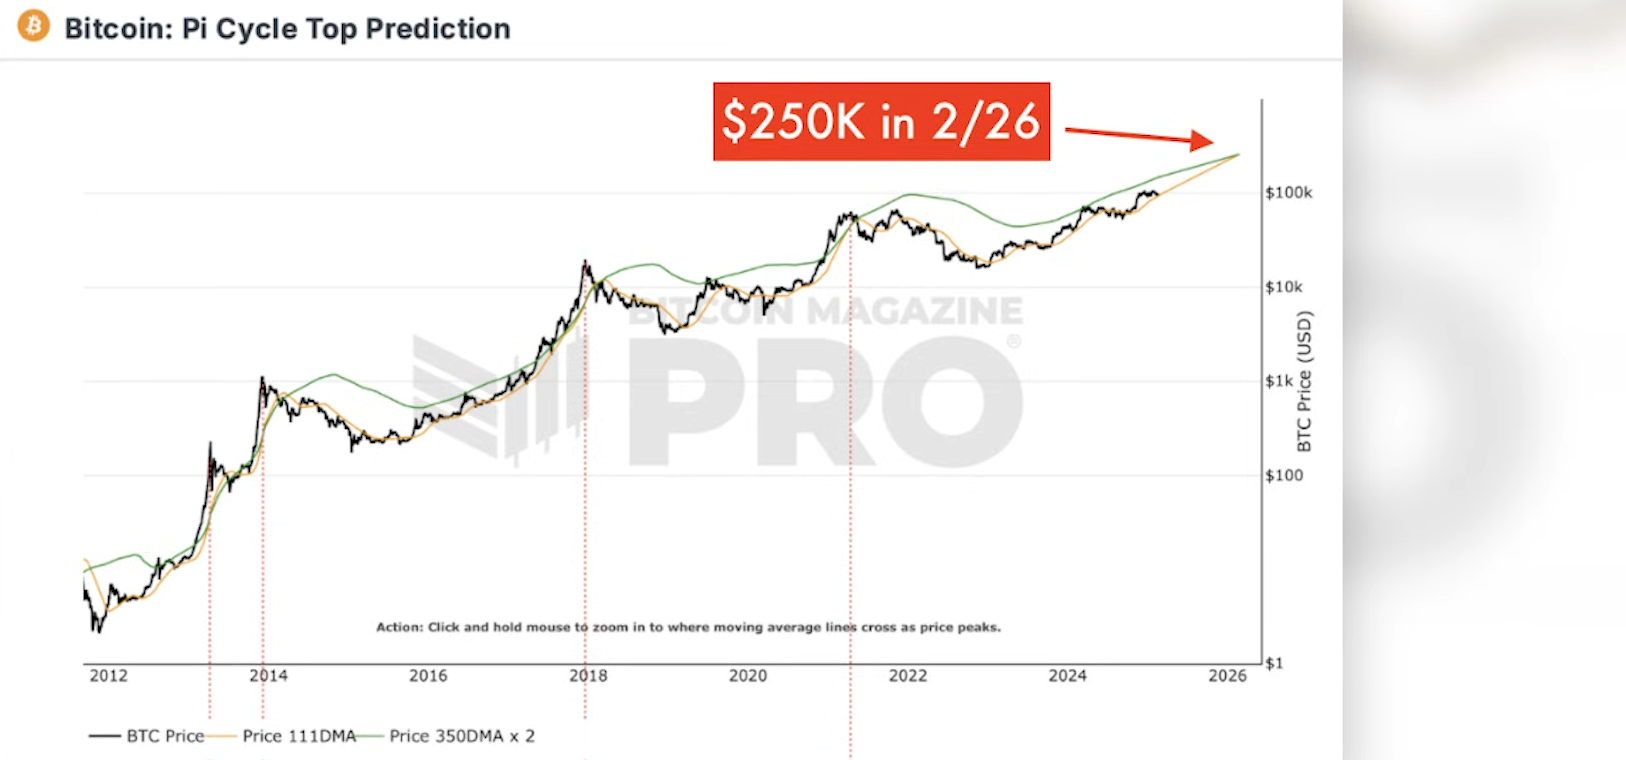
Ultimately, these models are built on moving averages, which by definition cannot predict future price action. They show crossings between fast and slow averages, not price ranges years ahead.
Pi Cycle highlights potential proximity to a peak, but it is absolutely unable to tell you where that peak will be - keep that in mind when you see bold forecasts based on it.
Pi Cycle Bottom
There is also a Pi Cycle Bottom indicator that signals market bottoms. It uses two different moving averages.
You can see that each time the green line crosses the red line from below - i.e., when the short moving average falls below the long one - we actually observe a cycle bottom according to the Pi Cycle methodology.
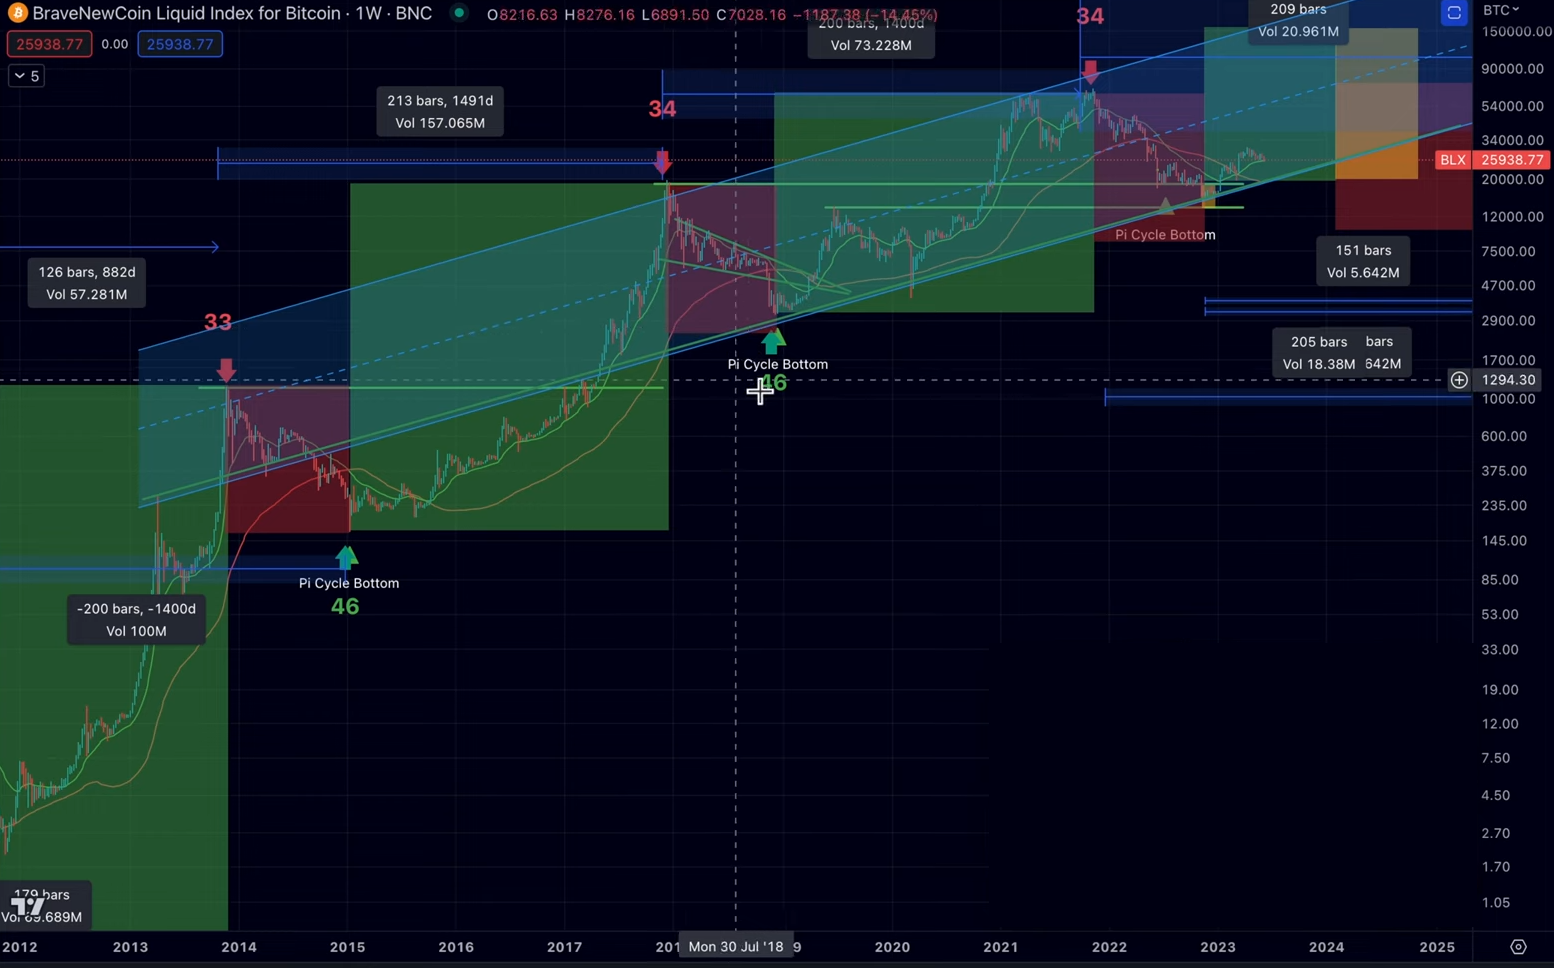
In the past these points coincided with bear market lows, although recently they have occurred earlier, which surprised many traders who weren't watching the timing closely during the subsequent BTC drawdown.
We believe that time-based cyclic behavior of Bitcoin’s price is more important than these momentum-based swing signals.
Alternatives to Pi Cycle
Alternative models, like the Stock-to-Flow, show better validated performance and project continued Bitcoin price appreciation based on fundamental factors.
Other alternative indicators include (briefly):
Puell Multiple - highlights when miners start selling aggressively (entering the red zone > 3.4), which puts pressure on the market and can trigger sharp corrections.
Rainbow Chart - a long-term valuation tool using a logarithmic growth curve and colored bands to indicate market stages (from accumulation to bubble).
Everything Indicator (paid) - an aggregated oscillator that combines key metrics (M2, MVRV Z-Score, etc.) into a single signal. It shows how overheated the market is.
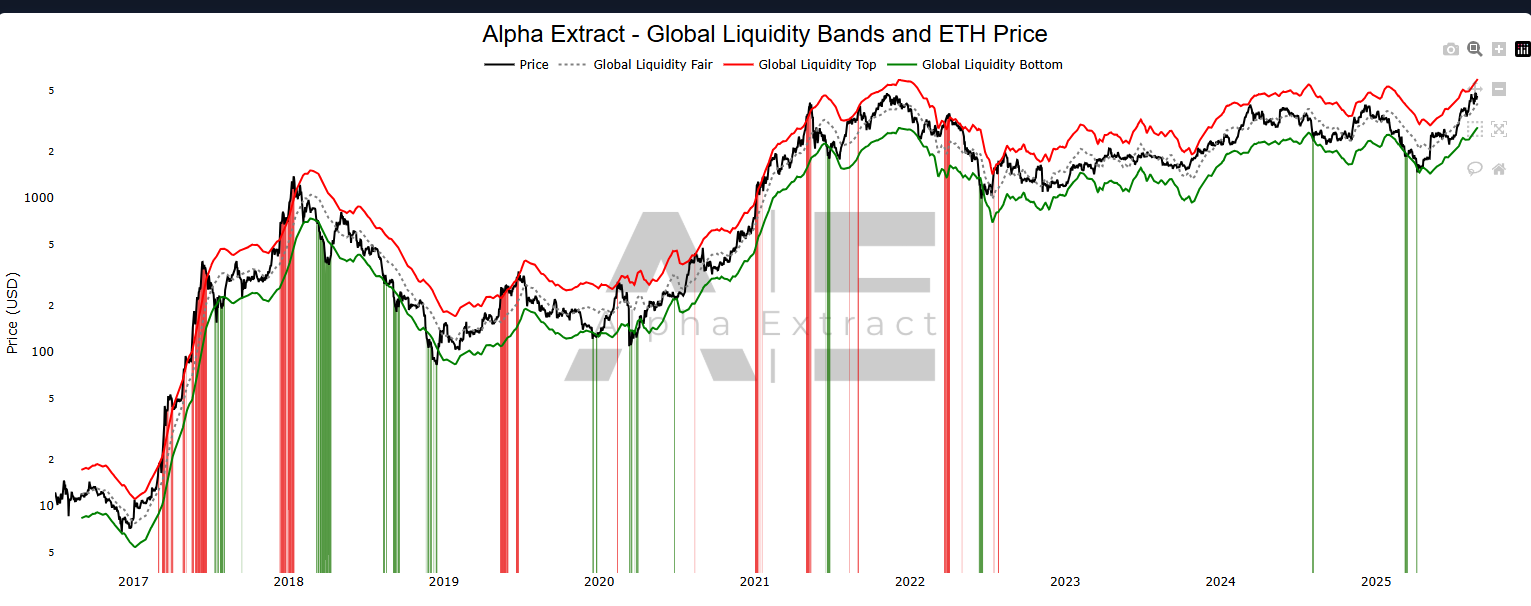
ETH to global liquidity ratio - assesses fair value for Ethereum based on global liquidity. A reliable indicator for identifying local tops and bottoms not only for ETH but for the altcoin market as a whole.
Limitations of Pi Cycle
This is a long-term indicator. It’s designed for moves that unfold over months and years, not for day trading.
It is also not intended for pinpointing entry points.
Below we compare Pi Cycle with Zero Lag and with classic indicators.
| Criterion | Pi Cycle Top | Zero Lag Indicator | Classic indicators |
|---|---|---|---|
| Main purpose | Identify macro market tops (bear-market peaks). | Find short- and medium-term entry and exit points. | Analyze momentum, trend, volatility for trading across horizons. |
| Timeframe | Long-term (week/month) | All timeframes | All timeframes (interpretation varies) |
| Signal frequency | Very low | High | Depends on settings/TF |
| Accuracy | Very high for its purpose | Medium/high | Variable |
| Usage | Strategic | Tactical | Tactical and analytical |
| Key drawback | Doesn't provide entry signals | May lag / produce false signals | Require combination / easily misinterpreted |
| Analogy | Satellite image | Roadmap with traffic | Car dashboard |
Pi Cycle Top’s relation to altcoins (XRP, ETH, etc.)
This signal is also directly related to your altcoin investments. In 2017 the absolute top for altcoins occurred roughly two weeks after Bitcoin’s peak. That was the best time to sell altcoins.
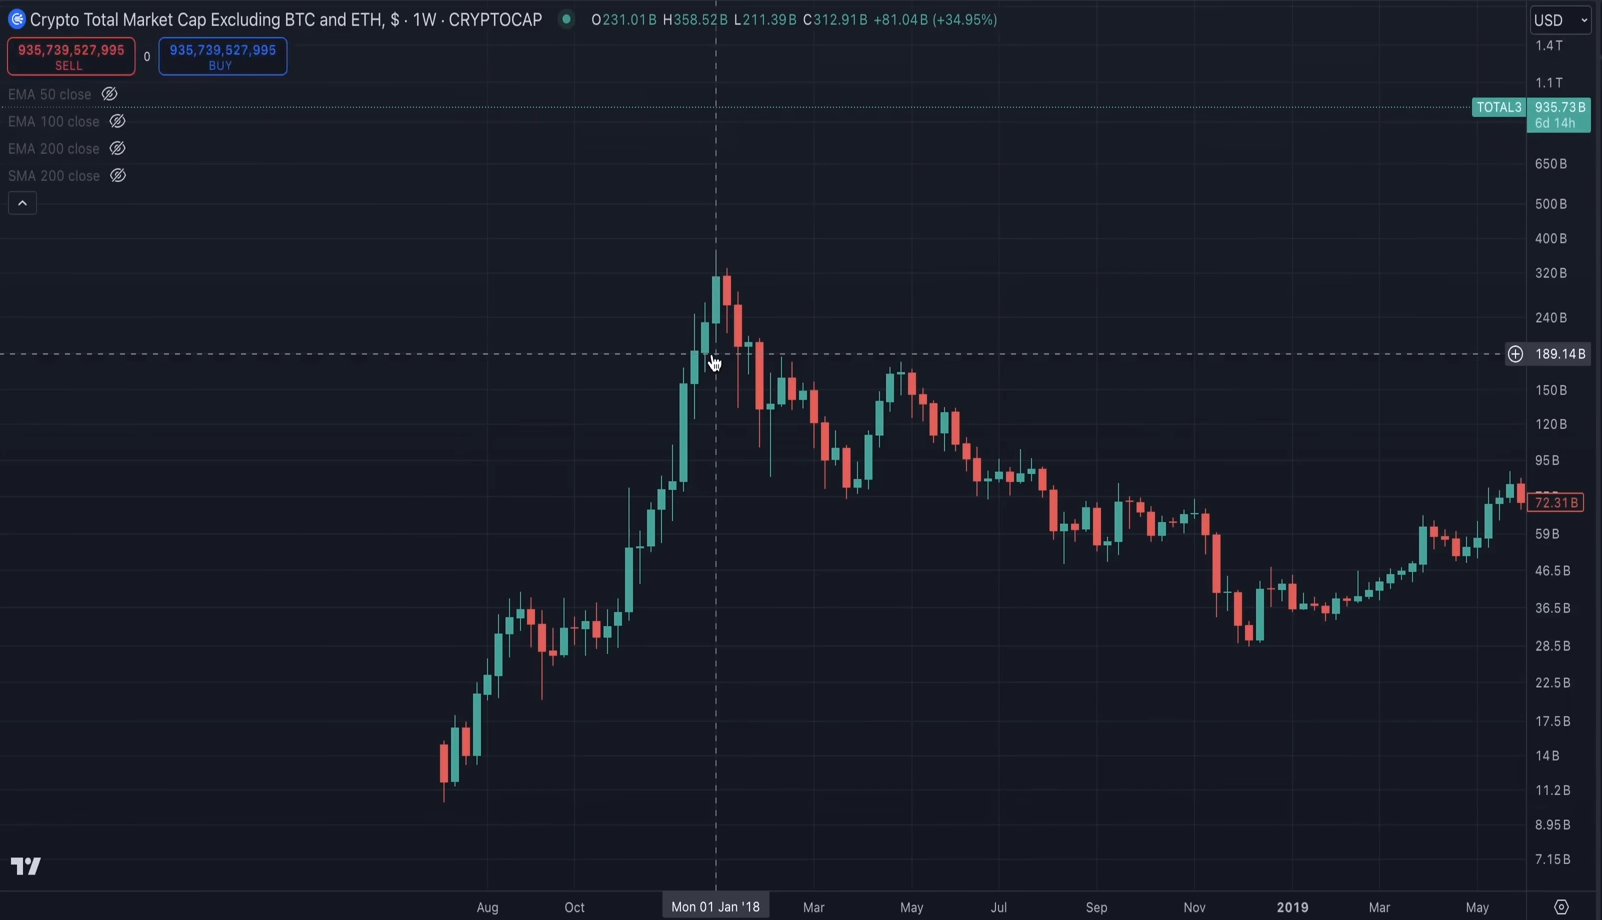
The pattern repeated in 2021.
Should you use Pi Cycle in your strategy?
The indicator has historically signaled Bitcoin tops, so it's worth considering. But while it may attempt to forecast the peak, that can be misleading.
Just don't rely on it blindly! After all, BTC has a habit of doing the unexpected.
The market has matured. Bitcoin ETFs appeared and institutional interest has grown, and large players may try to exploit popular indicators (like Pi Cycle Top).
The conclusion is: of course you should watch this indicator because it's one of the genuinely working tools with a track record. But in trading, it's wise to also monitor other indicators.
Disclaimer: all information in this article should not be taken as financial advice. The article is for educational purposes only. Never invest more than you can afford to lose and consult your personal financial advisor.

Now reading


In DePin, people create networks themselves, share traffic or capacity, and receive rewards in tokens from these projects.


The Ellipal firmware update enhances security (fixes vulnerabilities), adds support for new cryptocurrencies and tokens, and optimizes the interface and operational stability.


