7 Filters for FVG - how to Elevate Your Strategy’s Win Rate to 81%

Earlier, stop-losses used to get hit on reversals, but after using FVG (price gaps due to supply/demand imbalance), entries have become more precise, and we now catch impulse moves. Below you will find a complete breakdown of FVG and 7 working filters for any assets.
What is a Fair Value Gap?
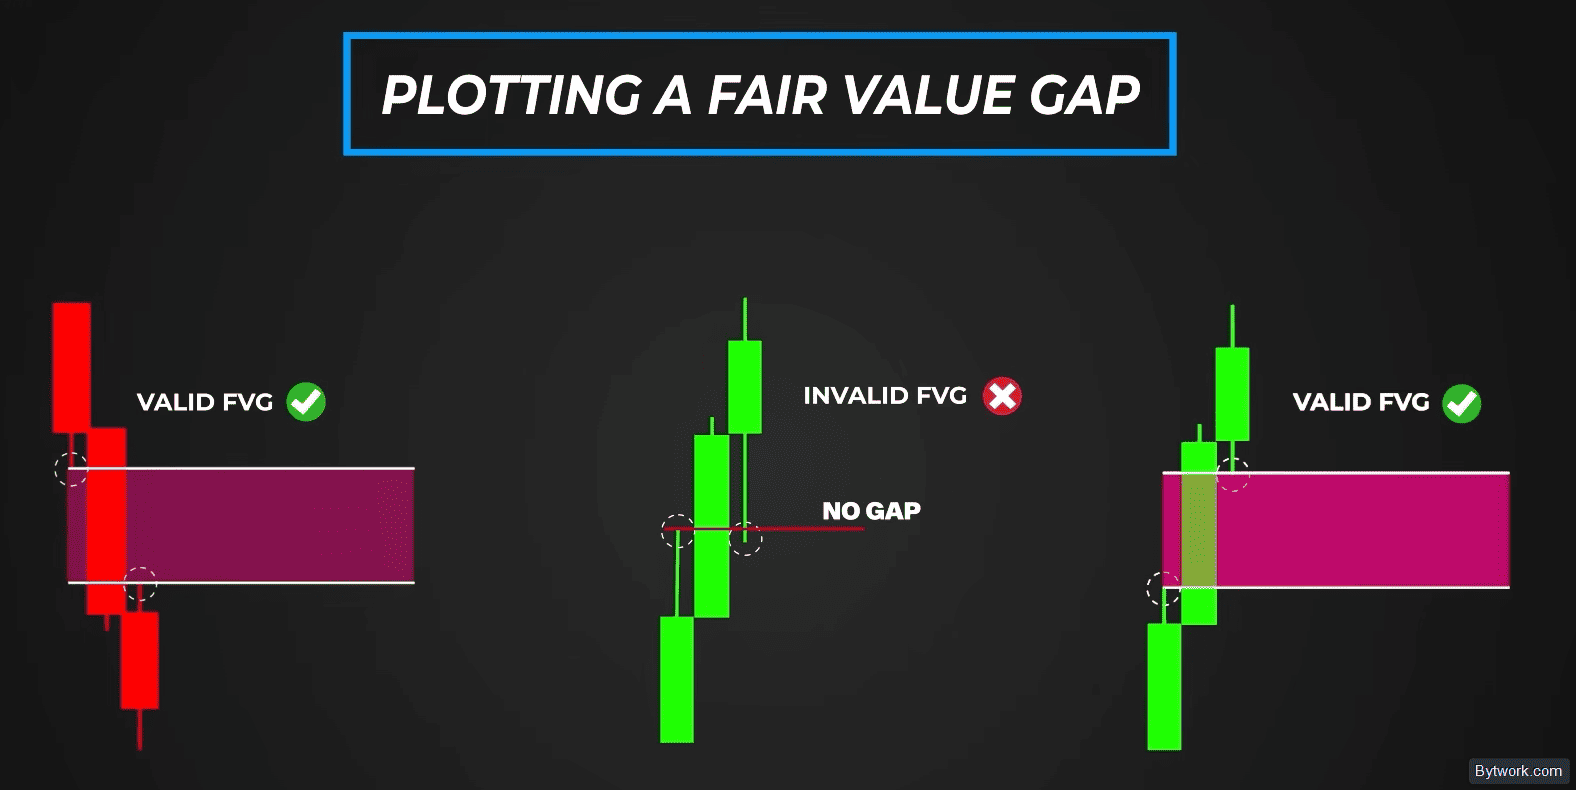
A Fair Value Gap is an imbalance on the chart, confirmed by a 3-candle pattern.
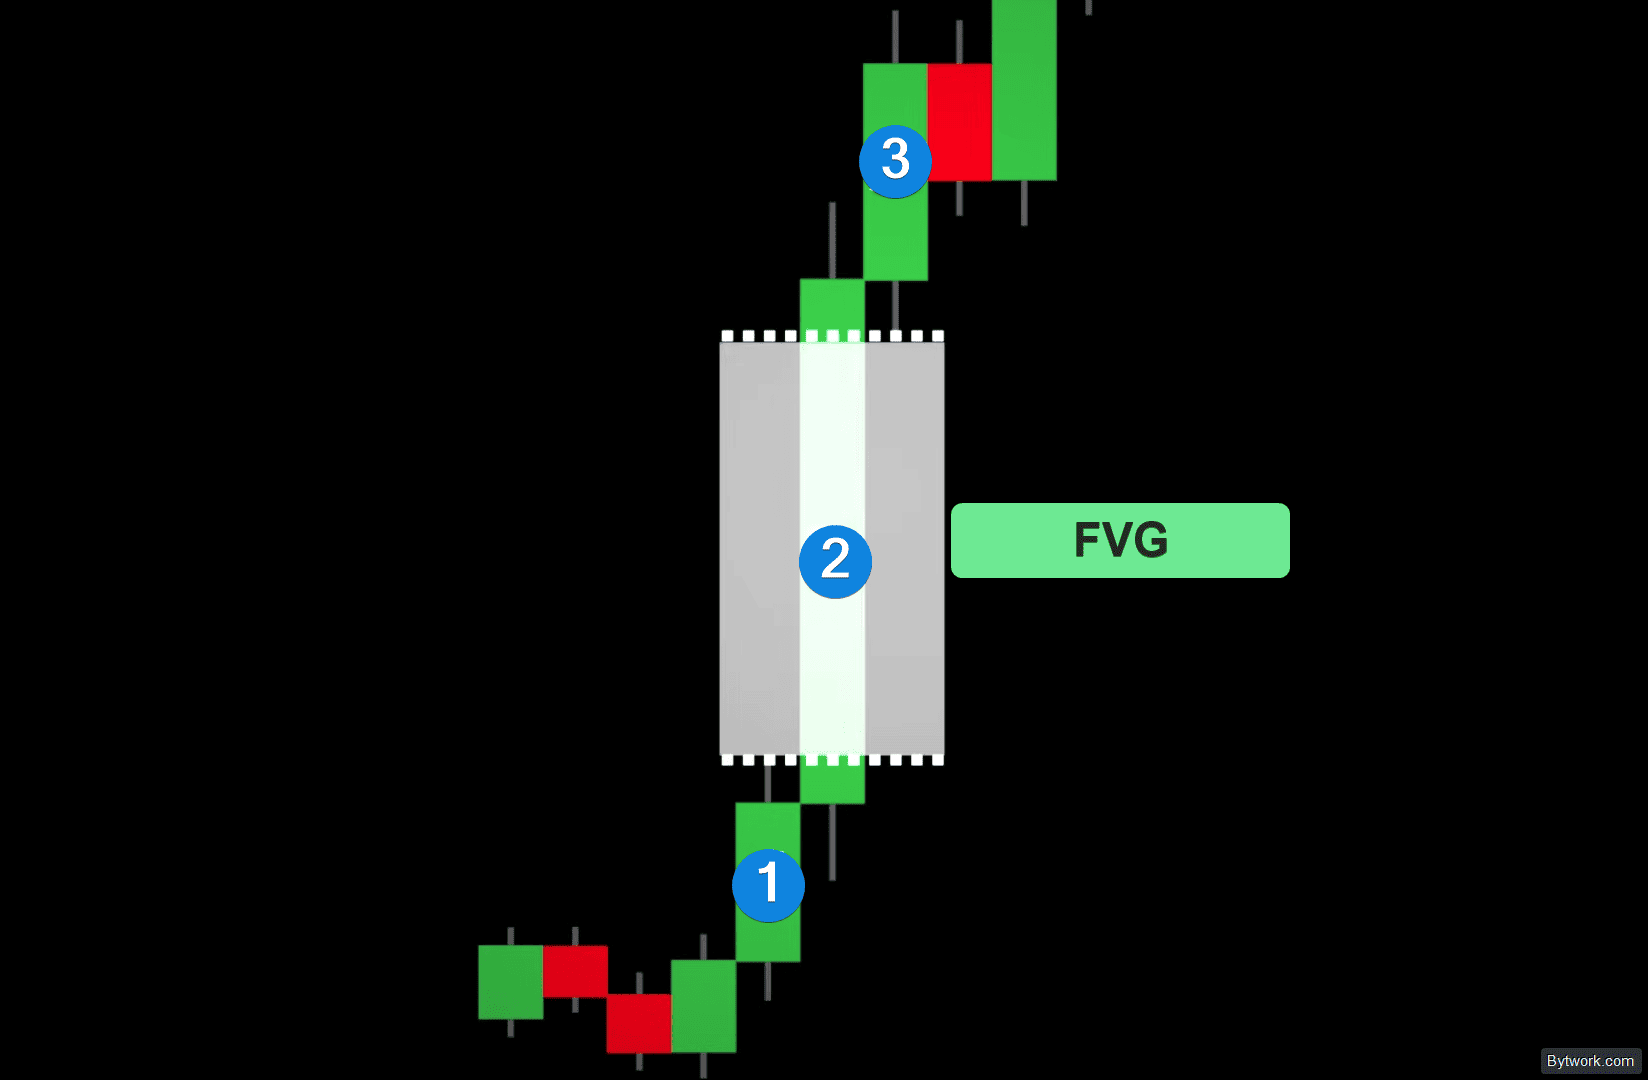
In a bullish gap (BSI), the high of the first candle does not overlap the low of the third, creating a window that price often returns to before continuing the trend.
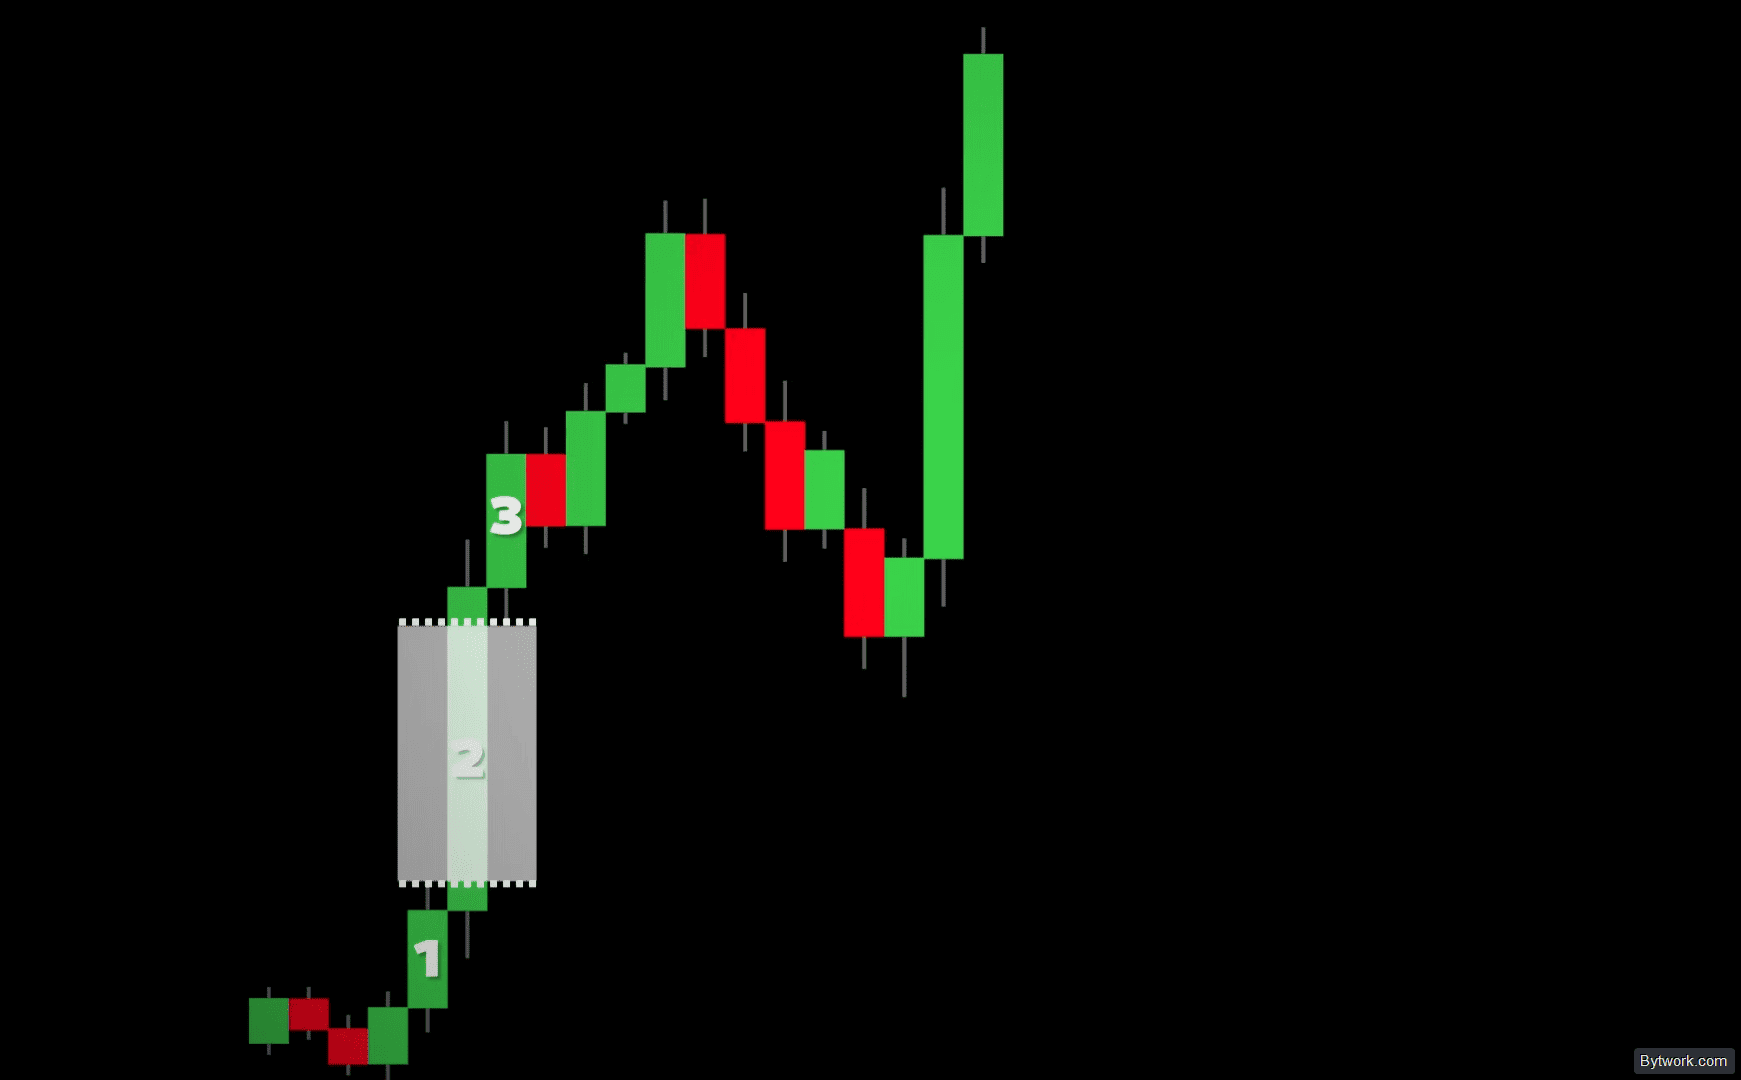
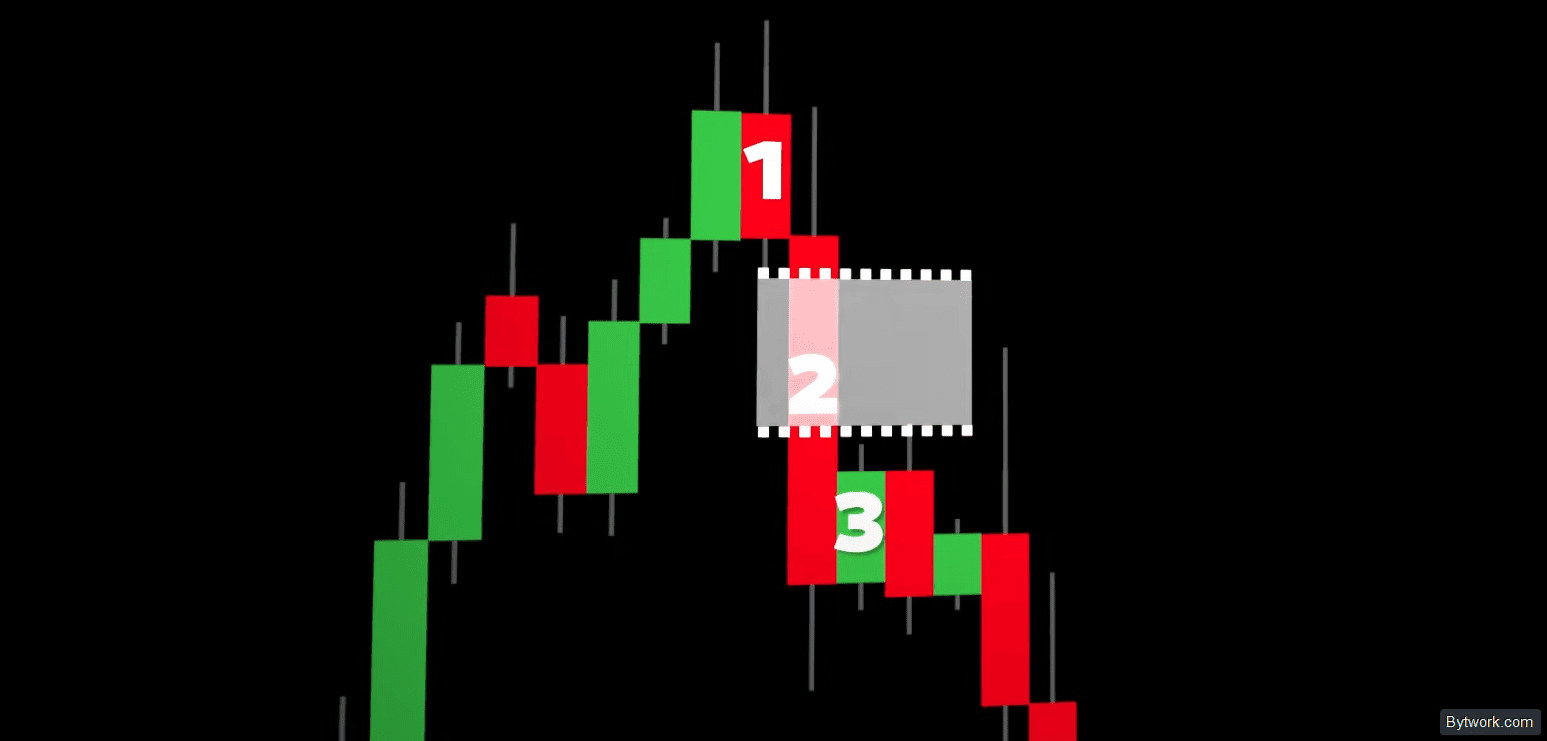
In a bearish gap (SBI), the low of the first candle does not overlap the high of the third, forming a similar imbalance.
These zones attract price, which is known as liquidity draw. They are convenient places to set profit targets and also to use for entries after a confirming signal is formed.
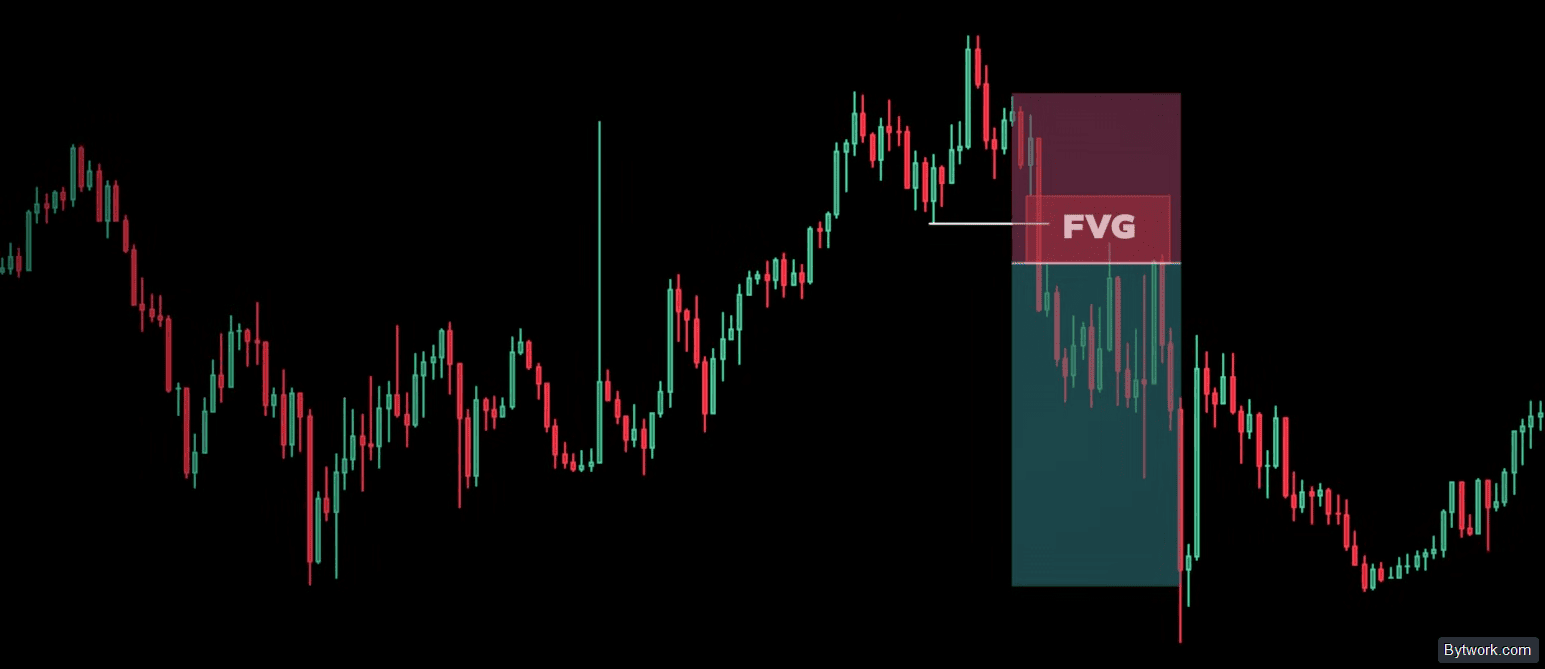
The midpoint of the imbalance is a critical level. A candle body closing above 50% for a bearish gap or below 50% for a bullish gap invalidates the setup.

From experience, FVG that forms on a break of an important level (BOS) or immediately after tends to have a significantly higher win rate.
2 Types of FVG: BISI and SIBI
To distinguish between bullish and bearish FVGs, we label them as BISI and SIBI.
- BISI (buy-side imbalance, sell-side inefficiency) - this is a bullish FVG, where a long position should be considered.

- SIBI (sell-side imbalance, buy-side inefficiency) - a bearish FVG, signaling a potential short or downward move.

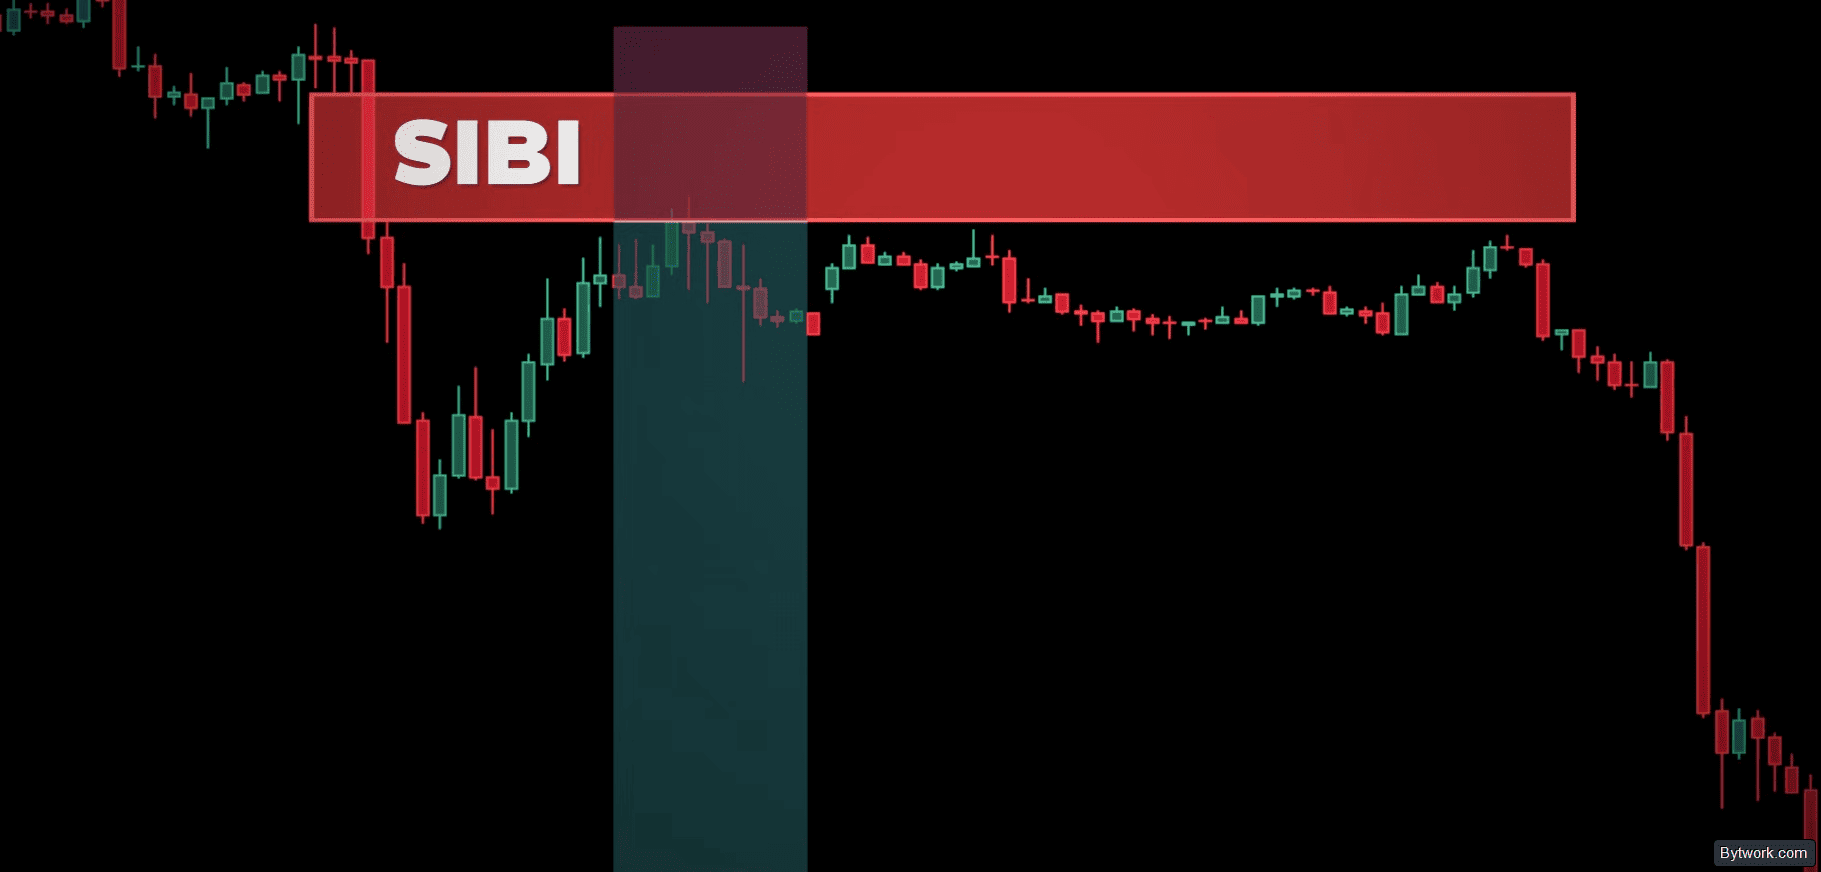
The reality is that market algorithms (Smart Money) attempt to return price to these zones to balance them and fill orders that didn't get executed due to the speed of the move.
3 Levels of FVG: IOFED, C.E., and Fill
Most traders don't know that within each gap, 3 key levels can be identified:
- IOFED (institutional order flow entry drill) – price only touches the boundary of the FVG and immediately moves in the opposite direction. This signal is strong with high momentum and large candles.
- C.E. (consequent encroachment) – the midpoint of the imbalance (50% of the zone). When price returns to the gap, it doesn't always fill it completely – sometimes it only reaches the midpoint and reverses.
- FVG fill – full filling of the gap. After this, 2 scenarios are possible: either price bounces off the level with a long wick, or it ignores it and continues the move.

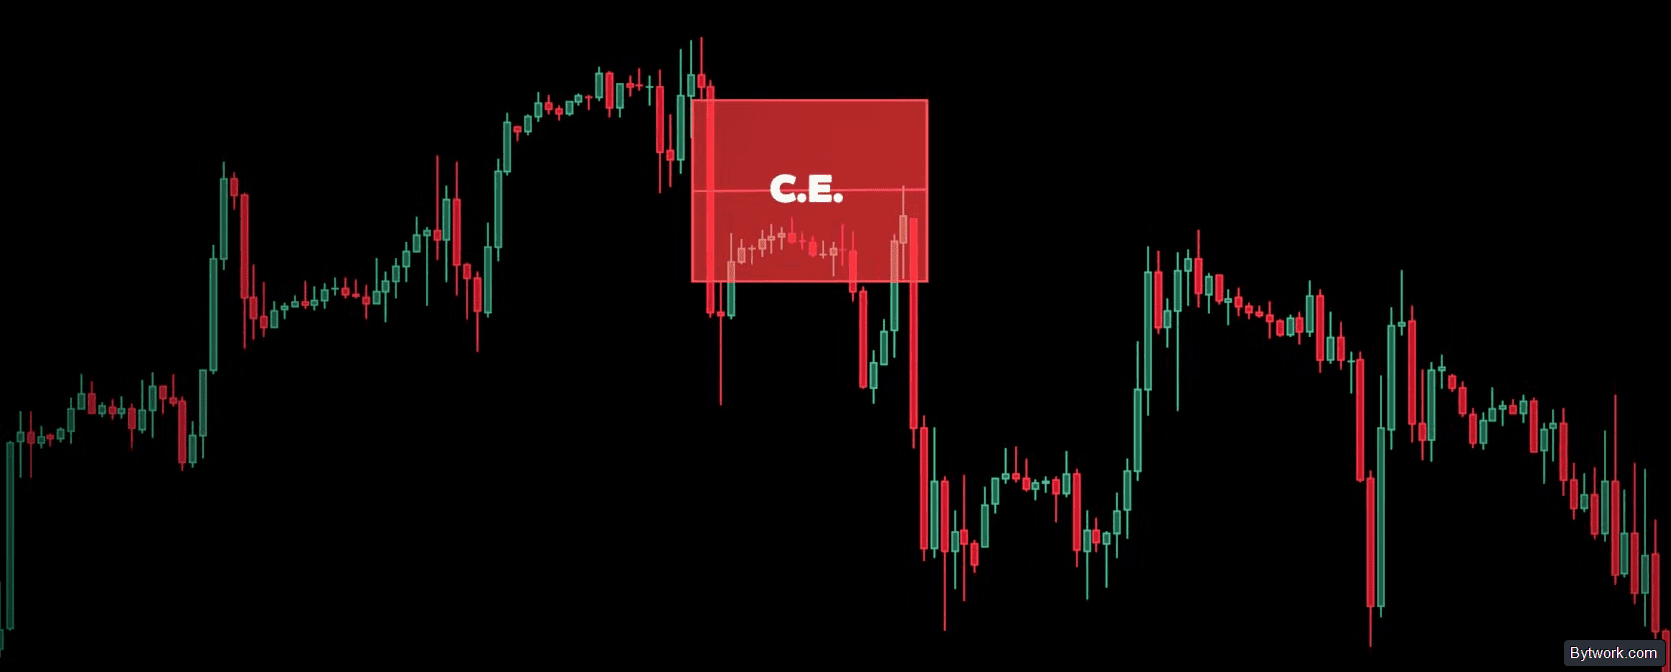

To avoid guesswork, we use these 3 reference points to monitor price behavior.
Inverse FVG
An inverse FVG (iFVG) is a regular price gap that has been broken. This is a zone that failed to hold price. Instead of bouncing, price broke through it and closed with the candle body beyond its boundaries. Let's briefly look at the iFVG strategy before moving to practice.
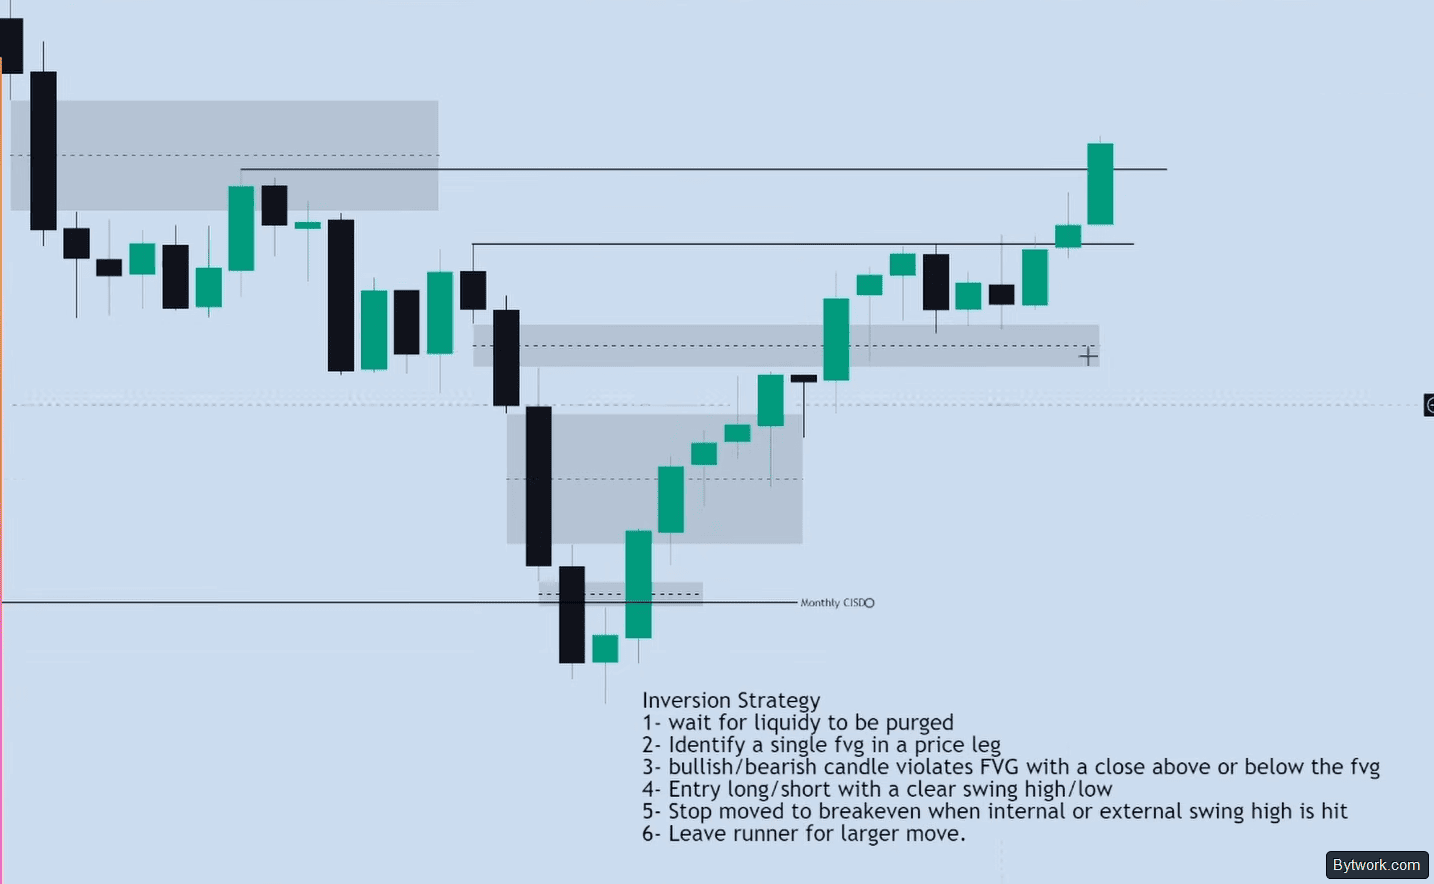
Here are 5 conditions to ensure iFVG doesn't become a trap:
- Body vs. Wick. Inversion is confirmed only when the candle body closes beyond the boundary. A wick poke and return is rebalancing, not iFVG.
- Timeframe. For entries, use timeframes from 30 seconds to 5 minutes, not higher. Higher TFs (from 15 min) are only for context.
- Taboo Zones. Do not trade iFVG in a range or 30–60 minutes before important news releases.
- Confluence. Maximum accuracy is achieved if the inversion occurs immediately after a liquidity sweep at a strong level.
- Stop-Loss. Place it beyond the boundaries of the broken imbalance or at its midpoint (C.E.).
The theory block is complete, let's move to practice.
How to Apply FVG in Practice?
After understanding the nature of FVG, the most crucial rule is to only use gaps that are aligned with the order flow and other filters.
1. Aligning FVG with the Current Trend Direction
Price does not move in a straight line but through a scatter of smaller moves that aggregate into larger swings.
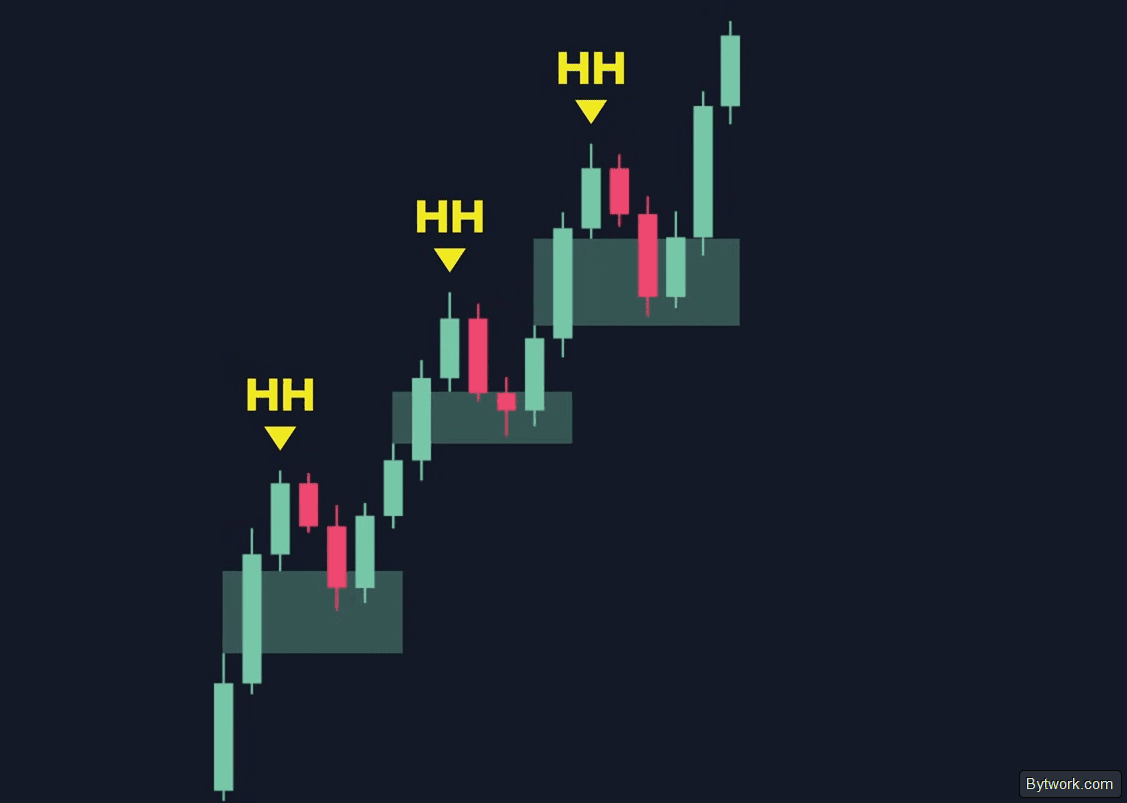
In an uptrend, maintaining strength requires fresh higher highs, after which a correction is logical. For the next impulse, price seeks support - this is where you look for a bullish FVG that provides liquidity for growth.
In a downtrend, price seeks resistance, and a bearish FVG comes into play. In the example below, each new low is accompanied by a pullback up to the bearish gap, where price encounters resistance and resumes its decline.
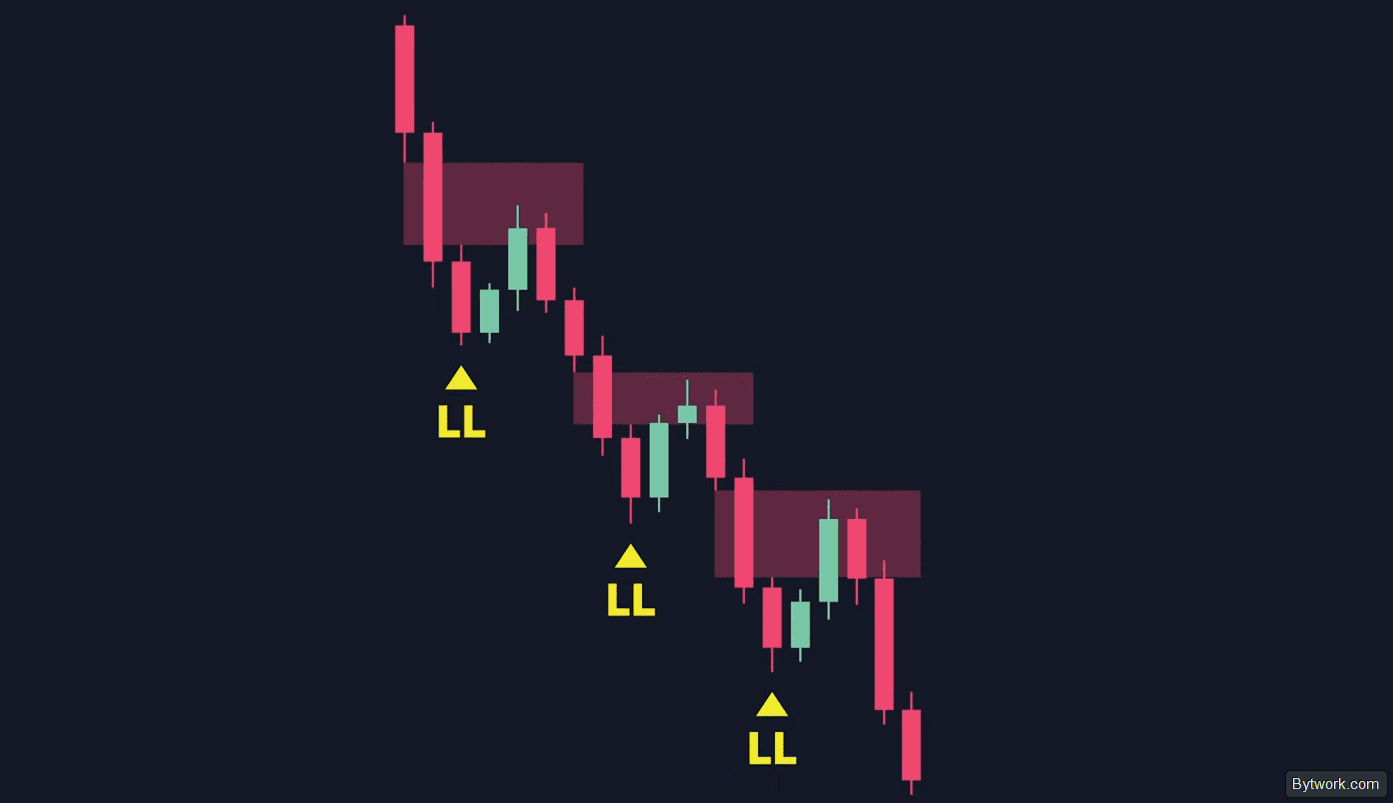
Summarizing this basic rule: in an uptrend, only trade bullish gaps; in a downtrend, only trade bearish gaps. This ensures you are always following the order flow.

Order flow is always present in the market. To avoid diluting the average entry price, the market maker guides price towards areas where retail traders' stop-losses are clustered, where liquidity concentration allows them to execute 80% of the volume with minimal slippage. After the main accumulation, price retraces to the imbalance zone (FVG) to pick up the remaining 20% of the position and neutralize the inefficiency.
2. Avoid Gaps Already Touched by Price
The next important piece of advice is to never use a Fair Value Gap that has already been touched by price. Even if price just slightly grazed the boundary of the FVG, such a gap is considered mitigated (used).
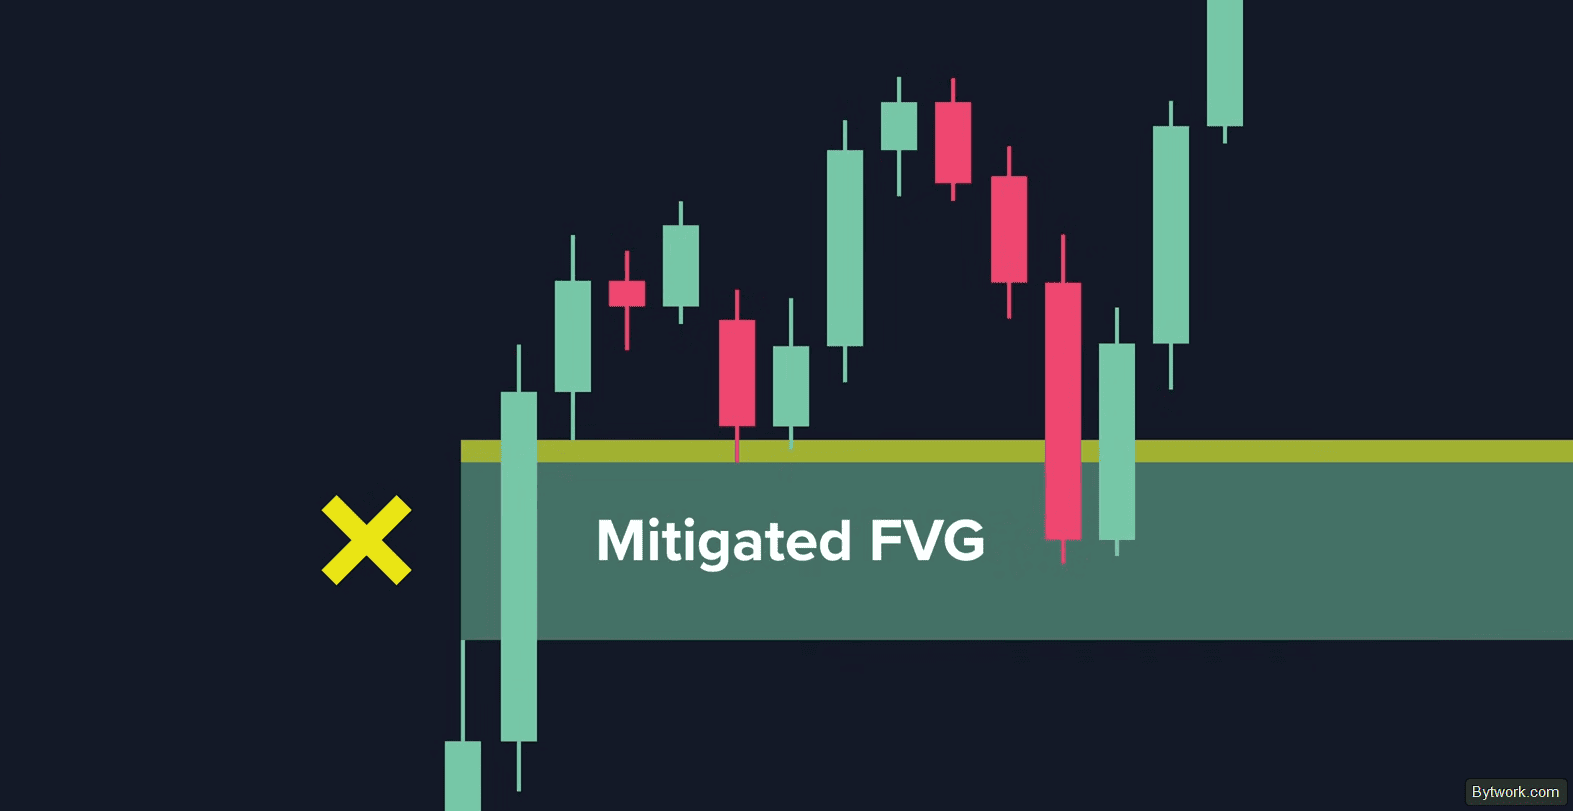
Although this doesn't guarantee it won't work on a second visit, remember that unmitigated gaps are significantly stronger than previously touched ones. It's also important to rely on the full ICT concept.
3. Look for Gaps in Premium/Discount Zones
Also, target Fair Value Gaps formed in the discount zone. When you have a strong bullish move with multiple FVGs to choose from, first mark the upper and lower boundaries of the move, as well as the 50% level (midpoint of the range). This divides the range into premium (above 50%) and discount (below 50%) zones.
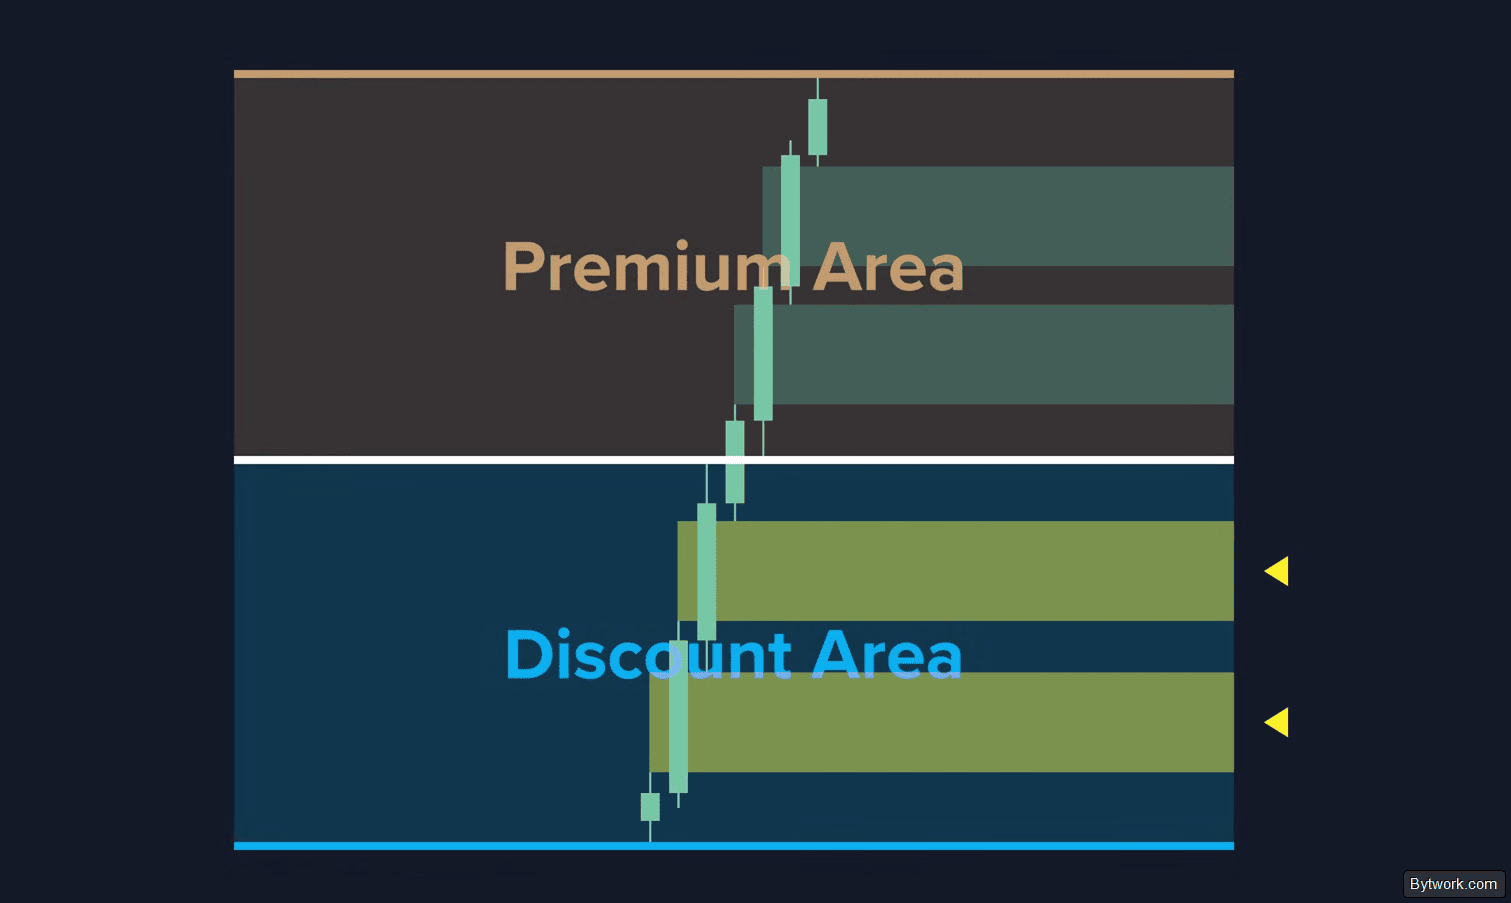
- For long positions, choose gaps located in the discount zone, as they are the strongest.
- For bearish FVGs in a downtrend, apply the same logic, but target gaps formed in the premium zone (above 50%).
Let's move on to more advanced aspects.
4. Combine Timeframes
Let's start with combining FVGs across different timeframes for a more precise entry. For an accurate entry, don't just use the boundaries of a single FVG. Instead, find a higher timeframe FVG (e.g., 4H) and then go down to a lower TF (e.g., 15 min) within it to look for a smaller FVG.
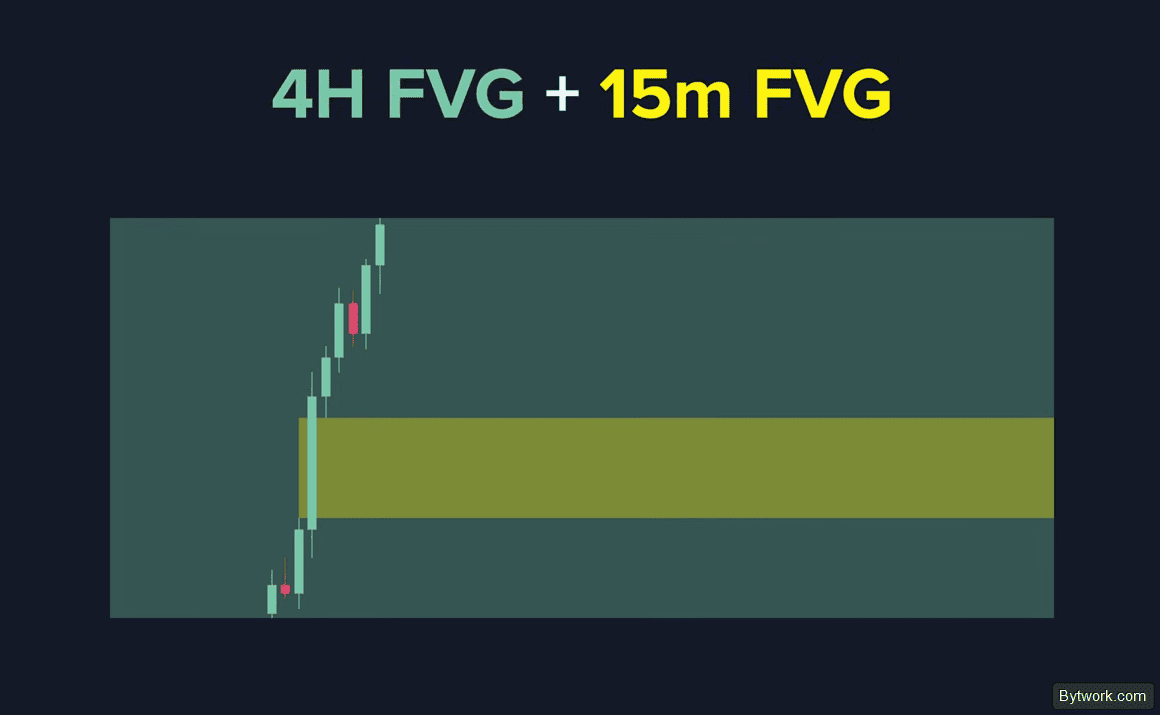
This creates convergence – a very strong support zone for your entry.
5. Analyzing the Third Candle
In the formation of an FVG, the third candle is of utmost importance, although the 2 impulse candles already set the maximum size of the gap.

- If the third candle is bearish, a Rejection FVG is formed – avoid such gaps due to selling pressure and high probability of failure.
- If the third candle is bullish and impulsive, its a Breakaway FVG – this is the one to look for. It provides reliable support for the next upward impulse, although price may take longer to enter it.
6. FVG and Liquidity Zones
FVGs near liquidity zones are the strongest. Price moves towards external liquidity (previous high/low), using internal liquidity (FVG) as fuel. Depending on how liquidity is taken, 2 scenarios are possible.
- Liquidity Run - confirms the continuation of a bullish trend. On such a breakout, look for a bullish FVG that formed precisely within the move that broke the liquidity level. Such a gap has exceptional strength due to the confluence with the run.
- Liquidity Sweep - price touches the high, but the candle cannot close above it – this is a liquidity sweep. This indicates buyer weakness. Do not use such an FVG for a long – instead, look for bearish FVGs (with the flow).
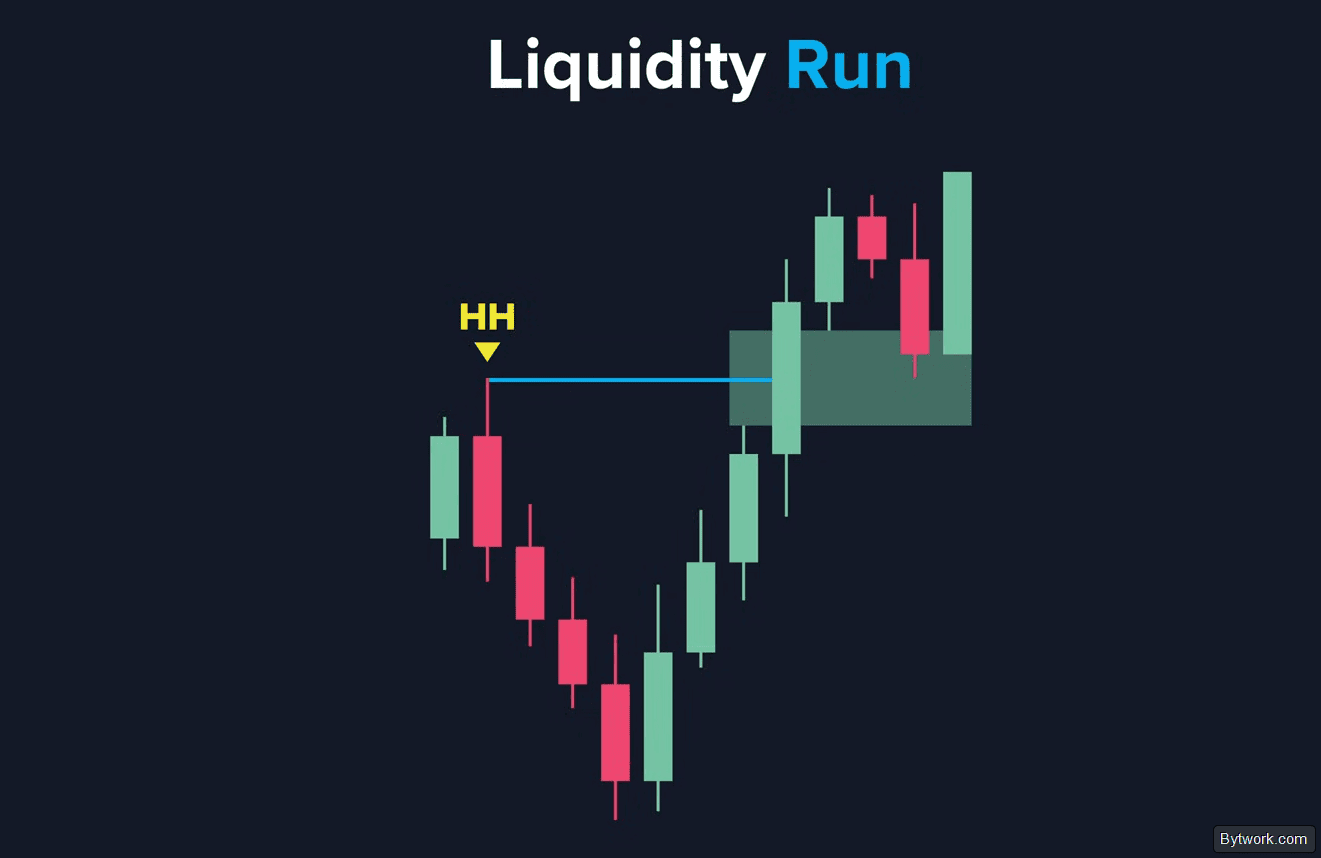

Switching to a bearish FVG fully aligns with the first rule about following the order flow.
A reliable setup = 3 factors:
- Liquidity Sweep. Price moves beyond a level (session high or equal highs), collecting retail stops.
- Aggressive Reversal with the formation of an FVG.
- Entry on the Retest of this FVG (often at 50% - C.E.) with a target at the opposite liquidity pool.
Finally, avoid trading FVG during consolidation periods.
7. Consolidation
The easiest way to make money is to trade in trending phases, where there is enough confirmation of trend continuation. Most traders can recognize a trend reversal by market structure, but in a consolidation zone, they often take losses, unsure of which direction to trade.

To determine the trending bias, wait for price to respect (honor) one FVG, and then from that move, a new FVG is formed that allows the move to continue.
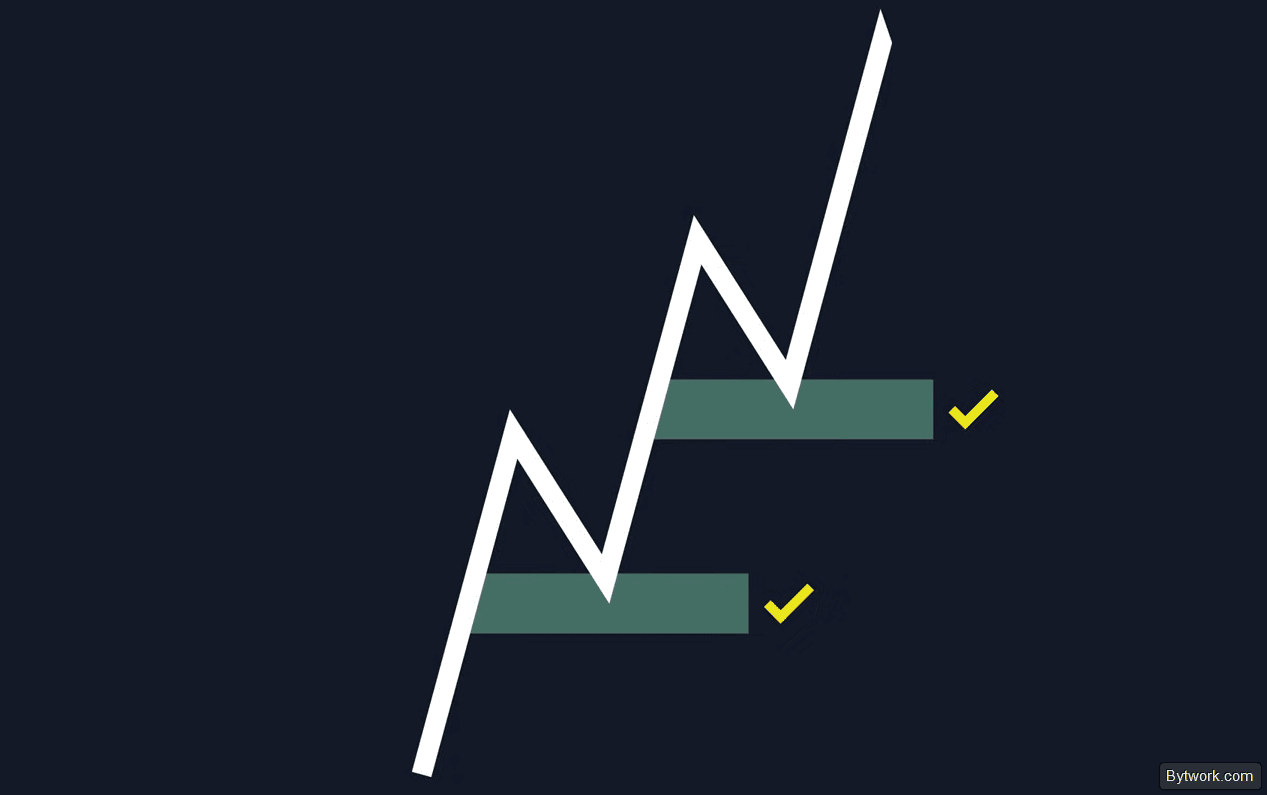
However, if a bullish FVG fails, and then a bearish one fails next – this is a clear sign of entering consolidation!

If you prefer to only trade with the trend, wait for price to create and respect 2 new consecutive FVGs, because this will give you a new short-term directional signal and a clear basis for resuming trend-following.
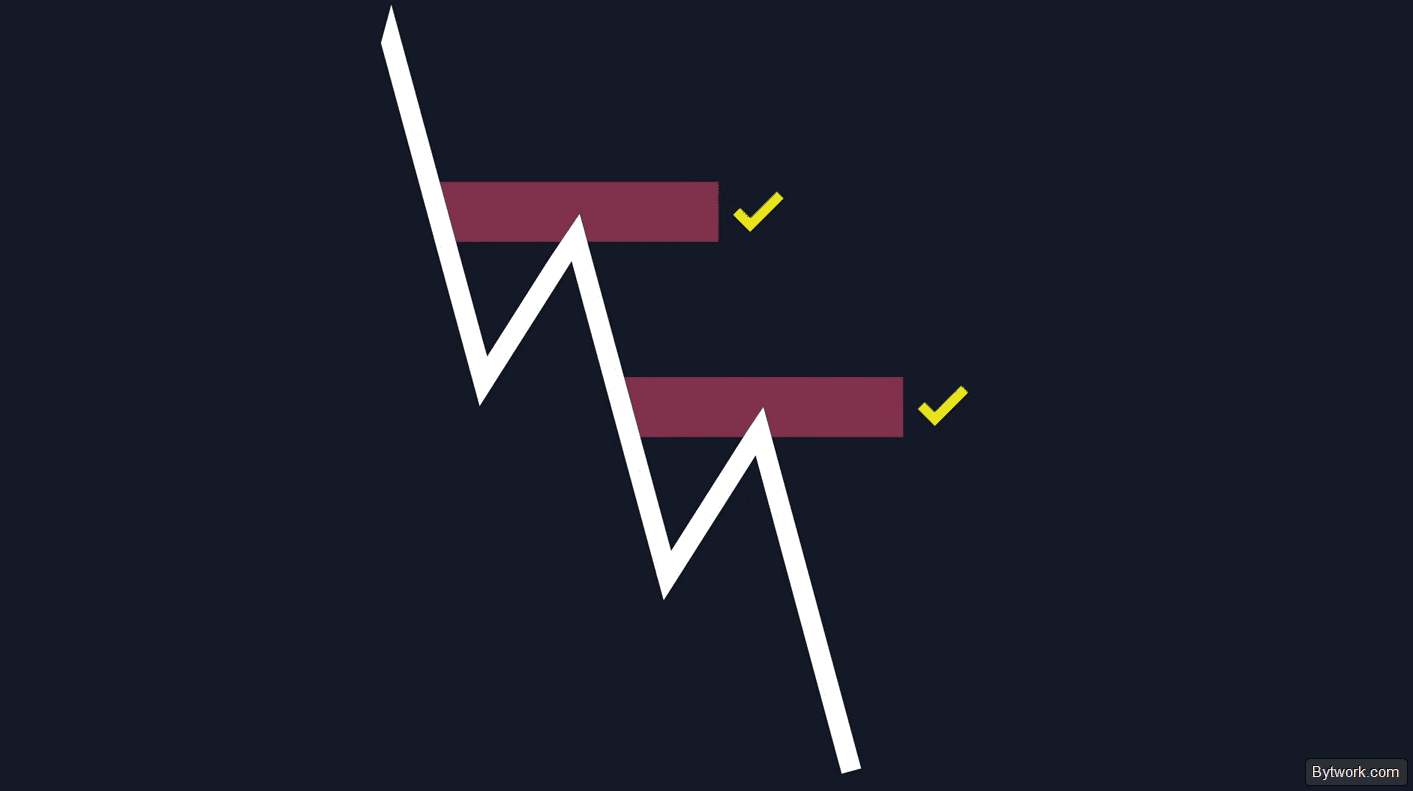
Hence, 3 rules for FVG entry:
- Wait for the exit from consolidation. Price must confirm and start a structure on a lower TF.
- Look for BOS. Only an FVG that leads to a break of structure (BOS) or breakout from a significant range is valid.
- Use a trend beacon - the 200 EMA on a higher TF, for example, 4H. A cast-iron rule: when price is above, only bullish FVGs; below, only bearish FVGs.
What are the FVG Strategies?
Let's look at the simplest one and 7 advanced FVG strategies.
Simple Single Timeframe Strategy
A 15-minute chart is sufficient for this. Wait for the market to break a high, and then expand downwards, breaking a low. The indicator will show a formed gap.
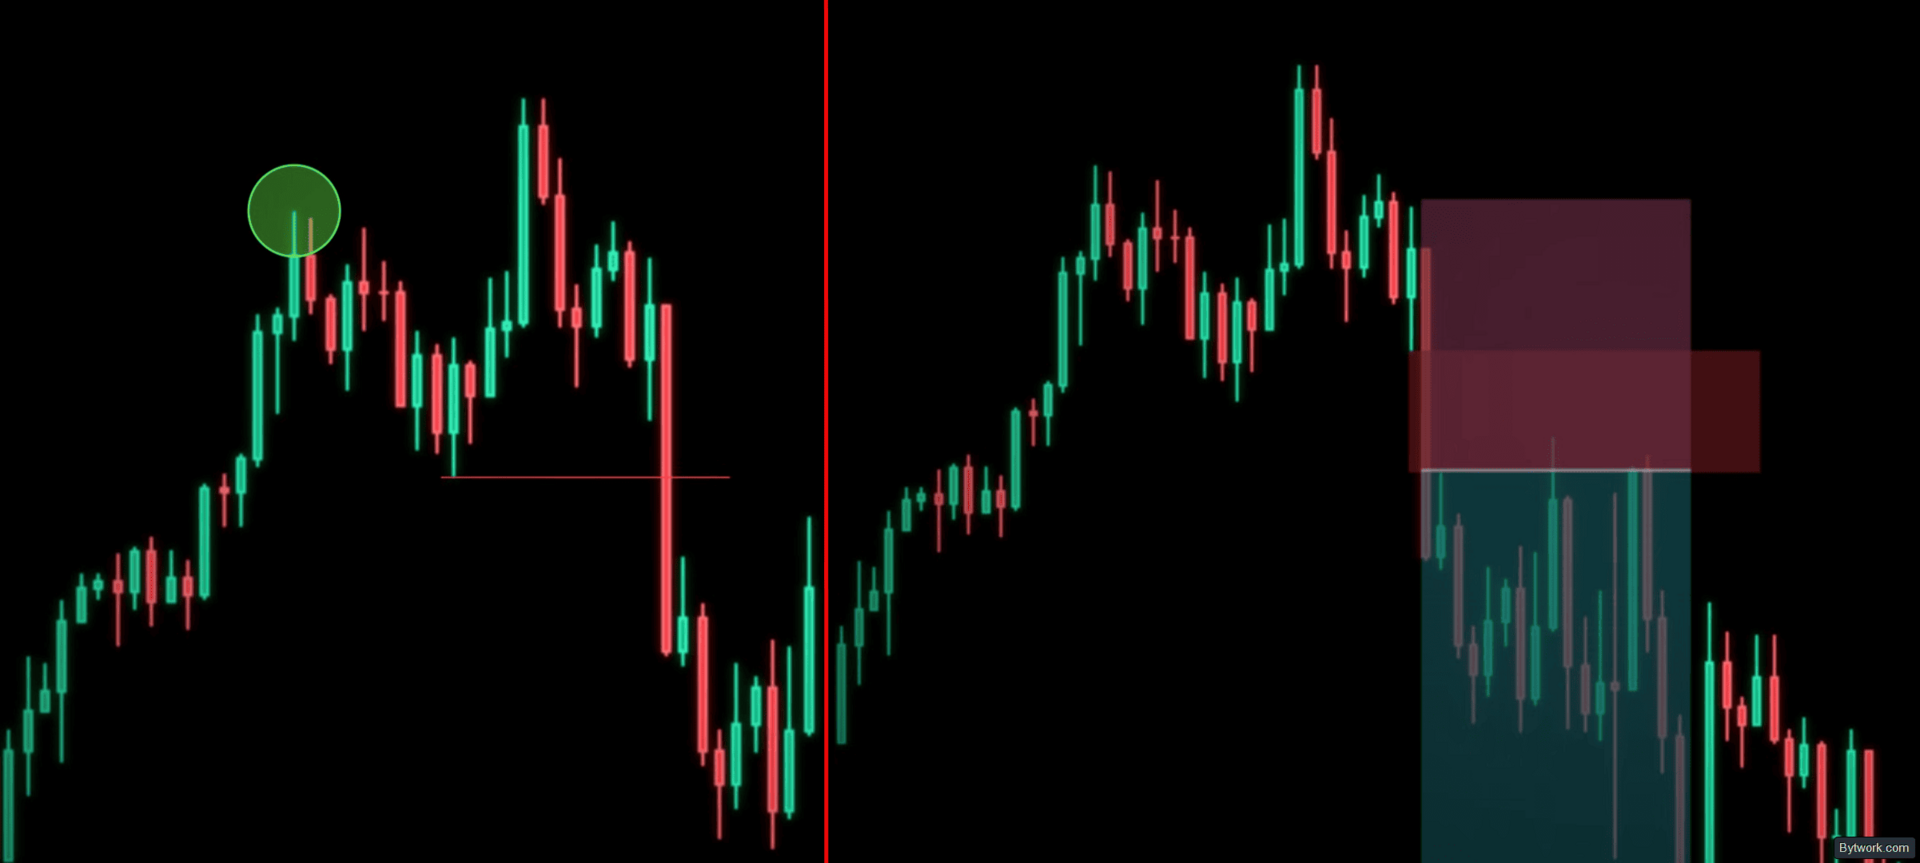
Enter a short position on the first touch of the zone, place a stop above the FVG, and set the target at the nearest swing low.
Let's look at the essence of 6 more strategies.
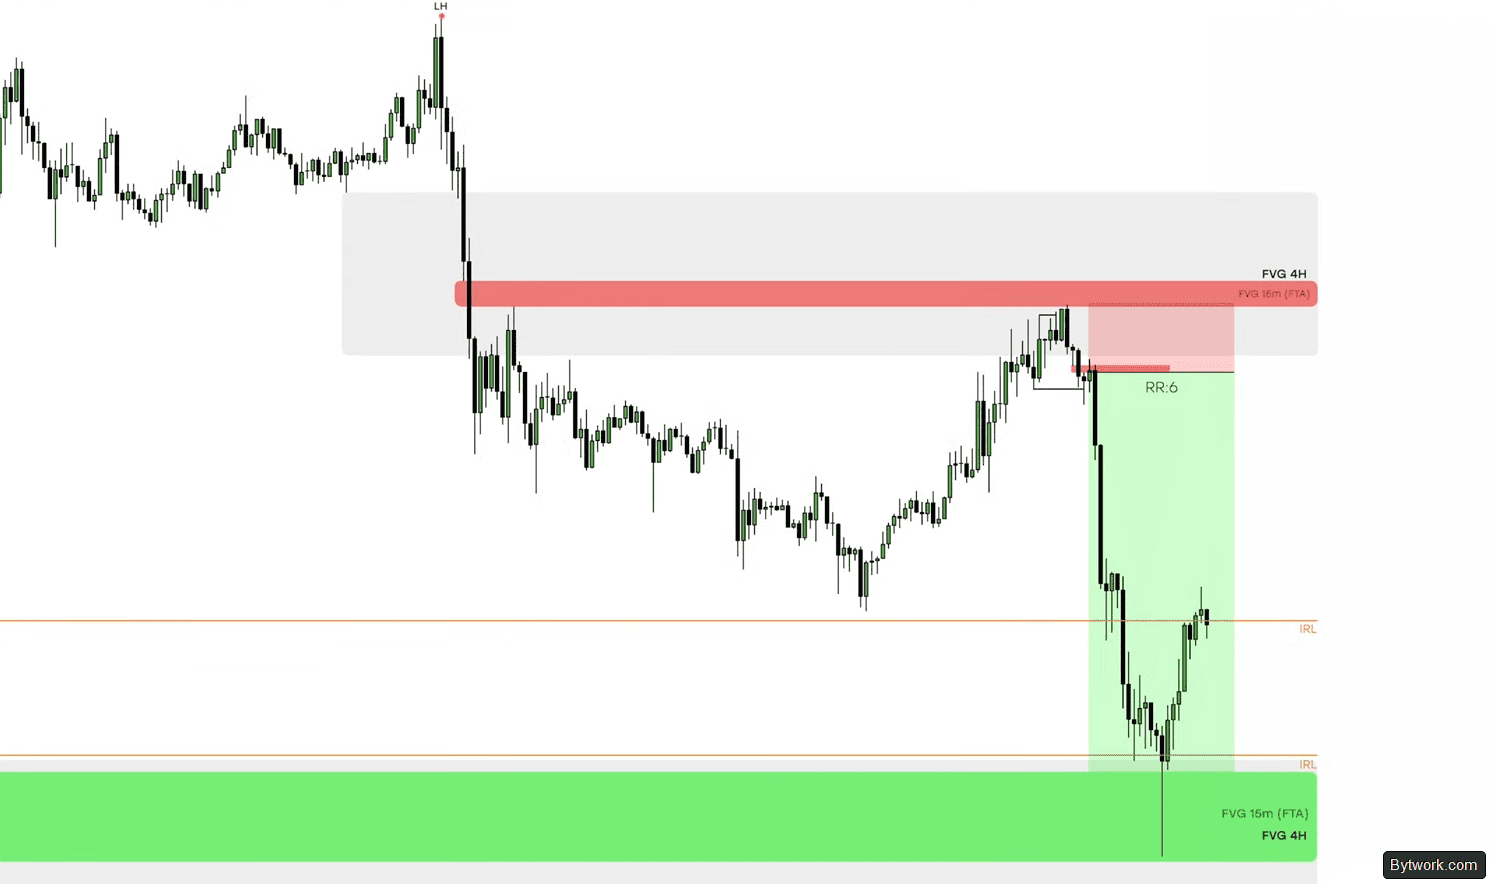
Strategy 1 – Sweep + BOS + FVG
The logic is to sweep liquidity, break structure, and catch the imbalance.
- Setup - a level (session high/low or equal extremes).
- Criteria - price sweeps the level, sharply reverses with a BOS, and forms an FVG.
- Entry on a limit order at 50% of the FVG (C.E.) or near the start.
- Stop/Take Profit - stop beyond the FVG boundary; take profit at RR 1:3 or 1:6.
- Win rate stats 81% on M15 during the first hour of the session.
Strategy 2 – Inverse FVG (iFVG)
The idea is that a broken FVG requalifies as support/resistance.
- The criteria is a candle closing with its body above (for bullish) or below (for bearish) the FVG boundaries.
- Entry on a retest of the iFVG zone after the close.
- Strict filter: the pattern loses validity in a consolidation.
- Timeframe choose from 30 seconds to 5 minutes.

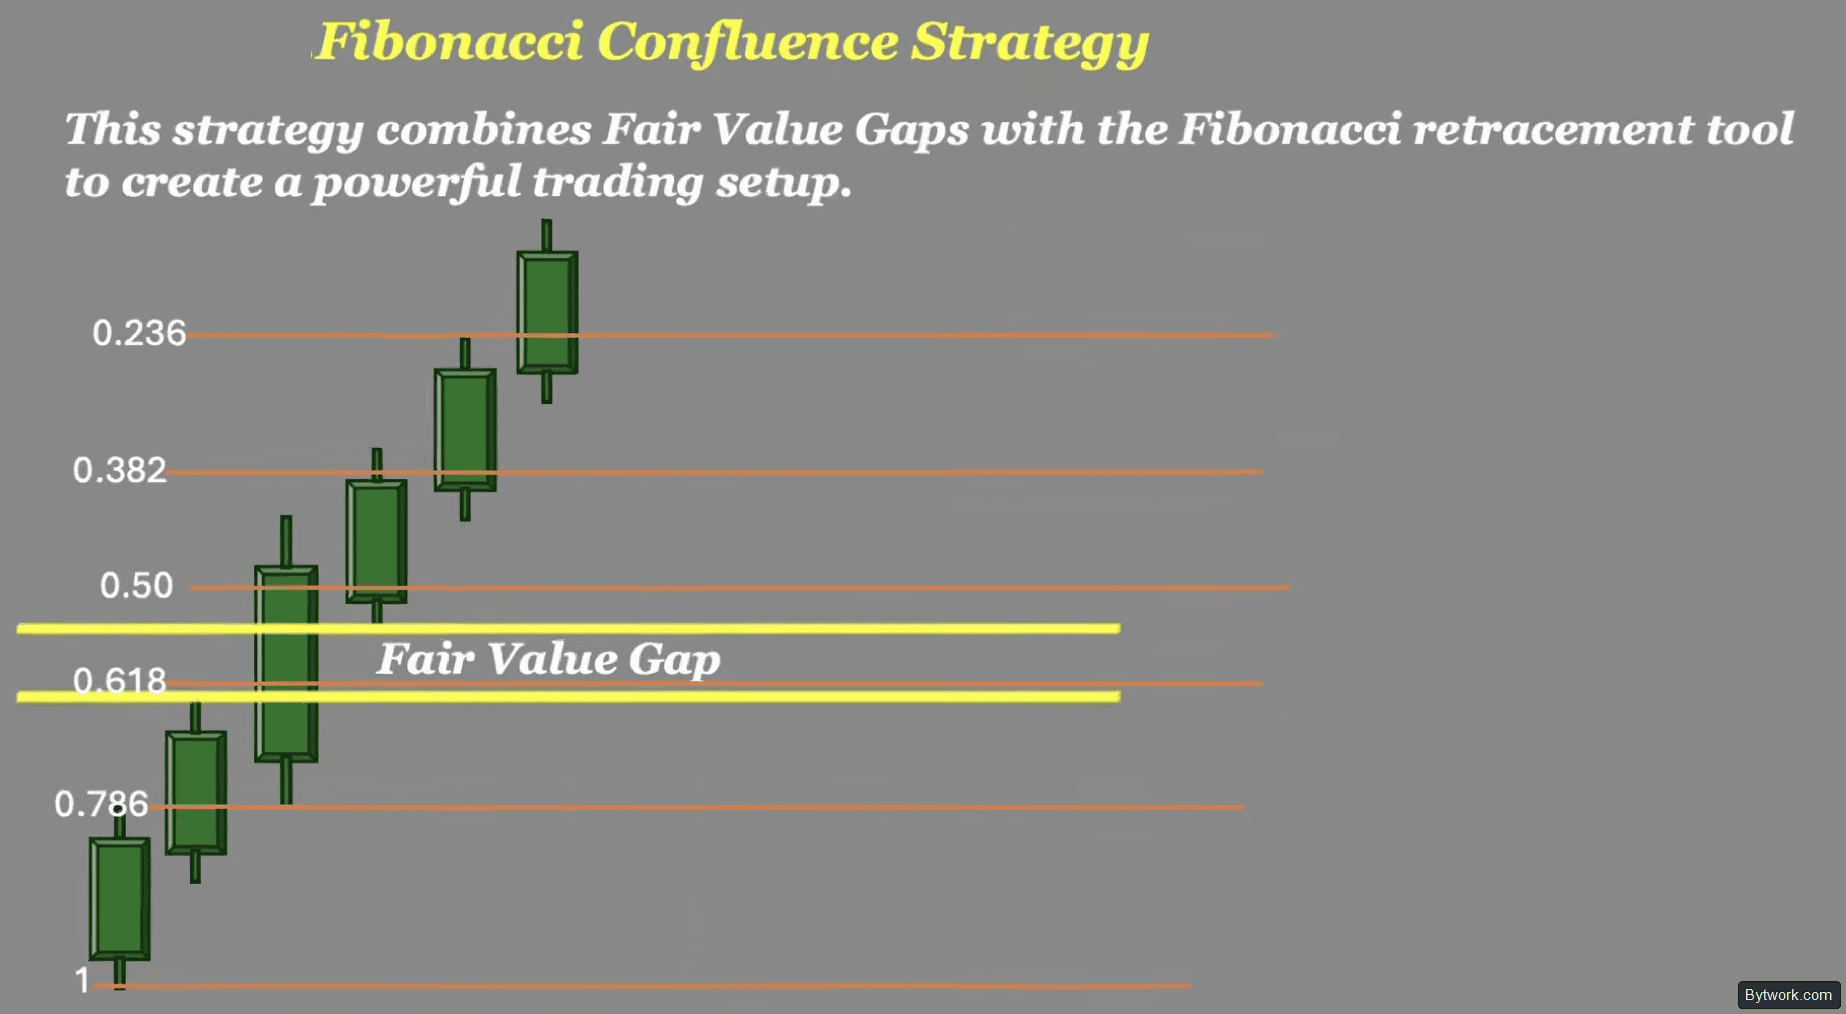
Strategy 3 – FVG + Fibonacci
Our goal is to filter FVGs using a Fibonacci grid.
- Criteria - confluence of FVG with the 61.8% or 50% levels.
- Entry only in the discount zone (<0.5) for longs and in the premium zone (>0.5) for shorts.
- Skip if the FVG is at the 0.5 level or above.
Strategy 4 – FVG + Refining Order Block
The idea is to refine the entry within a higher TF OB using a nested FVG.
- Find OB on a higher TF (30m).
- Entry based on the FVG within this OB on a lower TF (5m or 1m).
- Result the stop-loss is reduced by 3–5 times.

Strategy 5 – Volume Profile
The logic of the strategy is to trade from the boundaries of value areas confirmed by an FVG.
- Enable Volume Profile, highlight HVN and adjacent shelves.
- Wait for touch of the HVN edge + reversal candle + FVG on the 1m TF.
- Entry based on the formed FVG.
- Take Profit - the next volume shelf.
- Case - $16,000 profit with $5,000 risk (RR 3:1).

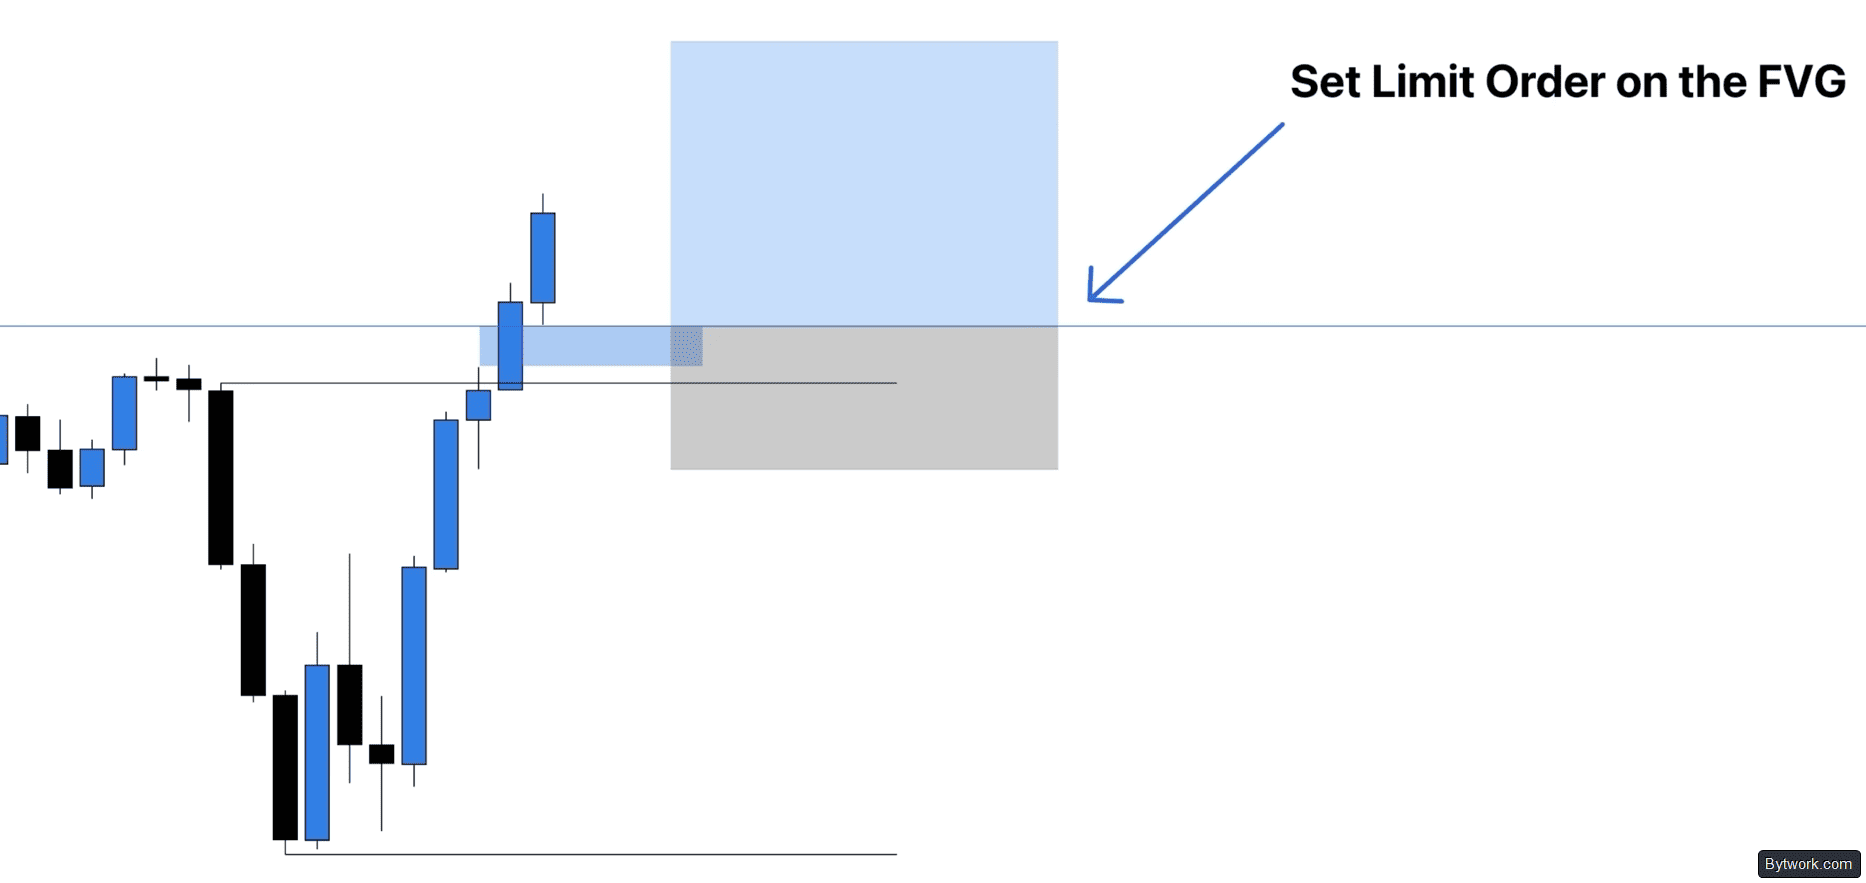
Strategy 6 – Killzones and Volatility
Here we enter based on FVG during periods of high volatility.
- Setup - the first 5- or 15-minute candle after a news event.
- Criteria – price breaks out of this candle's range with an FVG formation.
- Entry based on the FVG on the 1m TF.
- Strict timing. The trade is closed after 10–30 min.
Now let's look at all the drawbacks.
When Does FVG Not Work?
FVG is not perfect and has several drawbacks. Take a look at the 2 tables below.
|
Drawback |
Essence |
Figures and Facts |
|
Low Win Rate |
Trading FVG without filters leads to losses because most imbalances are traps. |
Win rate only ~43% (based on tests). |
|
Long Wait Times |
Price is not obligated to fill the gap quickly; random entries and a series of stops are guaranteed. |
On USDT/USDC, the fill stretched over 1.5 months. |
|
Ranging Market |
In a consolidation, FVGs get whipsawed back and forth, losing significance; trading iFVG within a flat is a frequent cause of losses. |
Validity disappears, no clear direction. |
|
Overload of Filters |
To improve results, one has to pile on many concepts (CHoCH, Liquidity Sweep, Fibo, Killzones...) - it becomes overwhelming. |
Win rate with filters can rise to 70–81%, but there are so many signals that the logic becomes confusing. |
If the wick of the first candle overlaps the wick of the third by at least 1 pip - there is no imbalance on the chart.
|
Drawback |
Essence |
Figures and Facts |
|
Markup Errors |
Everyone marks boundaries differently, often confusing inside bars with the mother candle. |
Orders don't reach the zone or stops get hit due to poor markup. |
|
Smart Money Manipulation |
Large players run price through visible FVGs to collect retail stops. |
A perfect test of the zone - and immediately a stop loss hits seconds before the actual reversal. |
The most costly misconception for a beginner is the belief that the market must fill this gap. In reality, FVG filling can take days, weeks, or even months.
Answering Your Questions About FVG
Below, we cover traps, safe entries, hierarchies, and other important questions regarding FVG trading.
FVG Hierarchy - Profitable and Unprofitable Gaps
- How to understand which gap is the most important?
-
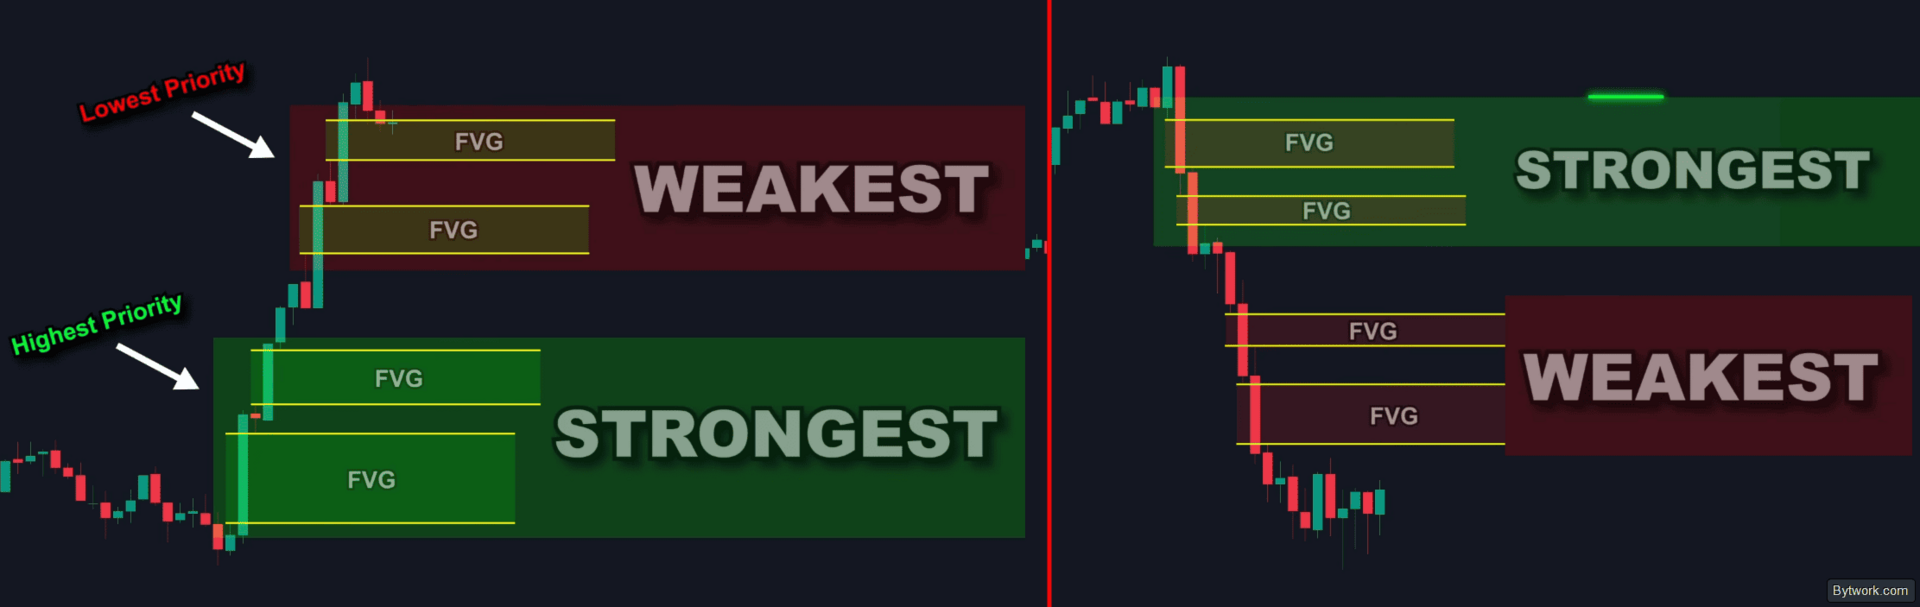
In a bullish market, the lowest gap on the chart is the strongest. In a bearish market, the highest is the strongest. For precise filtering, use a Gann fan with levels 0, 0.5, and 1. Only trade gaps located in the lower third (for buys) or upper third (for sells) of the entire move.
- Why can't a fresh FVG be used as a support zone for entering a buy?
-
If the higher TF (weekly/daily) dictates a downward priority, the new imbalance does not qualify as a support zone. The chances of a bounce up are low, so this zone is used only for short profit-taking, not for opening a long.
FVG Trap - How to Tell an FVG Has Lost Steam
- How to determine that an FVG has lost its strength?
-
Any, even minimal, touch of the gap's edge by price is enough. After a touch, the gap becomes mitigated, and its value drops sharply. Untouched, unmitigated gaps are orders of magnitude stronger.
- Which type of FVG is preferable for trend continuation?
-
A gap where the third candle continues the impulse (e.g., another bullish candle in a bullish move) - this is a breakout gap. It stays out of the spotlight longer, but on return, it provides solid support. A bounce gap (with a bearish third candle) is unreliable and best avoided.
- When is an inversion signal most reliable?
-
Only on the first retest of the broken zone. Each subsequent touch reduces the statistical weight of the zone.
- When does an imbalance lose its effectiveness?
-
After a complete fill of the entire zone - such an imbalance no longer qualifies as a zone of interest. A partial fill (touch or 50%) retains its potential for future reactions.
Sweeps, Breakouts, and Fills - Reading the Reaction to FVG
- What is the difference between a breakout and a liquidity sweep for FVG?
-
On a breakout, price pushes through the liquidity level – this is a signal for trend continuation, and the FVG within such a move acts as a strong zone. On a sweep, price merely scratches the level without closing beyond it – this is a reversal signal, and an FVG born from a sweep is not used for entries in the direction of the previous trend.
- What is the essence of entering after an imbalance fill?
-
A fill indicates that the algorithmic mission of large sellers has been accomplished. After this pressure is removed, a bounce becomes more likely than a continuation of the drop.
- When is it better to avoid FVG trades altogether?
-
When a bullish gap fails, and then a bearish one breaks down as well – this is a clear sign of consolidation. In this phase, gaps stop providing reliable signals, and it's better to wait for 2 new consecutively respected FVGs to define a new trend.
Safe Entry and Confirmations Within FVG
- How to increase entry precision when using FVG?
-
Drop to a lower TF and find an additional gap in the same direction within the higher TF FVG. The convergence of 2 levels creates a narrow zone, providing a much clearer entry than just the boundaries of the higher gap.
- What must happen before a conservative FVG entry?
-
Before entering, wait for a break of structure on the lower TF (H1 or H4) after price has touched the imbalance zone. Only this confirmation allows placing a tight stop and entering with a better R/R.
- Is additional confirmation required for an entry at the FVG midpoint?
-
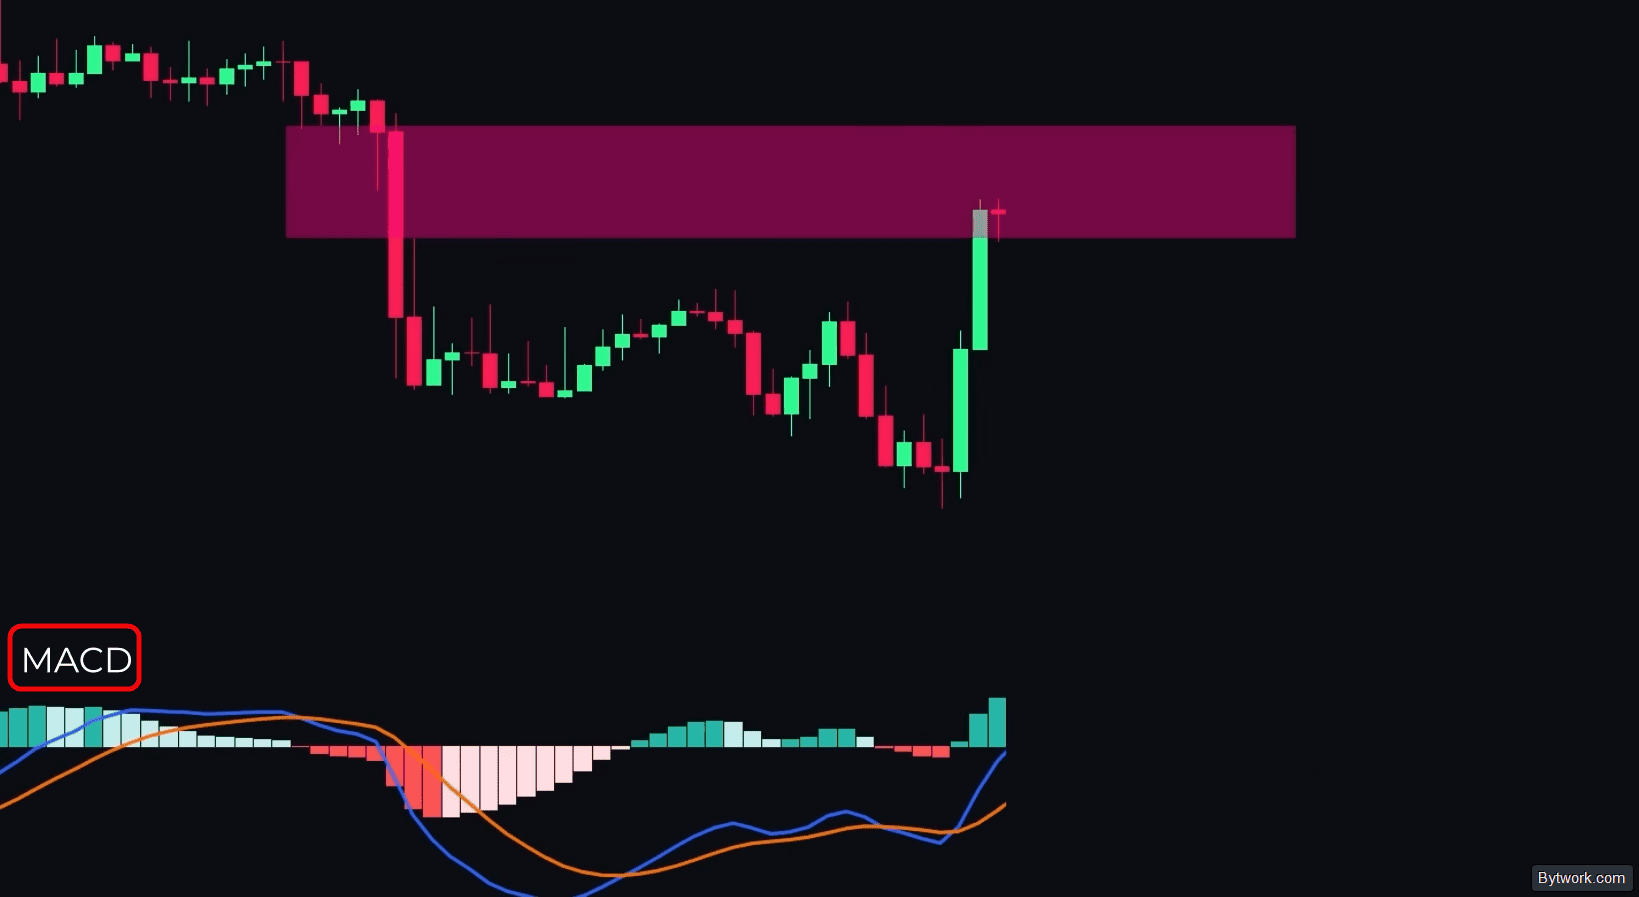
Yes, entering solely at the midpoint of the gap is not enough. You need additional confirmation on the lower TF (for example, a MACD (12,26,9) signal) and ensure that on retest, price did not close beyond the gap boundary.
Getting the Most Out of FVG - From Settings to R/R
- What risk-reward ratios are achievable in real trading of imbalances?
-
In the scenarios reviewed, ratios like 1.8, 2.7, 1 to 4, and 1.13 were obtained. The difference depends on the choice between an aggressive entry (limit order) and a conservative one (after a break of structure).
- Which Price Action Toolkit settings yield more signals?
-
Lowering the pivot length and wick body ratio increases sensitivity, allowing more liquidity grabs to be captured. To filter out small gaps, adjust the threshold in the appropriate parameters section.
Our experience is now fully shared. Below we've compiled the final checklists.
Final Summary
Only all the steps listed make FVG reliable. Without filters, trading FVG is a mathematical drain.
Backtests show a base win rate of around 43%. However, a systematic approach with stringent filtering via CHoCH, Premium/Discount, Unmitigated, Inside Bars, Body Close, and the strength of key levels can push performance up to 70% in scalping and up to 81% on the daily timeframe.
Priority for opening positions goes to imbalances (FVGs) born at the beginning of an impulsive move within discount zones for longs or premium zones for shorts. FVGs at the peaks of price impulses are weak and should be avoided due to the increased risk of correction.
- Entry is only allowed upon a break of structure or change in market sentiment - without this, trades are NOT opened.
- Guideline in a bearish market for shorts - only FVGs in the premium zone; in a bullish market for longs - only in the discount zone.
- Primarily look for FVGs at market extremes.
- Use unmitigated FVGs - zones are for a single touch; trade on the first price entry; after filling, the area is no longer considered.
Here are checklists to help you master FVG.
|
# |
Criteria |
Essence |
|
1 |
Overall Statistics |
Without filters win rate 43%, with filters - 70–81% |
|
2 |
Structure (3 candles) |
The wick of the 1st candle does not overlap the wick of the 3rd |
|
3 |
Inside Bar |
If the 1st or 2nd candle is an IB, FVG boundaries are redefined based on the mother candle |
|
4 |
Body of the 2nd candle |
Moves are solid, long wicks are excluded |
|
5 |
HTF Bias |
BISI (long) / SIBI (short) must be confirmed by the higher TF trend |
|
6 |
Fibo Zone |
Long - below 0.5 (discount); Short - above 0.5 (premium) |
|
7 |
Unmitigated |
Price has never touched the zone (effectiveness decreases after the 1st test) |
|
8 |
Break of Structure |
FVG is formed at the moment or immediately after a BOS/CHoCH breakout |
|
9 |
Size |
Select only large, noticeable gaps (ignore small ones) |
Strictly avoid FVGs in a range and half an hour to an hour before news spikes. When marking, account for inside bars - shift gap boundaries to the mother candle to avoid false signals.
|
# |
Criteria |
Essence |
|
1 |
Entry (Aggressive) |
From the zone boundary (0% Fill) |
|
2 |
Entry (Conservative) |
Limit order at 50% (C. E.) |
|
3 |
Stop Loss |
Beyond the edge of the 1st candle of the formation or beyond the nearest order block |
|
4 |
Take Profit |
A liquidity shelf or an opposing FVG |
|
5 |
Breakeven Arithmetic |
With RR = 1:6, only 15% winning trades are needed |
|
6 |
Body Close (Invalidation) |
Bearish - close above 50% of the body; Bullish - close below 50% of the body |
|
7 |
Inversion (iFVG) |
Price broke through the FVG and closed with its body beyond it, meaning look for an entry on the retest of the mirrored level |
In the Smart Money paradigm, double top and bottom are liquidity zones, not reversal patterns. Algorithms conduct liquidity grabs beyond these levels via the "Turtle Soup" manipulation. As a result, they take out retail buy-stop orders above the top and sell-stop orders below the bottom, allowing large institutional limit orders to be executed.
Our comprehensive approach provides mastery of FVG and institutional-level precision. Happy trading!
Postscript: We've been trading since 2018 and have tested hundreds of strategies and indicators. Your editor is Pavel Grachev for bytwork.com.

Now reading


In DePin, people create networks themselves, share traffic or capacity, and receive rewards in tokens from these projects.