Double Top and Double Bottom: How to Squeeze a 1:6 Profit from the Pattern
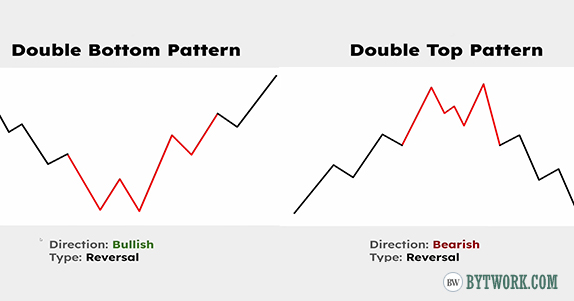
You will learn how 5 entry techniques turn standard patterns into a tool for siphoning funds from the crowd of traders. While 90% of traders see M and W letters and give their stops to market makers, you will learn to enter at the trend inception with a risk-reward of at least 1:3.
You will learn about liquidity mechanics and the mathematics of 5 reversal scenarios. We will also look at the secrets of double tops, because they often turn into triple tops, knocking out stop-losses of those who entered on the second peak.
Double Top and Double Bottom Patterns
Double top and double bottom are chart reversal patterns that form when price tests a resistance or support level twice, followed by a breakout of the neckline (more on that below). This signals exhaustion of the current momentum and a change in market direction. Understanding the psychology of trend reversal allows you to trade patterns not as templates, but as price reactions to support and resistance levels.
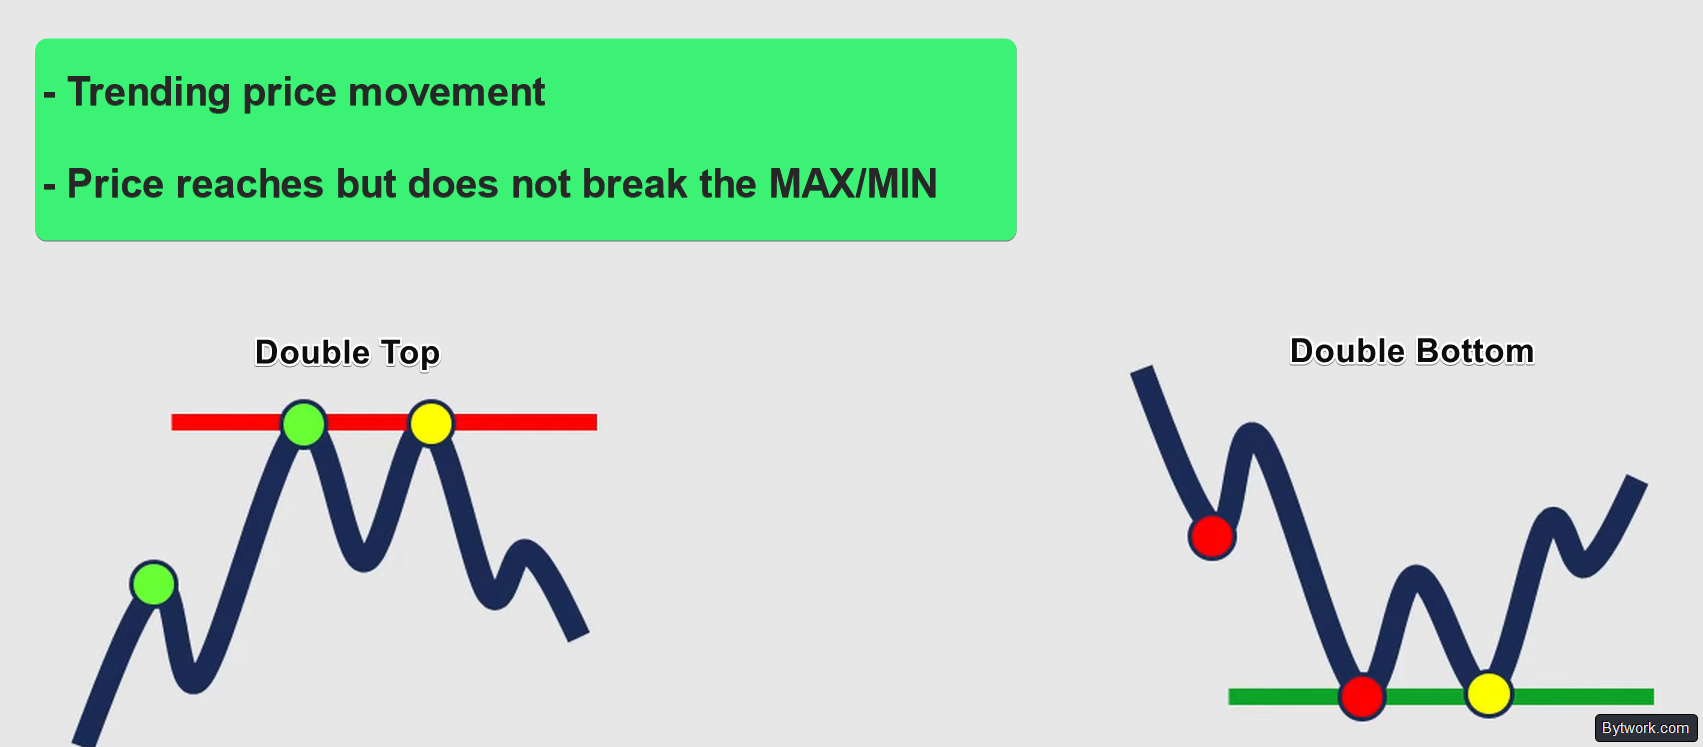
Price approaches an important level twice but does not update the local high or low.
Let's start with the double top pattern.
Double Top
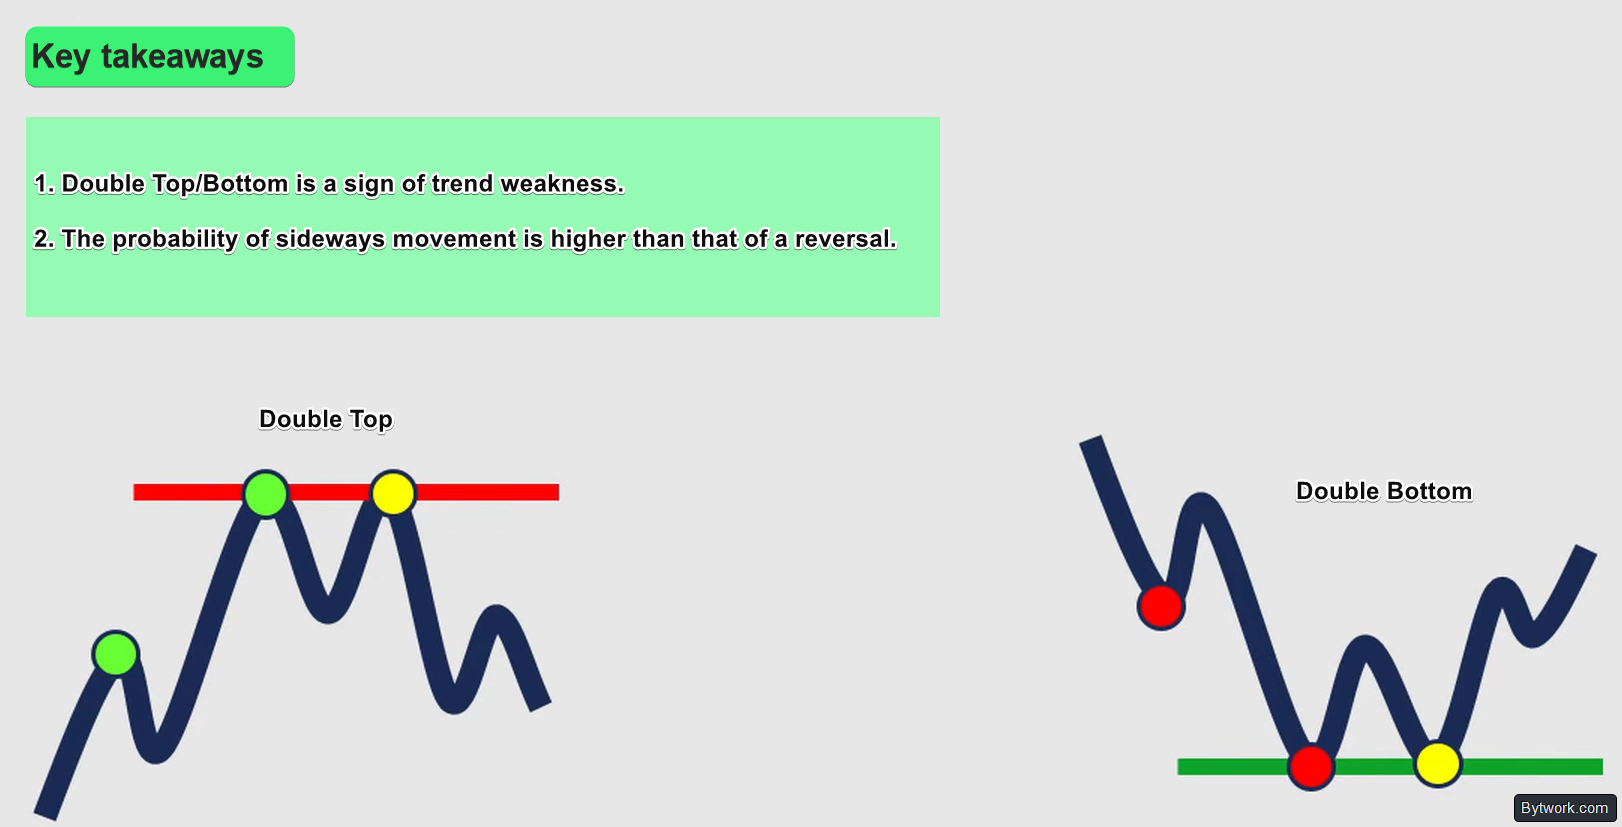
First, an uptrend forms, then price reaches the same high twice. These tops form a resistance level in terms of price action.
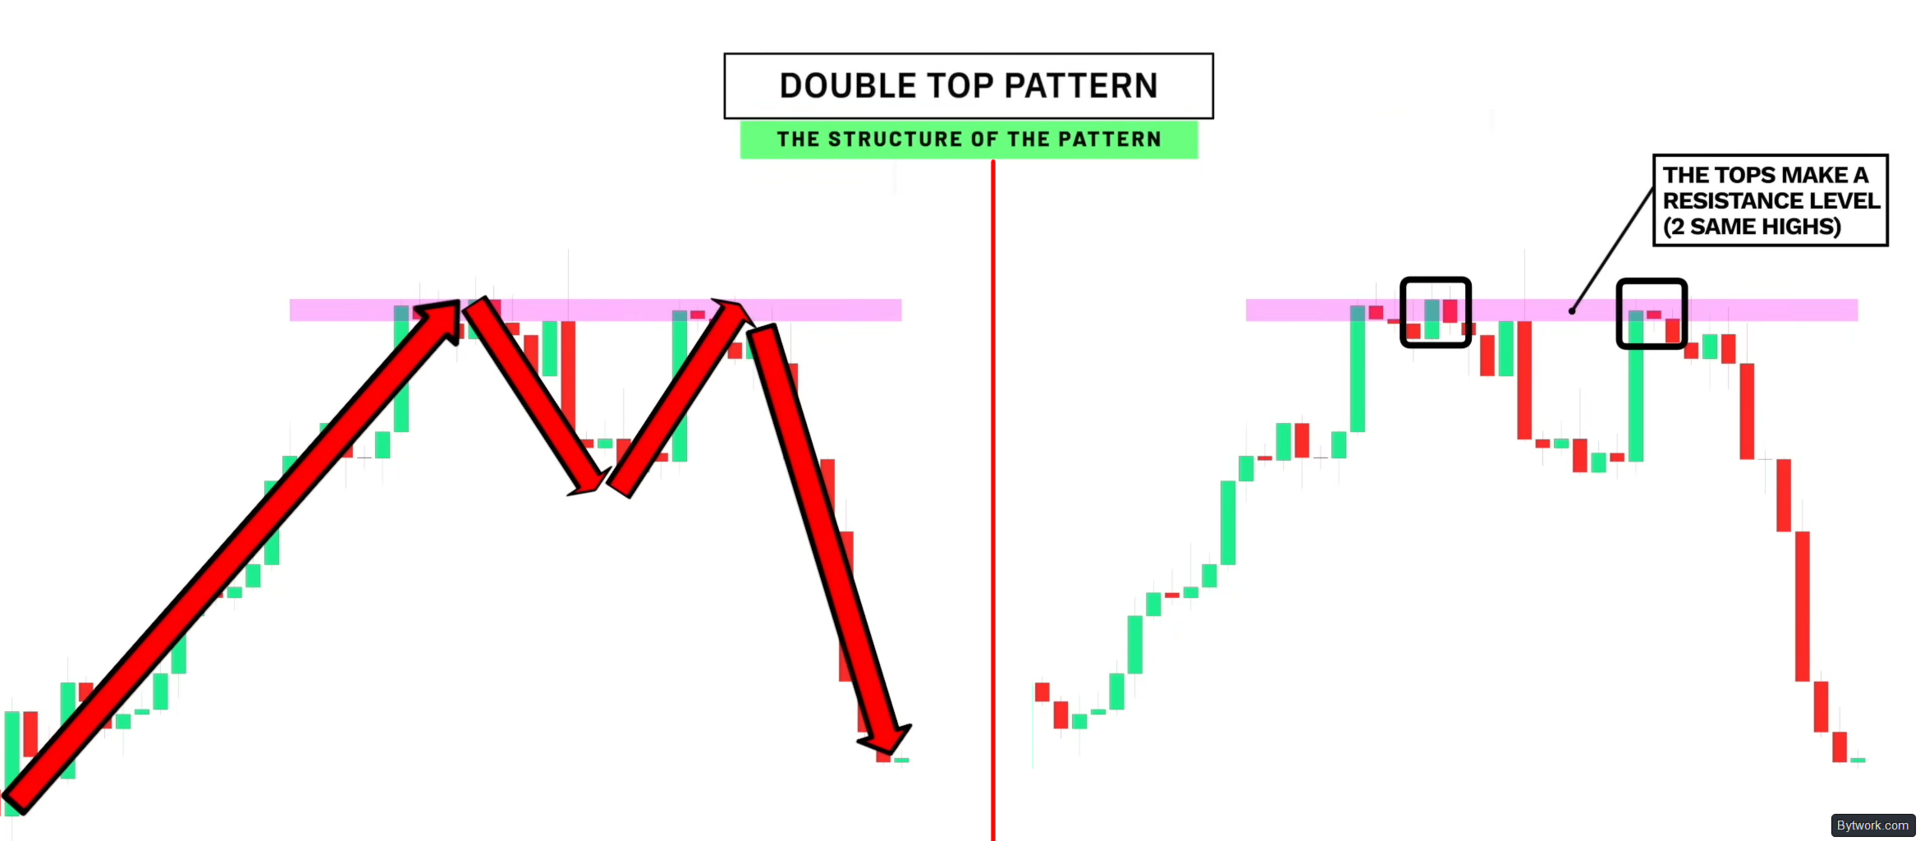
The fact that price does not break the high but simply returns to the same level indicates a loss of momentum in both the uptrend and among buyers.
Double Bottom
In contrast, the double bottom pattern occurs in a downtrend when price tests the same low twice.
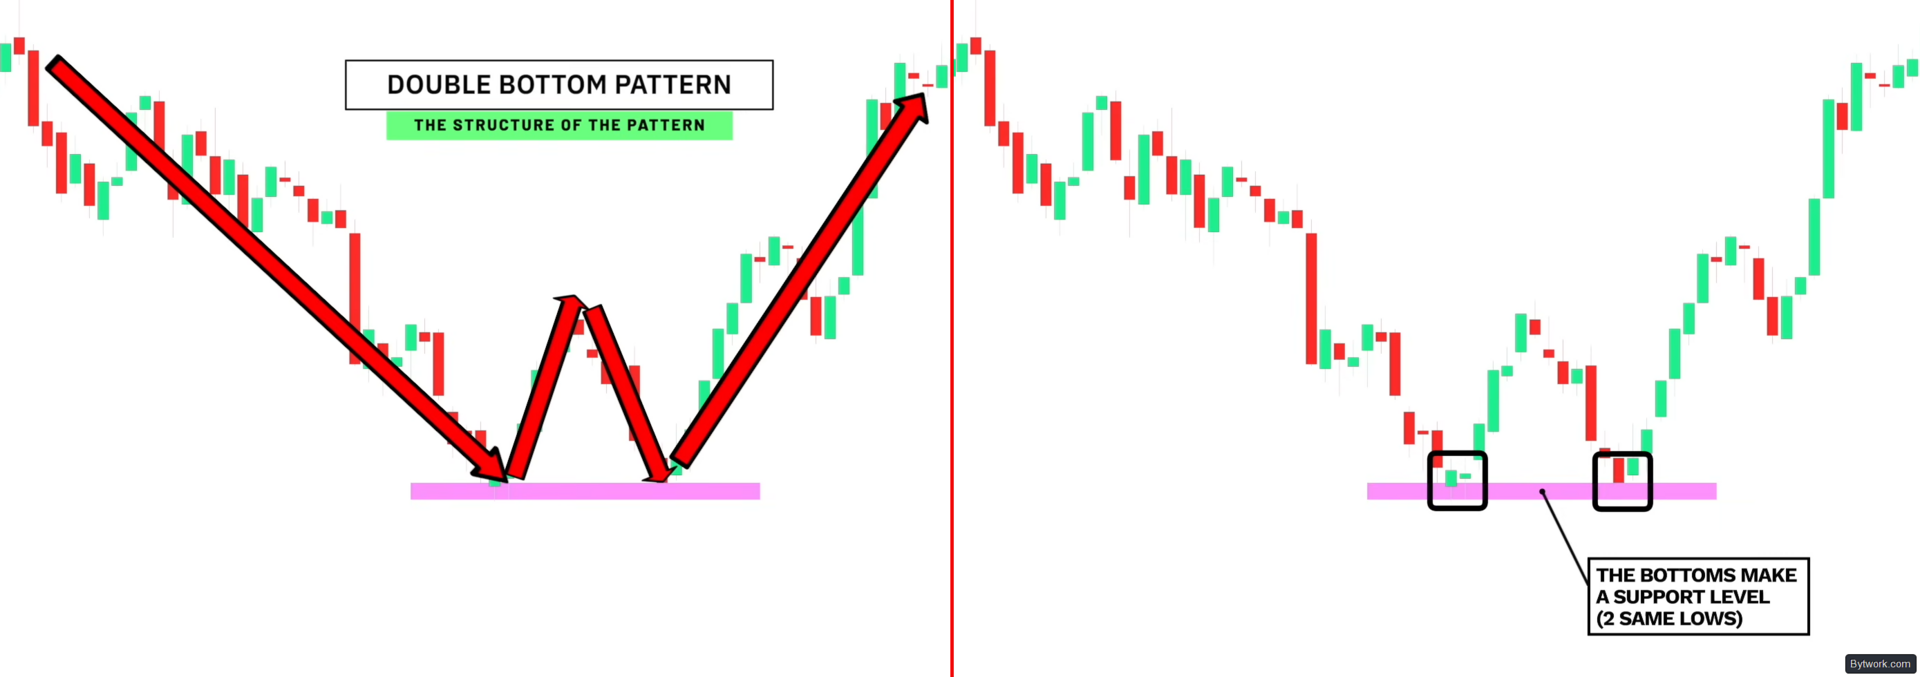
These troughs create a support level, and the inability to break the low indicates weakness among sellers and waning downward momentum.
Ways to Trade These Patterns
There are classic and aggressive approaches to trading these patterns:
Classic entries:
- Breakout of the neckline – entry when the candle closes beyond the level to avoid false breakouts.
- Retest – entry on a bounce from the broken level (better price, but risk of missing the move).
- Build-up – breakout of consolidation near the neckline – high probability, tight stop.

Aggressive entries:
- At the second extreme – reversal candlestick patterns (Pinbar, Engulfing) for entry with a minimal stop and 1:6+ potential.
- Termination zone – between the maximum wick and the body of the first top. Entry on the first bearish candle.
- False breakout of the first peak – the second top takes liquidity, then a sharp reversal (BOS).
To filter out noise, it is important to read price action. Unlike Japanese candlesticks with their false shadows, Heikin Ashi smooths the chart, showing the true strength of the trend.
Let's take a closer look at these methods.
1. Entry on Breakout of the Neckline
The first method is entry on the breakout of the neckline. For a double top, after the pattern forms, we draw the neckline between the reversal points. When price breaks this line and makes a lower low, the trend change is confirmed, and we open a short position on the breakout.

For a double bottom, it's the opposite. After the neckline breakout and the formation of a higher high, the reversal from downtrend to uptrend is considered confirmed, and we enter a long position.
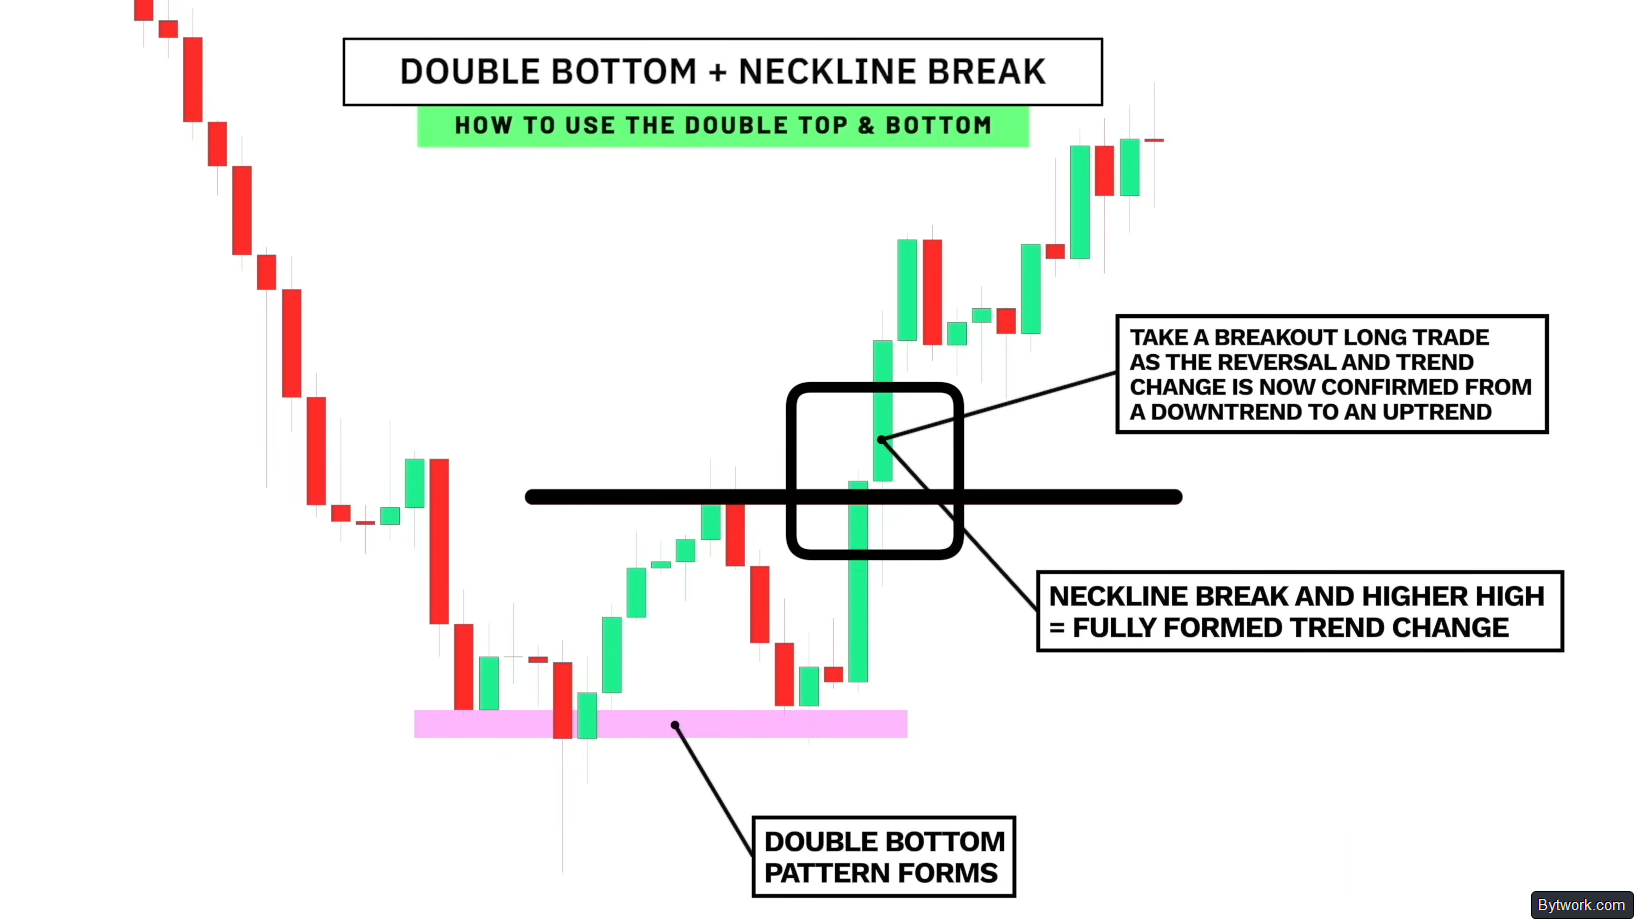
A true breakout is often accompanied by a significant increase in trading volume. This confirms the determination of sellers or buyers. Breakout of the trendline and Change of Character (CHoCH) – the final sign of a trend change.
2. Waiting for a Pullback
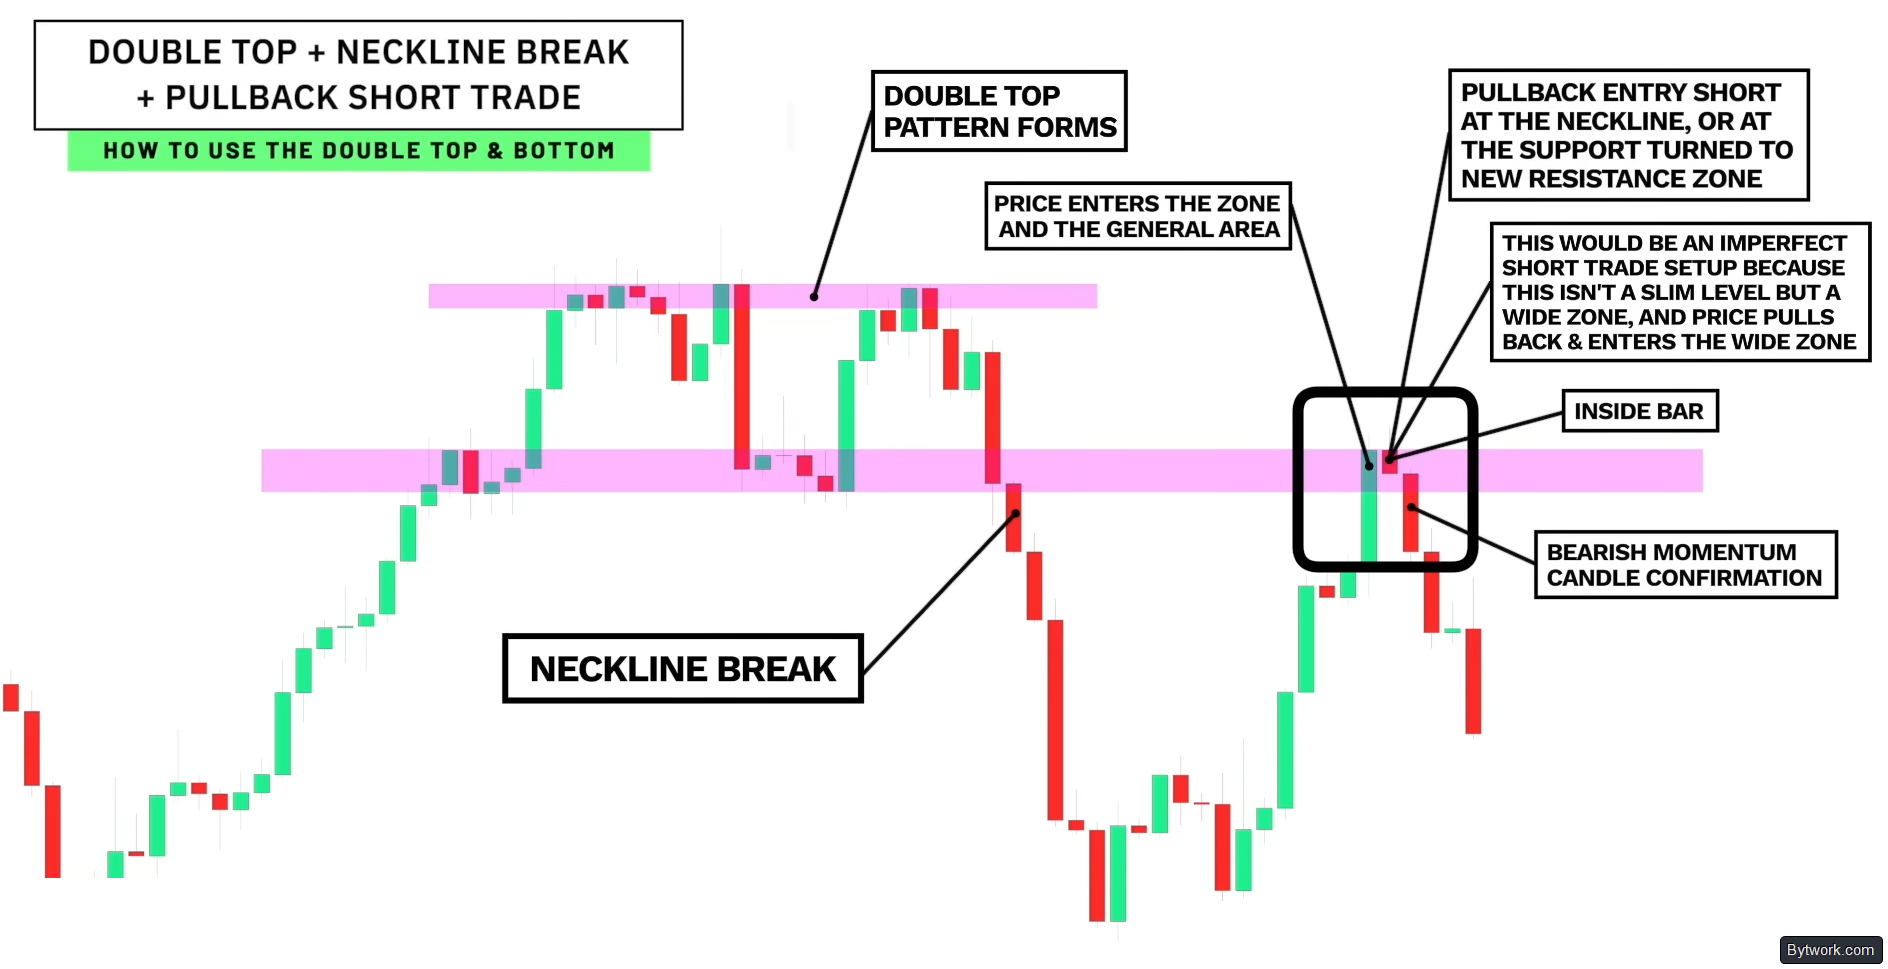
Wait for a pullback after the neckline breakout. Do not enter immediately – after the neckline breakout in a double top, wait for price to return to it – now it is resistance. Upon confirmation (e.g., an inside bar and then a bearish impulse candle), enter.
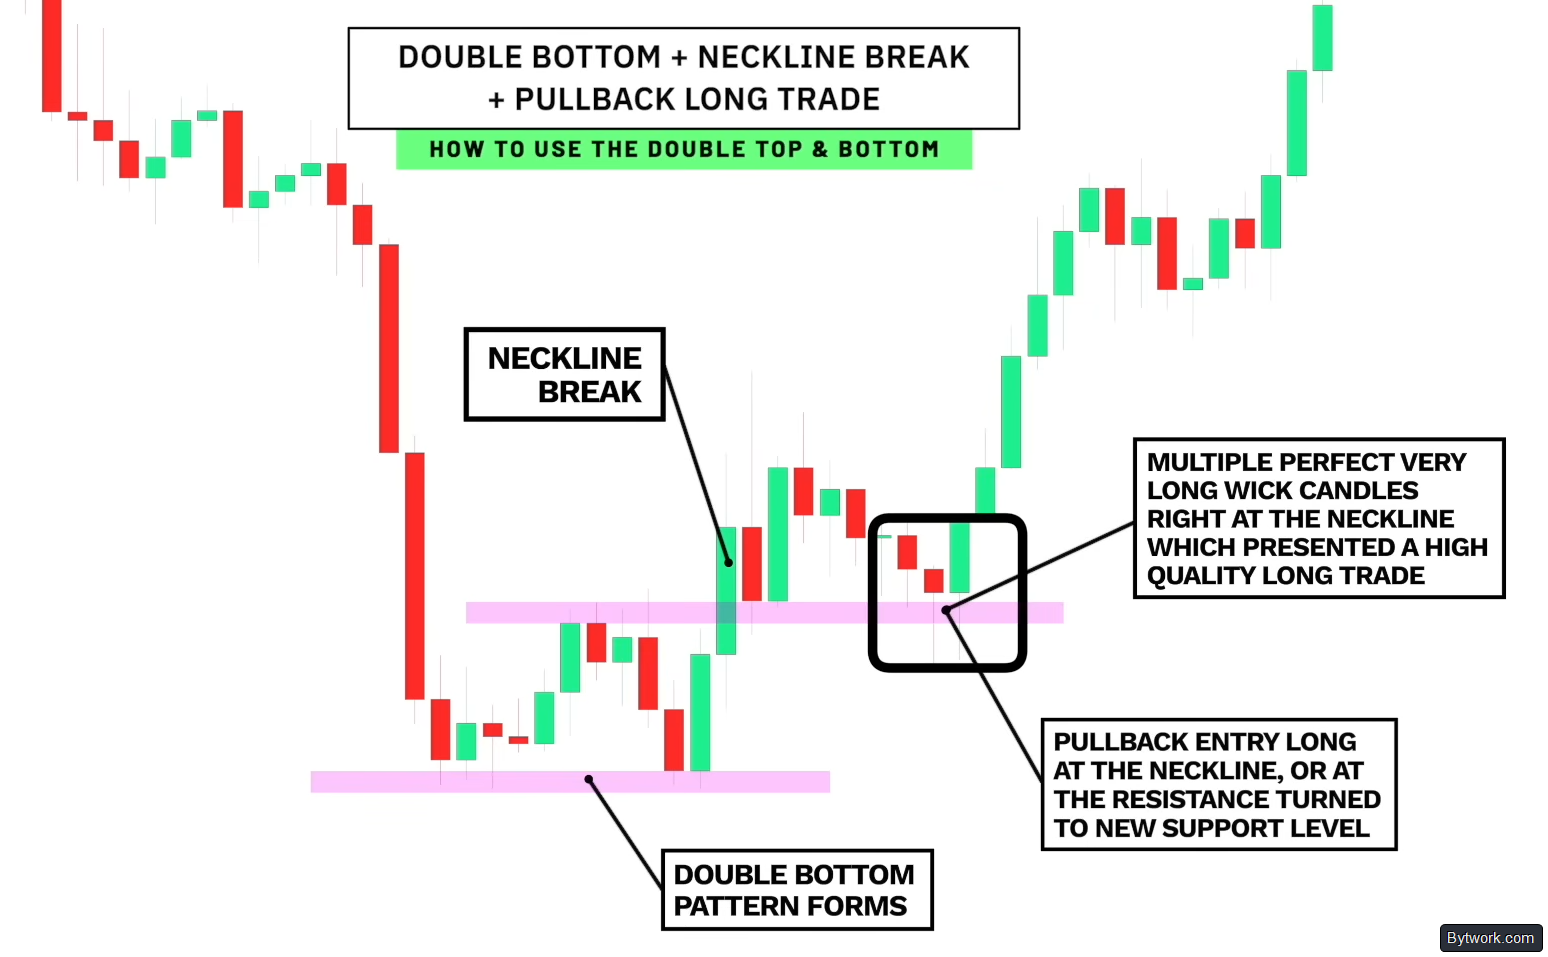
For a double bottom, it's similar. After the neckline breakout, you can enter on a pullback to it, where it now serves as support. If you see several bullish candles right at the neckline, that gives a quality buy signal. The example below shows a clear double bottom and a non-ideal pullback entry that still worked.
And in this example below, after the double bottom, the pullback to the neckline was accompanied by a long upper wick, a candle color change, and a bullish impulse candle.

This signal was strengthened by the fact that the right shoulder of an inverted Head and Shoulders pattern was also forming here, making such a trade an A+ class trade.
3. Combination with Key Levels
For a long position – identify a key support level from previous reversals. When price returns to it and forms a double bottom, draw the neckline. Enter long after its breakout and the formation of a higher high.
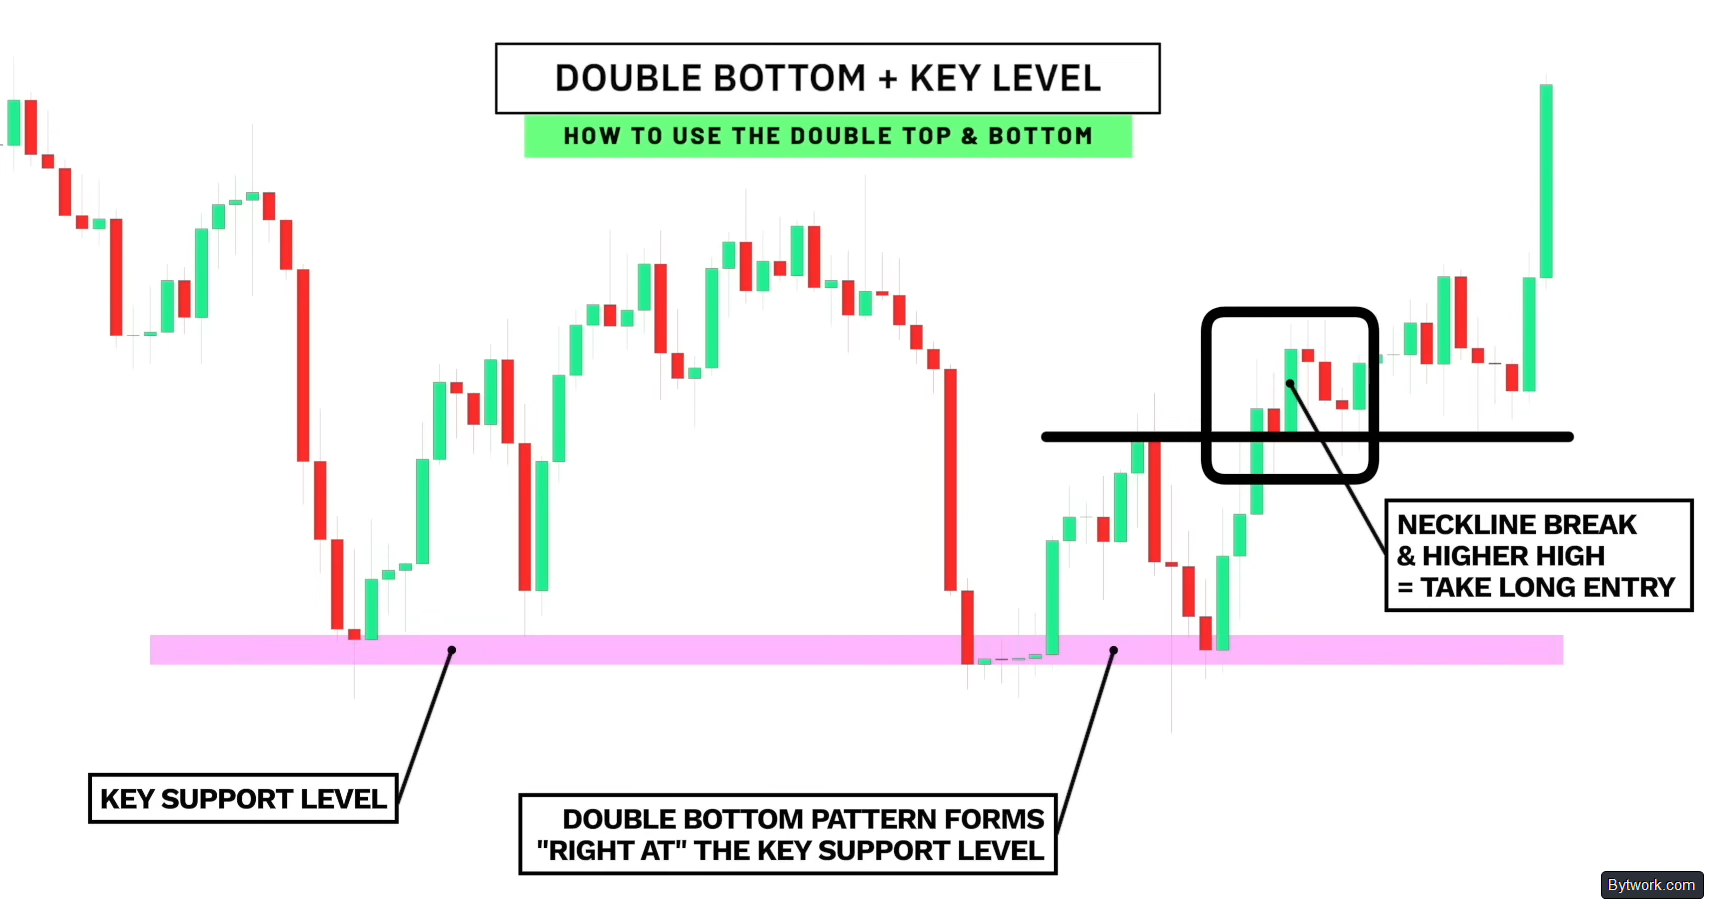
The trade becomes A+ class if the pattern is confirmed by Pivot Points, Fibonacci retracements, and liquidity zone analysis to protect against stop hunting.
For a short position – similarly. At a key resistance level when a double top forms. Enter short on the neckline breakout.
In both cases, different entry points are possible (on reversal, along the trendline, on neckline breakout).

The choice of entry here depends on your trading style.
4. Aggressive Early Entry
Let's consider an aggressive early entry at the second reversal point of the pattern. For example, with a double bottom at a strong support level, waiting for a breakout of a deep neckline may cause you to enter too late and miss a significant part of the move. Therefore, you can enter right at the second reversal point of the double bottom.
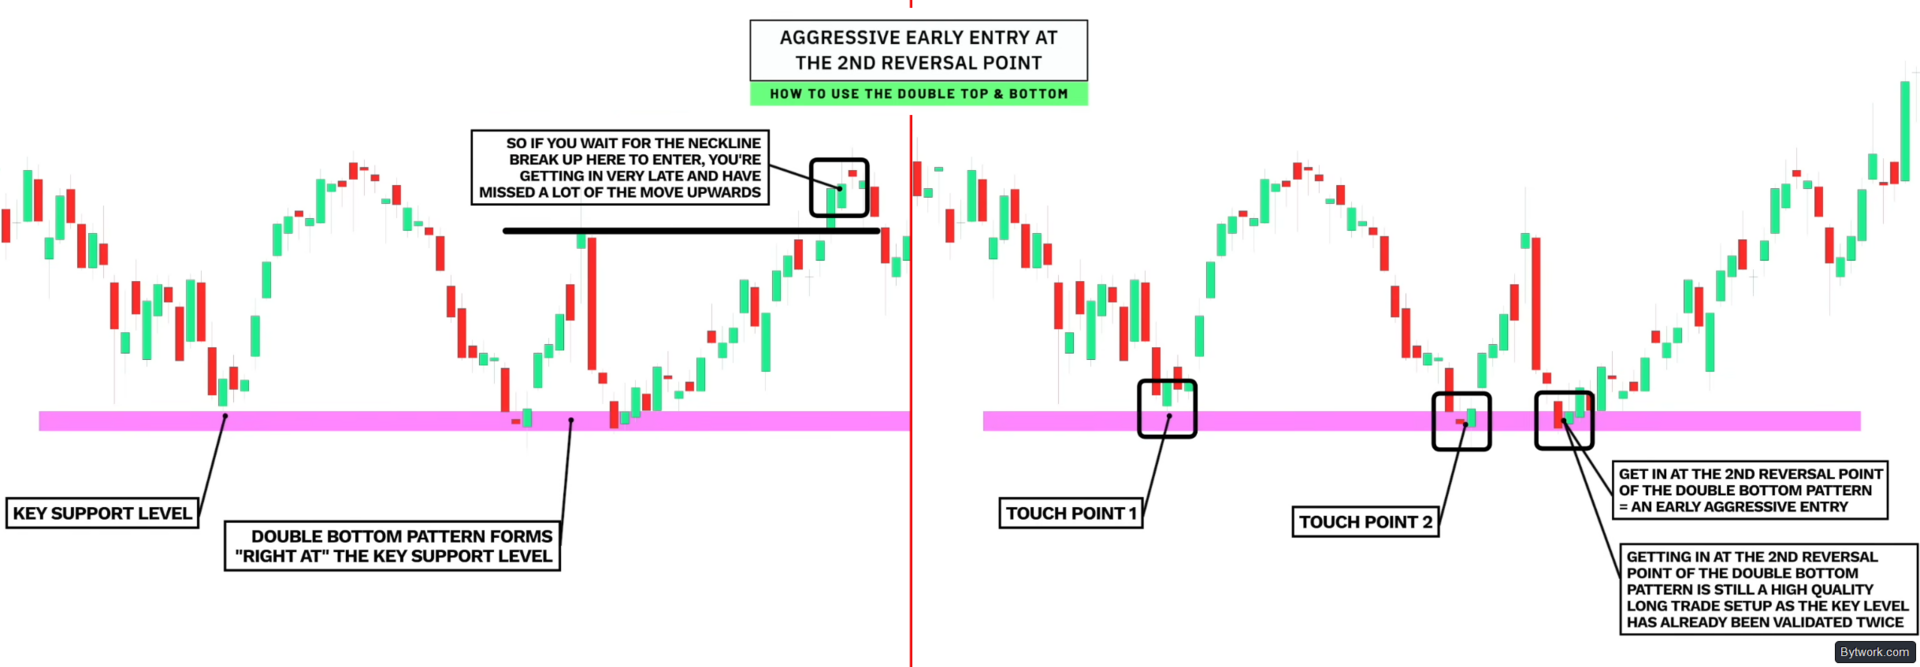
This is an aggressive early entry, but it remains quality if there are confirming price signals – candle color change, inside bar, long lower wick. All of these indicate level reaction and the presence of buyers.

Also, be sure to check intraday confirmation of trend change on lower timeframes before such an entry.
5. Searching for Patterns on Lower Timeframes
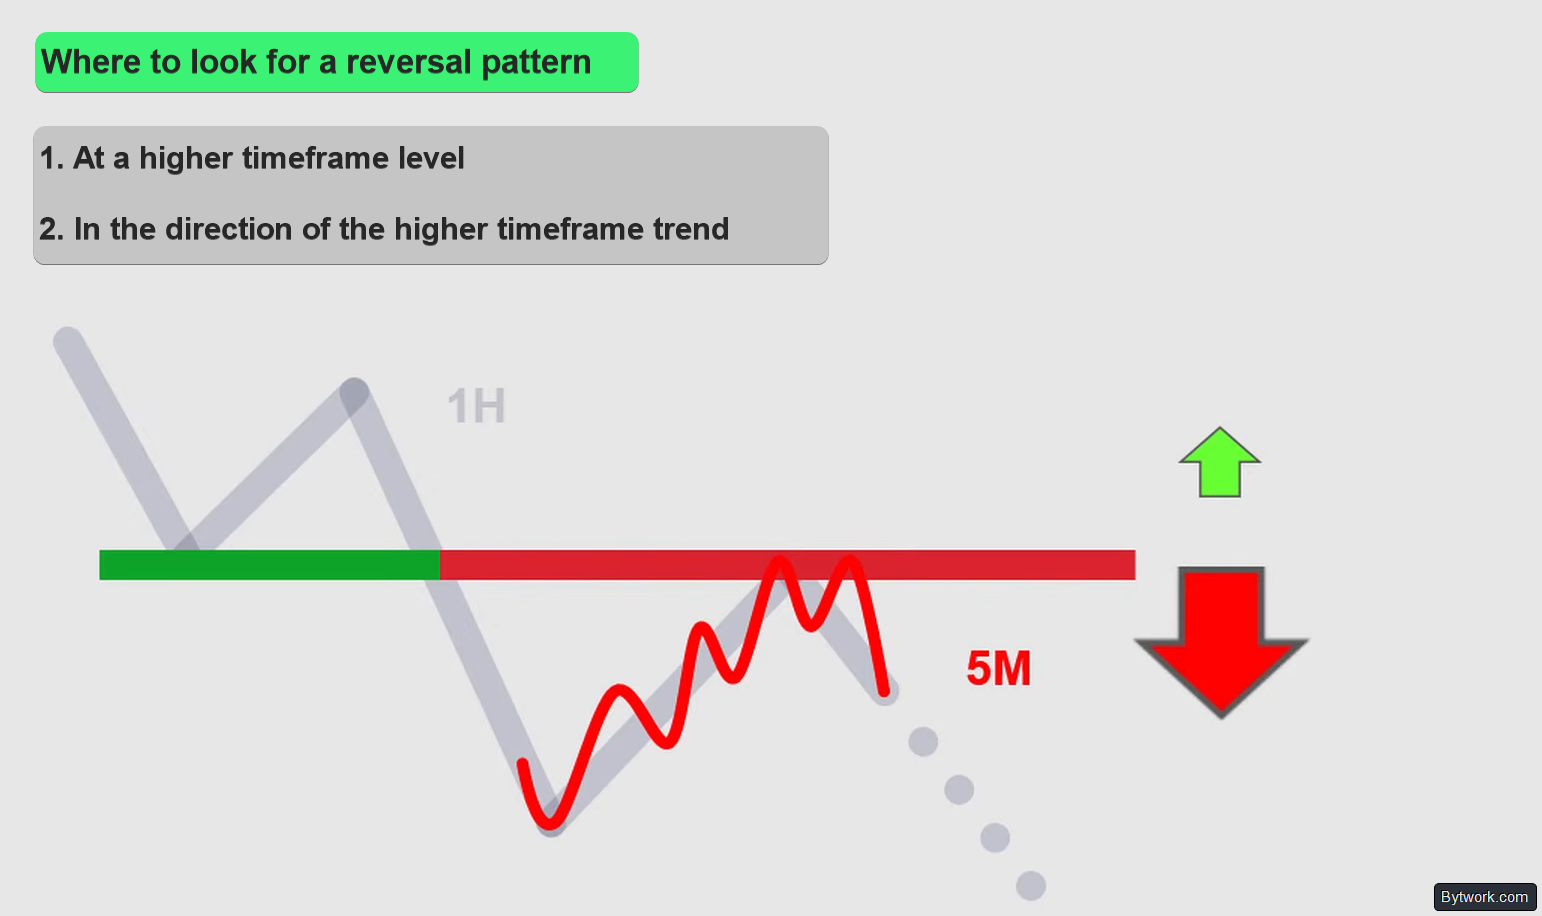
The fifth method is to look for candlestick patterns at a key level, and then inside those candles on a lower timeframe find a double top or double bottom. For example, on a higher timeframe you see a downtrend, a pullback to a key level, and the formation of long upper wicks. This gives a hint for a short trade. But do not rush! Go to a lower timeframe and check if there is a trend change there.

If a double top has formed on the lower timeframe and its neckline has been broken, the trend change is confirmed, and you can look for an entry point for a short position.
Triple Tops and Triple Bottoms
Let's move on to triple top and triple bottom patterns. They work similarly. 3 reversal points form a resistance or support level. A neckline breakout confirms the reversal and gives an entry signal.

In the triple bottom below, buyers defend the level twice, and on the third time their confidence (and the volume of accumulated position) becomes the decisive factor for the reversal. Triple formations occur less frequently than double ones, but they possess several times more power.
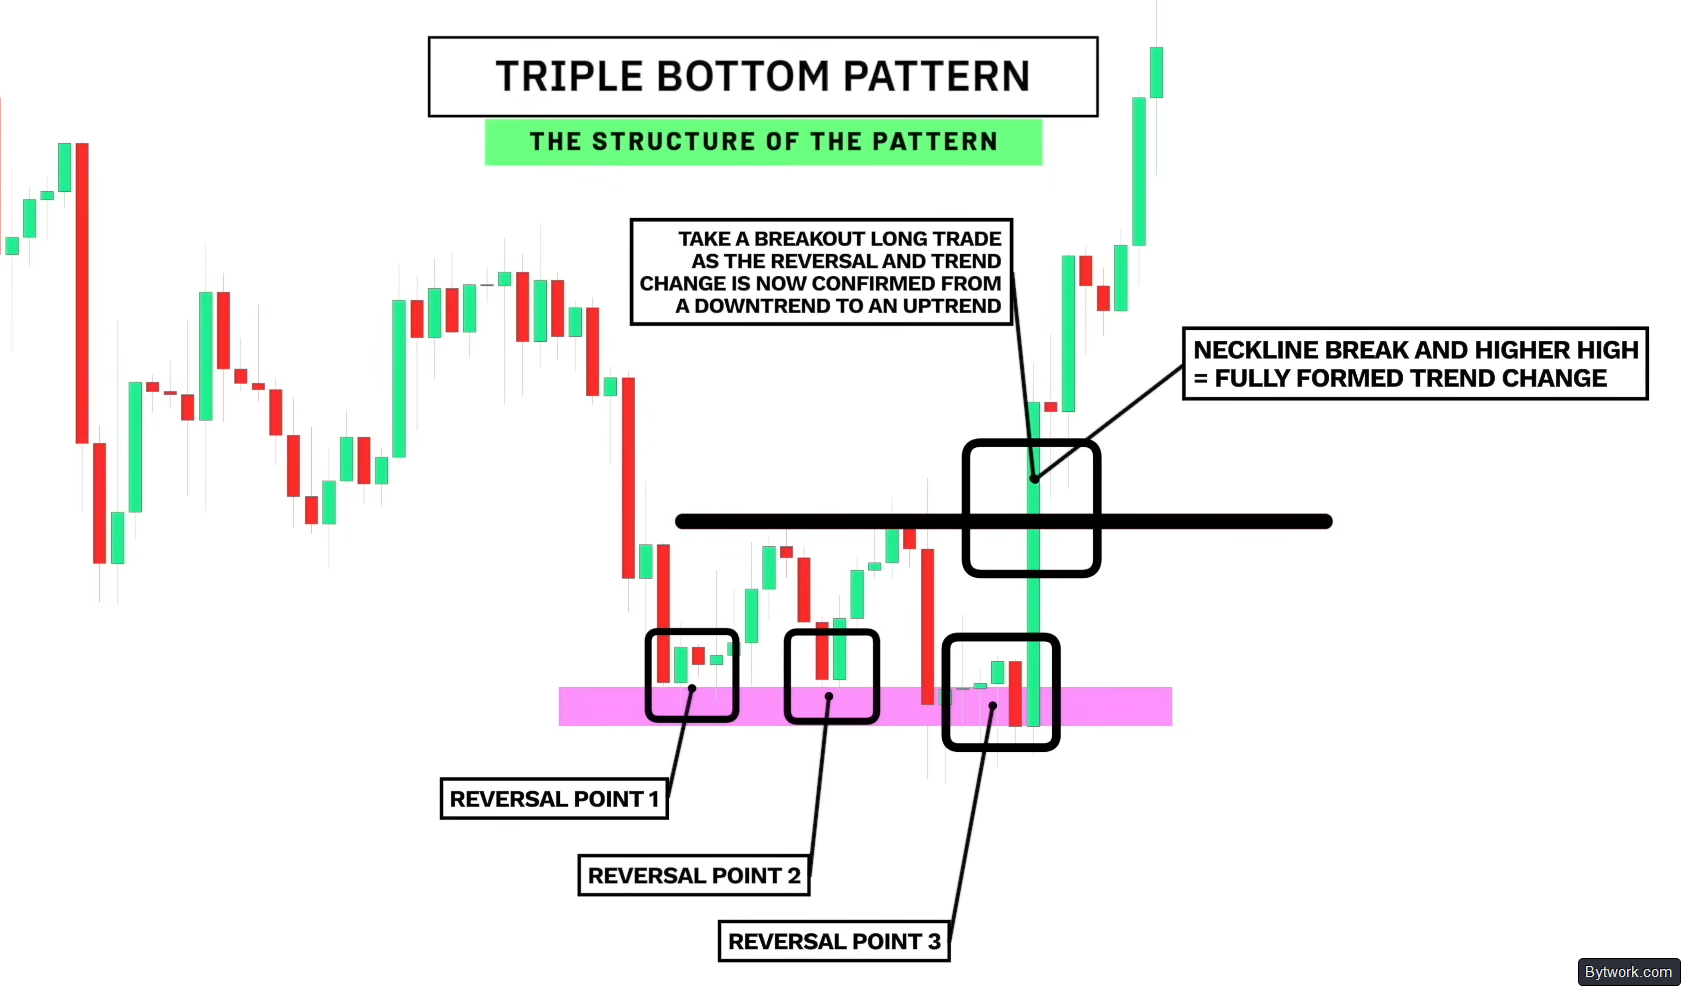
In the example below, we see price forming a triple bottom at a key level, and after the neckline breakout you can enter either on the breakout itself or wait for a pullback for greater reliability.

In the example below, a triple bottom formed at a strong support level. Looking inside the third reversal point on the 1-hour timeframe, one could notice a trend change (higher lows and highs, breakout of the trendline). This gave an early buy signal.

To complete the picture, let's now look at all the drawbacks of the system.
What Are the Drawbacks and Risks of Trading These Patterns?
The formation of the second top often occurs during a strong impulse. If at that moment price is far from heavy moving averages (e.g., EMA 150 or EMA 365), opening a trade on a breakout in the continuation of the move is a mathematical mistake. The probability of a return to the average price is maximal at that moment. Therefore, cross-check moving averages with liquidation maps – they show clusters of stops that the market may sweep before reversing.
We summarize other drawbacks in the table below:
|
Risk |
Essence |
|
Low Expectancy |
Classic gives 1:1 – with a 50% win rate, trading will break even. Long breakout candles increase the stop. Price often reverses 90% of the way to the target. |
|
Liquidity Traps |
Large players take out stops beyond equal extremes. The second top breaks above the first (false breakout) to stop out shorts and lure buyers. Patterns in thin air (without historical levels) are market noise. |
|
Technical Risks |
A double top can become a triple. A pattern formed quickly against a strong trend is ignored. In a strong trend, price moves without a retest. This leads to FOMO entries at poor prices. |
|
Lower Timeframes |
Below H1, patterns are more often false (market noise, no significant levels). Traders mistake ordinary corrections for the pattern. |
|
Confirmation Issues |
Breakout on low volume = lack of interest from big players, high risk of failure. RSI/MACD divergence often lags. |
|
Conclusion |
Patterns are too obvious – 90% of retail traders see them, so they become a manipulation tool for institutional capital. |
When the neckline of a Double Top is broken, buy stops are triggered. On the crypto market, this causes a chain reaction of automatic market sell orders (cascade of liquidations). Price instantly shoots far below the entry point, and the trader suffers severe slippage. Entry occurs at the worst price, breaking any initial calculation.
To avoid mistaking a correction for a reversal, check the double top according to Elliott – the completion of the second wave does not give an entry signal.
Conclusion
For trading patterns, it is not enough just to see them. It is important to understand market psychology and practice in real time. Criticism of technical analysis often comes from those who cannot explain the logic of patterns. Now you know that logic.
Only regular practice of reading charts in real time, searching for additional confirming signals, and mandatory consideration of the higher timeframe context will help you avoid market traps.
Below are 3 bonus secrets, verified through experience:
- Secret #1 – position of extremes. The strength of the reversal is confirmed by a failure to reach the level. For a Double Top, the ideal is the second peak lower than the first (strength of sellers). For a Double Bottom, the second bottom higher than the first (early buying).
- Secret #2 – MACD divergence. If price updates extremes or tests them exactly, while the MACD indicator shows opposite dynamics (momentum fading) – this is a strong reversal signal.
- Secret #3 – leading RSI. Draw a horizontal line on the RSI at the point where the neckline forms. If the indicator breaks this line before price breaks the actual neckline, it gives a leading entry signal.
In summary, the combined use of all 3 conditions – correct pattern shape, MACD divergence, and leading RSI breakout – turns a standard double top or bottom into a high-probability trading signal.
Afterword: we have been trading since 2018 and have tested hundreds of strategies and indicators. The trading section will help you choose a trading system! Your editor – Pavel Grachev for bytwork.com.
This material is for informational purposes only and does not constitute financial advice.

Now reading


In DePin, people create networks themselves, share traffic or capacity, and receive rewards in tokens from these projects.





The Ellipal firmware update enhances security (fixes vulnerabilities), adds support for new cryptocurrencies and tokens, and optimizes the interface and operational stability.


