Trend Reversal – Trading Secrets in a Simple Guide
- Don’t confuse a loss of momentum with a true trend reversal confirmation. A reversal is a fundamental change in price direction to the opposite side, confirmed by a breakout of protected extremes, exhaustion patterns, or a calculation of critical deviation in trend duration.
- The two-timeframe reversal strategy – the higher timeframe defines supply/demand zones, the lower timeframe (at least twice as fast) provides the reversal signal.
- Entry #1 – CHoCH + liquidity sweep. Price sweeps liquidity above the high, then breaks the last higher low at the supply level on the higher timeframe.
- Entry #2 – inversion imbalance (FVG). Place a limit sell order at the start of the FVG zone after price enters the supply zone, with a stop-loss above the zone.
- Attempting to enter before the reversal pattern fully forms leads to losses because the market continues moving by inertia against your position.
Read our full guide below, packed with real‑chart examples, to better understand reversals and strategies.
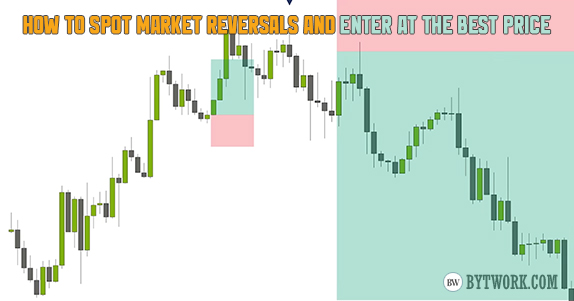
The most profitable opportunities in the market occur at reversal points, where risk is lower and potential profit is higher. In this guide, you will learn how to identify trends and reversals. We will examine a reversal trading strategy with a good risk-to-reward ratio, as well as profit trailing for strong moves without the pressure.
When a reversal occurs after a prolonged uptrend, a downtrend can be expected. But how do you know a reversal is near? What are the signs of a weakening trend? And how can you use these signs as a trading strategy to enter the market early and catch the reversal move? Read on to find out.
The Basics – An Ideal Trend and a Protected Low
A market reversal is a fundamental change in the direction of price movement to the opposite, confirmed by a break of key structural levels (protected extremes), the formation of exhaustion chart patterns, or the calculation of the critical standard deviation of the current trend’s duration.
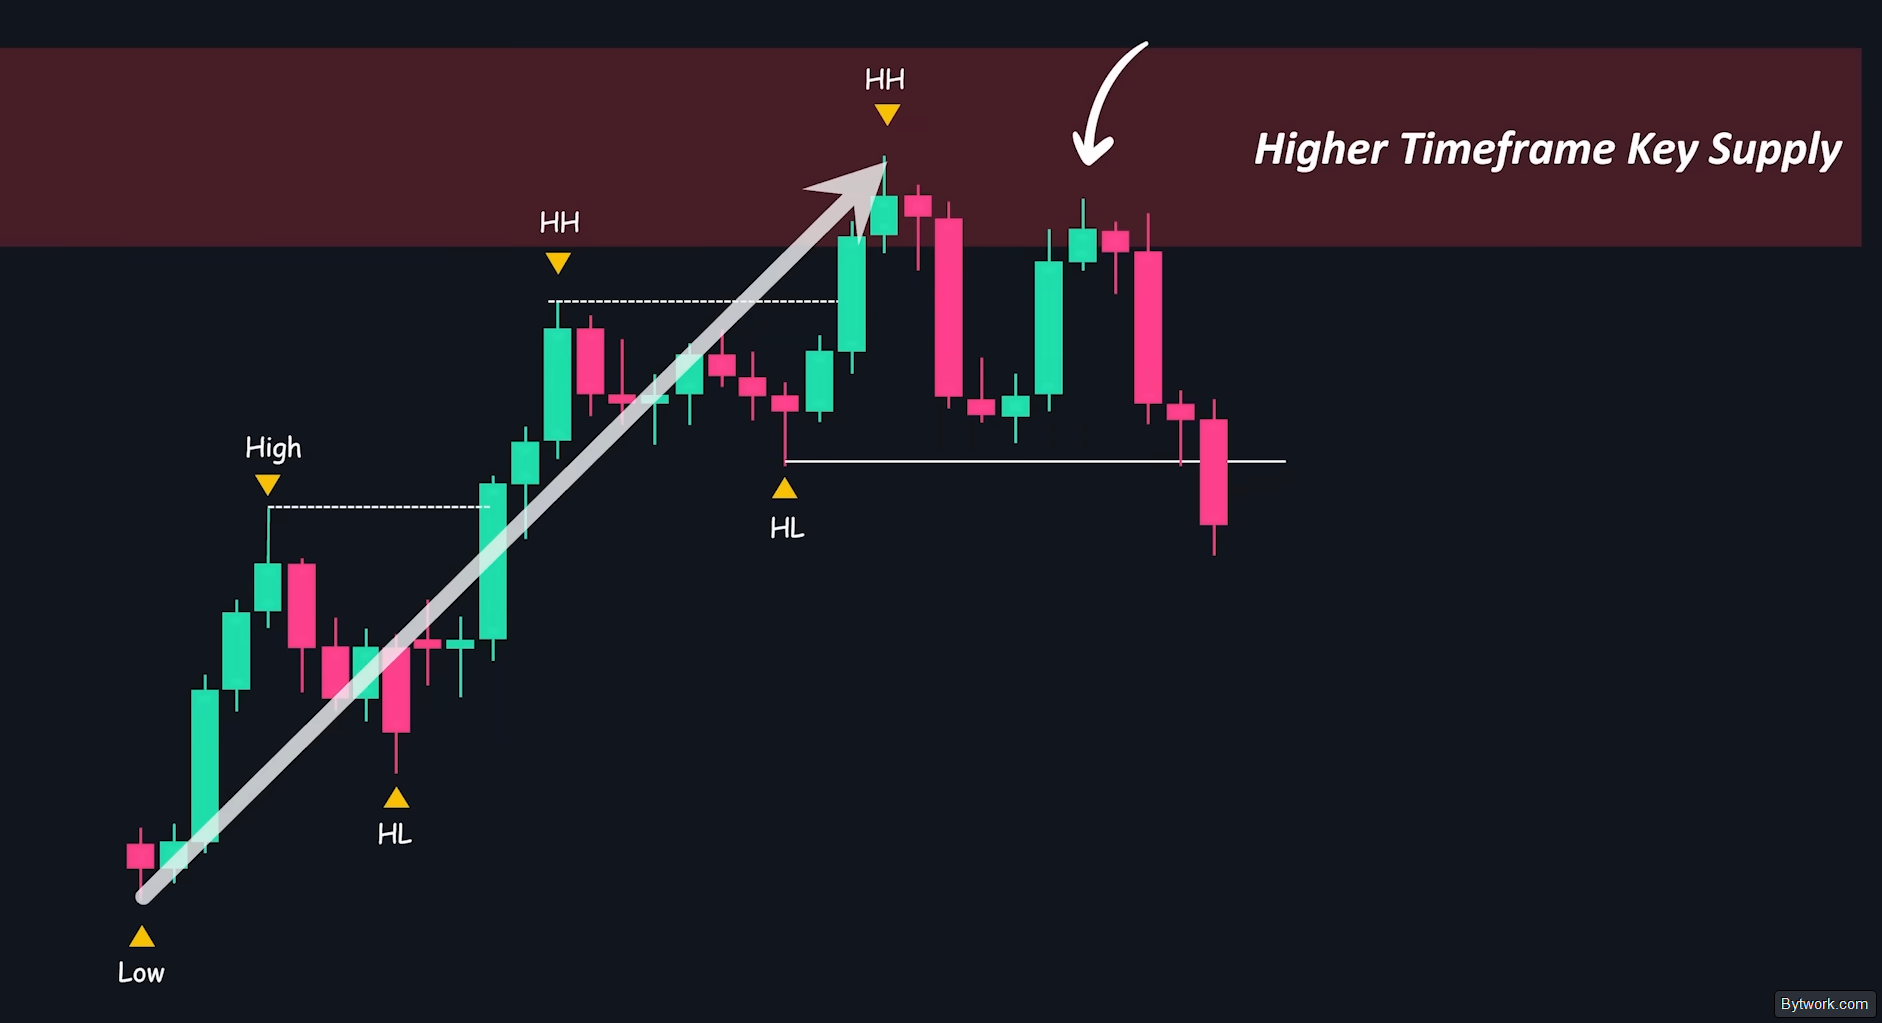
In an uptrend, the price updates its highs and lows. A break above the previous high confirms the trend. The lowest point of the move becomes the new low – a protected level.
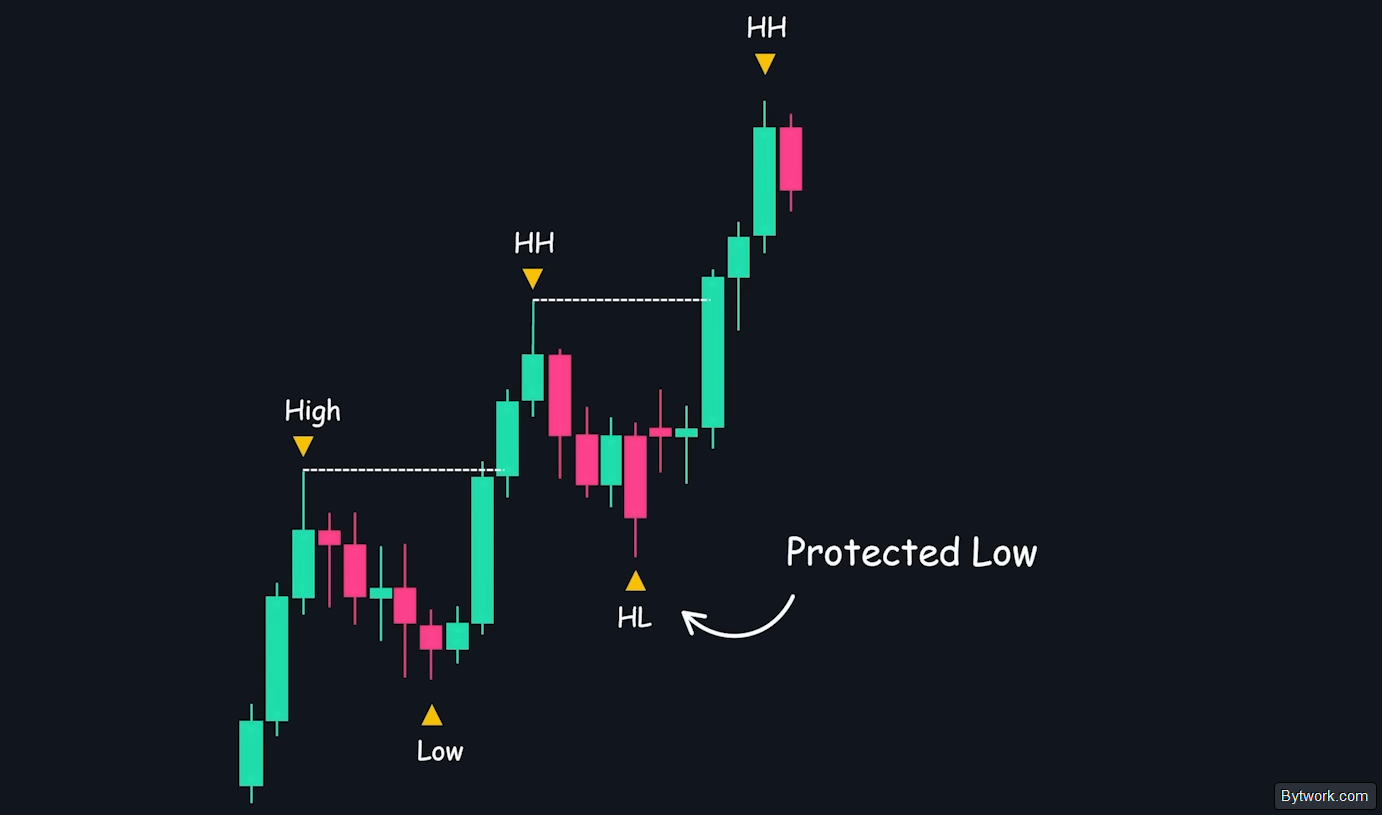
As long as the price is above this level, buyers control the market, and we only look for buys.
On a new breakout, we remain bullish as long as the price stays above the next protected low. This level is important: if the price returns to it, buyers will likely start defending it again.

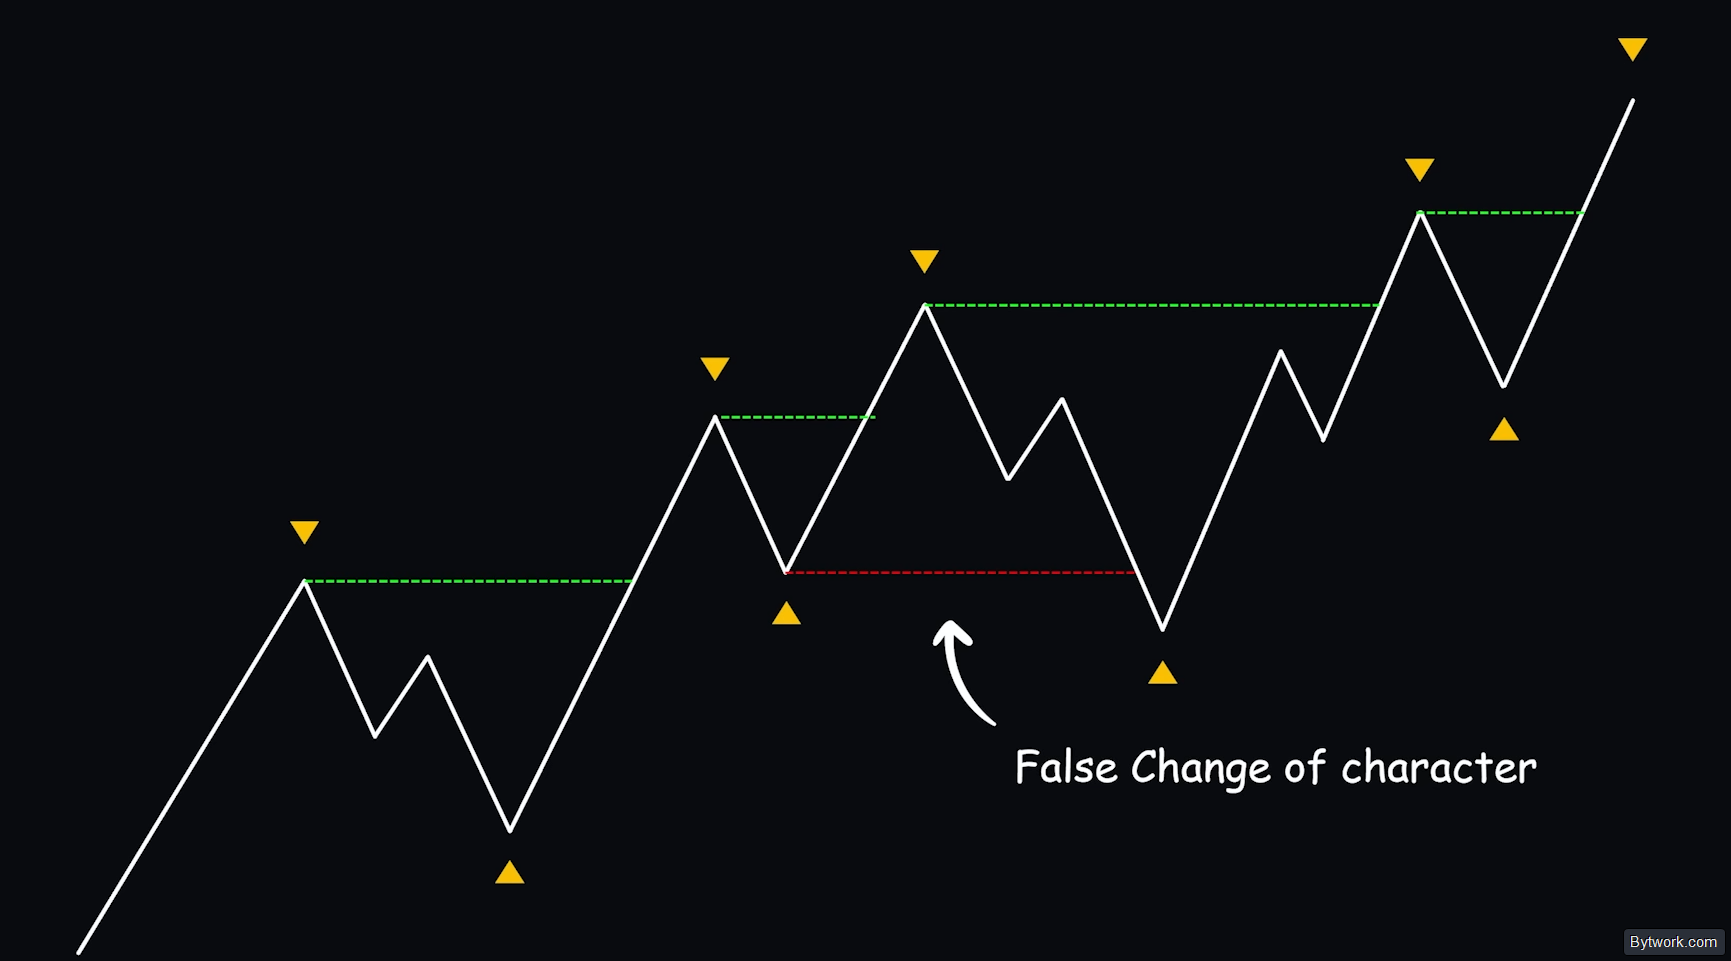
But what happens if the price cannot update the high and then breaks below the previous swing low? This shows that buyers no longer have control, and strong selling pressure has entered the market.
This change in behavior is known as a Change of Character (CHoCH) and can be an early signal of a potential reversal.
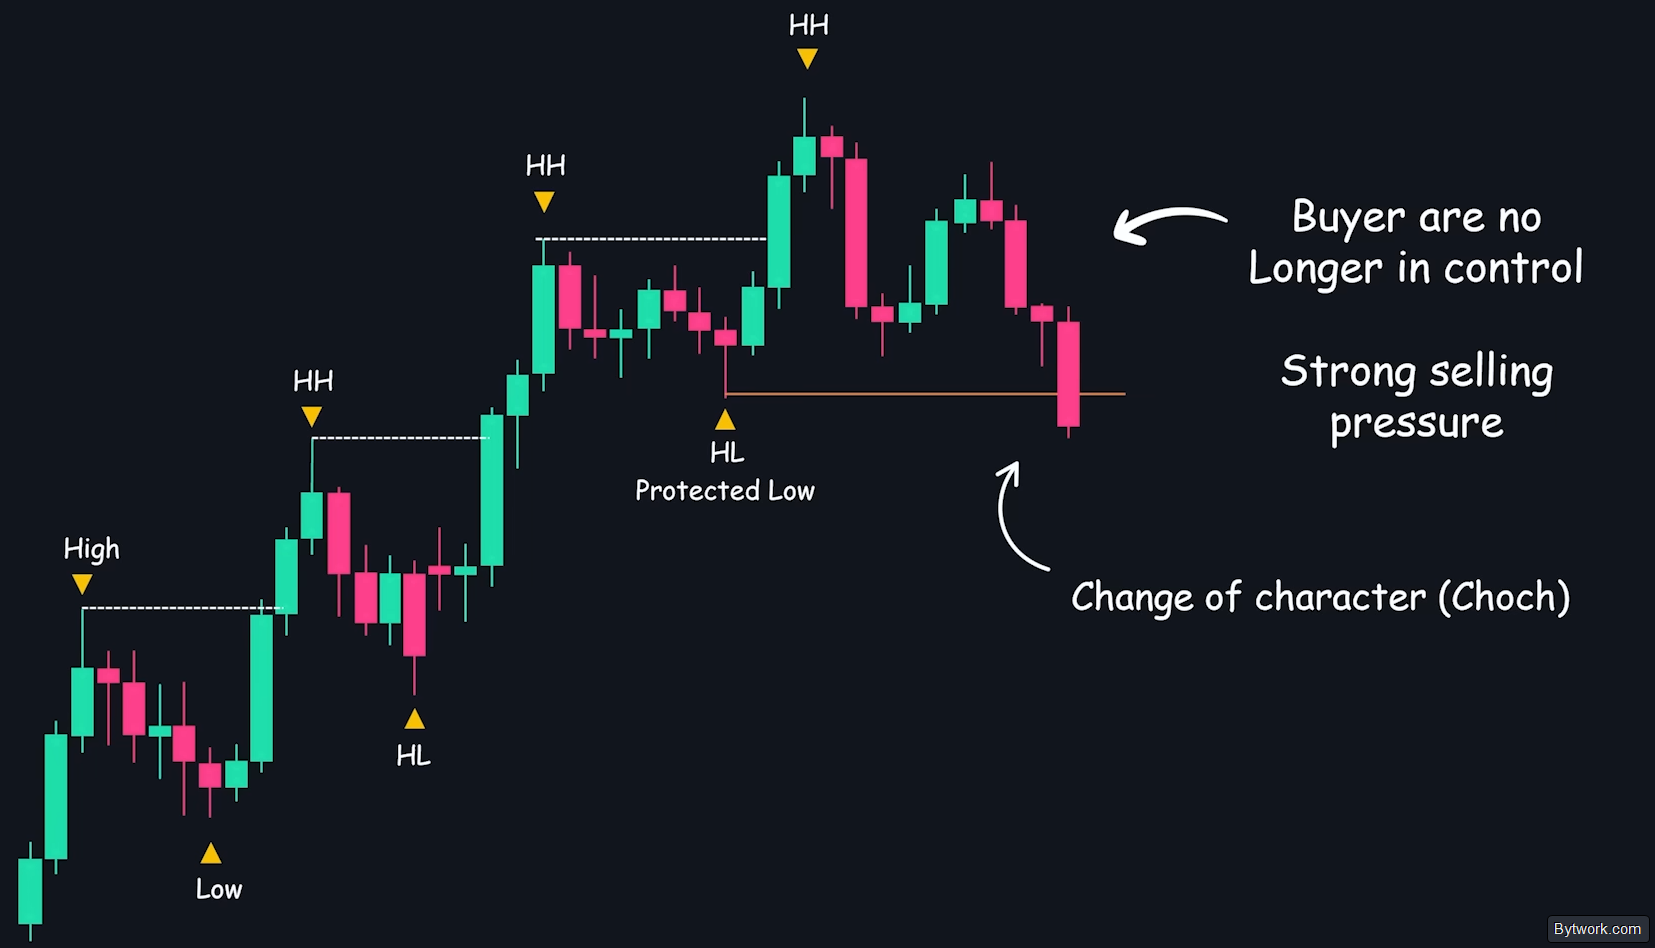
It suggests that the trend may be weakening and a move in the opposite direction will follow. This is clearly seen below:

However, in non‑ideal trend scenarios, the price may create a false Change of Character and continue rising. This often confuses traders who assume the uptrend is over and open short positions too early.
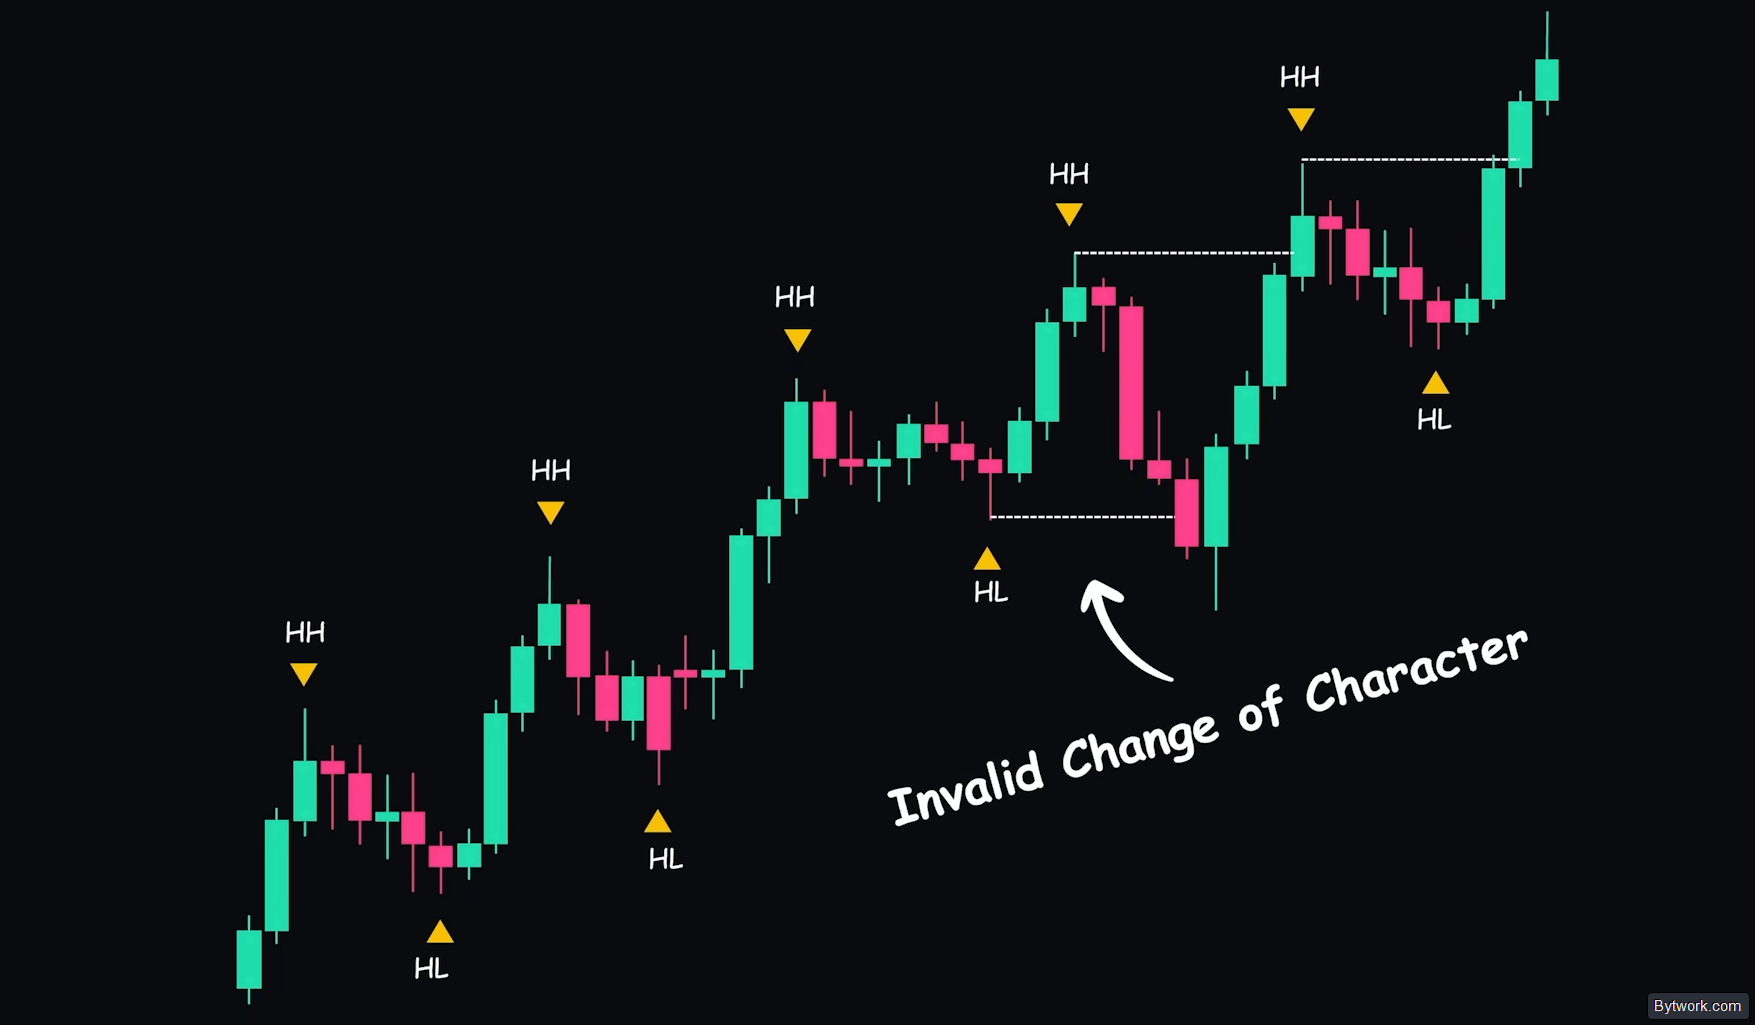
By studying many price patterns, one can notice that sometimes a Change of Character occurs not because of a trend reversal but due to other structural reasons, which we will discuss next.
Examples of Invalid Reversals
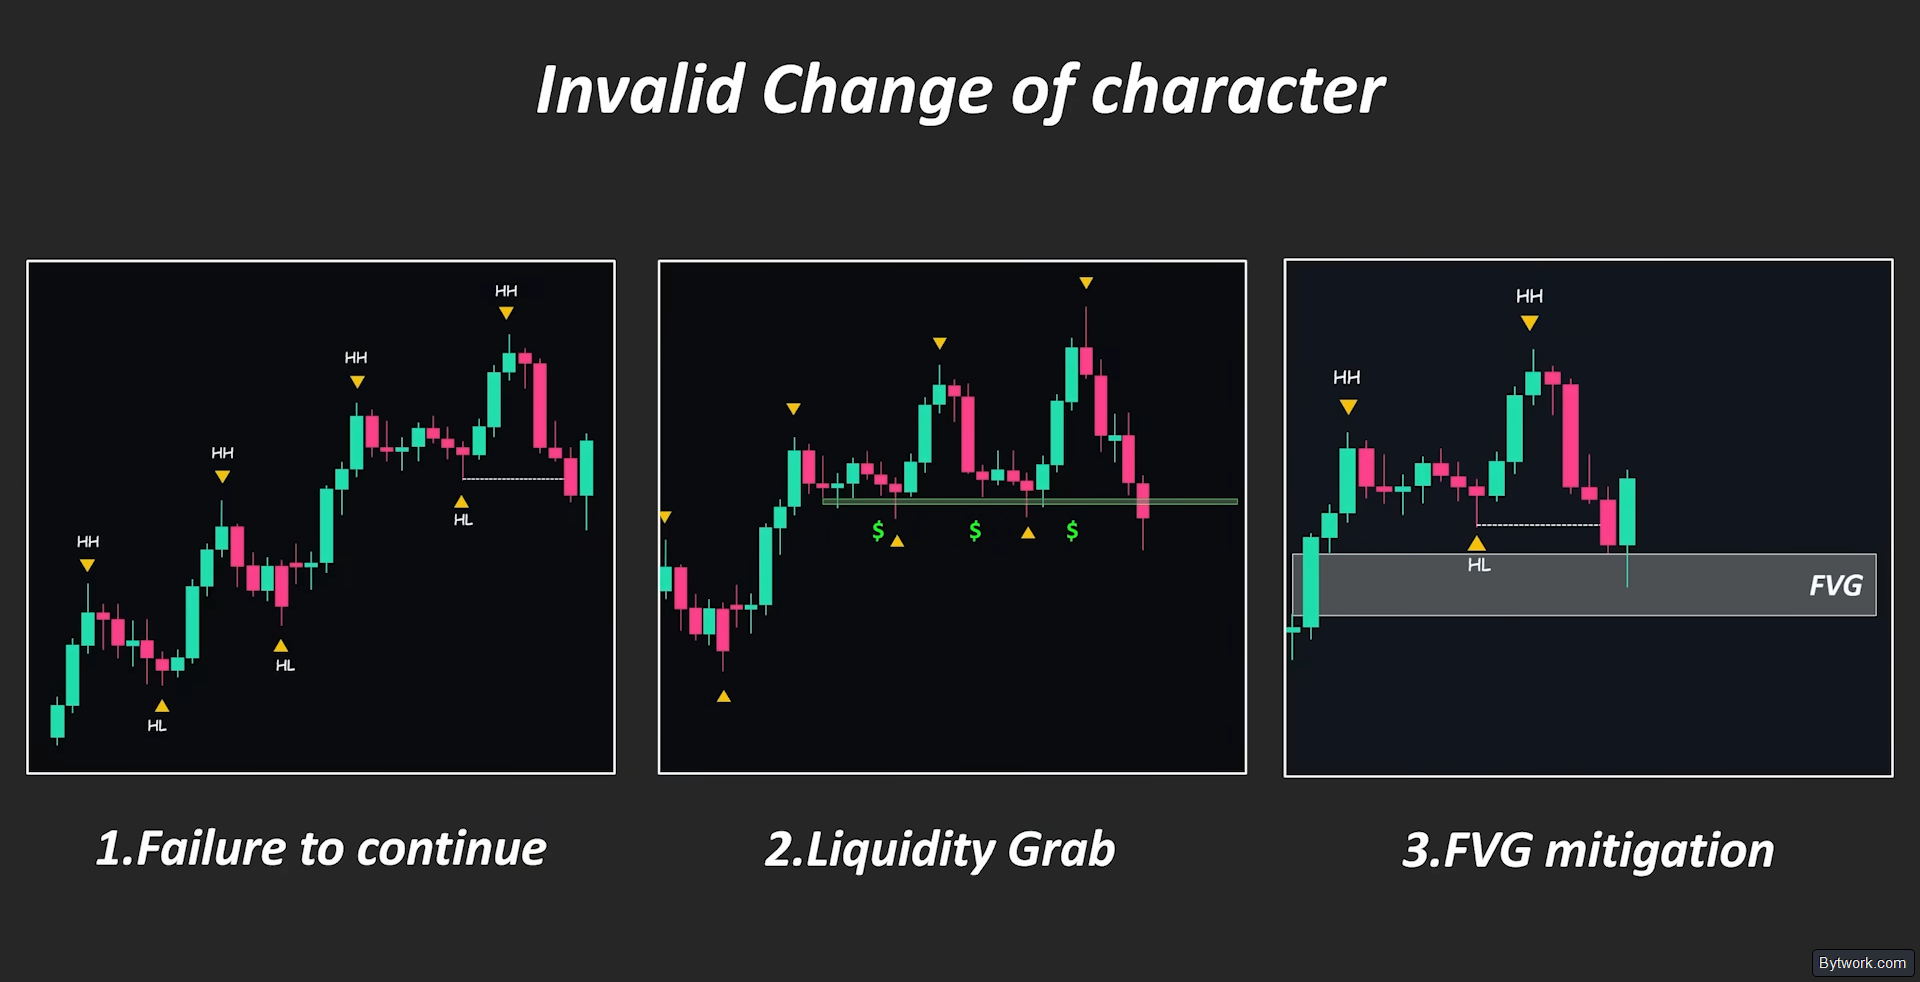
There are several types of invalid Change of Character.
First, a failure to follow through. If the price breaks a swing low but cannot continue moving down and quickly returns back, the Change of Character becomes weak or invalid. Especially if the price then breaks back above the previous high, it confirms that the market is still in a bullish trend.
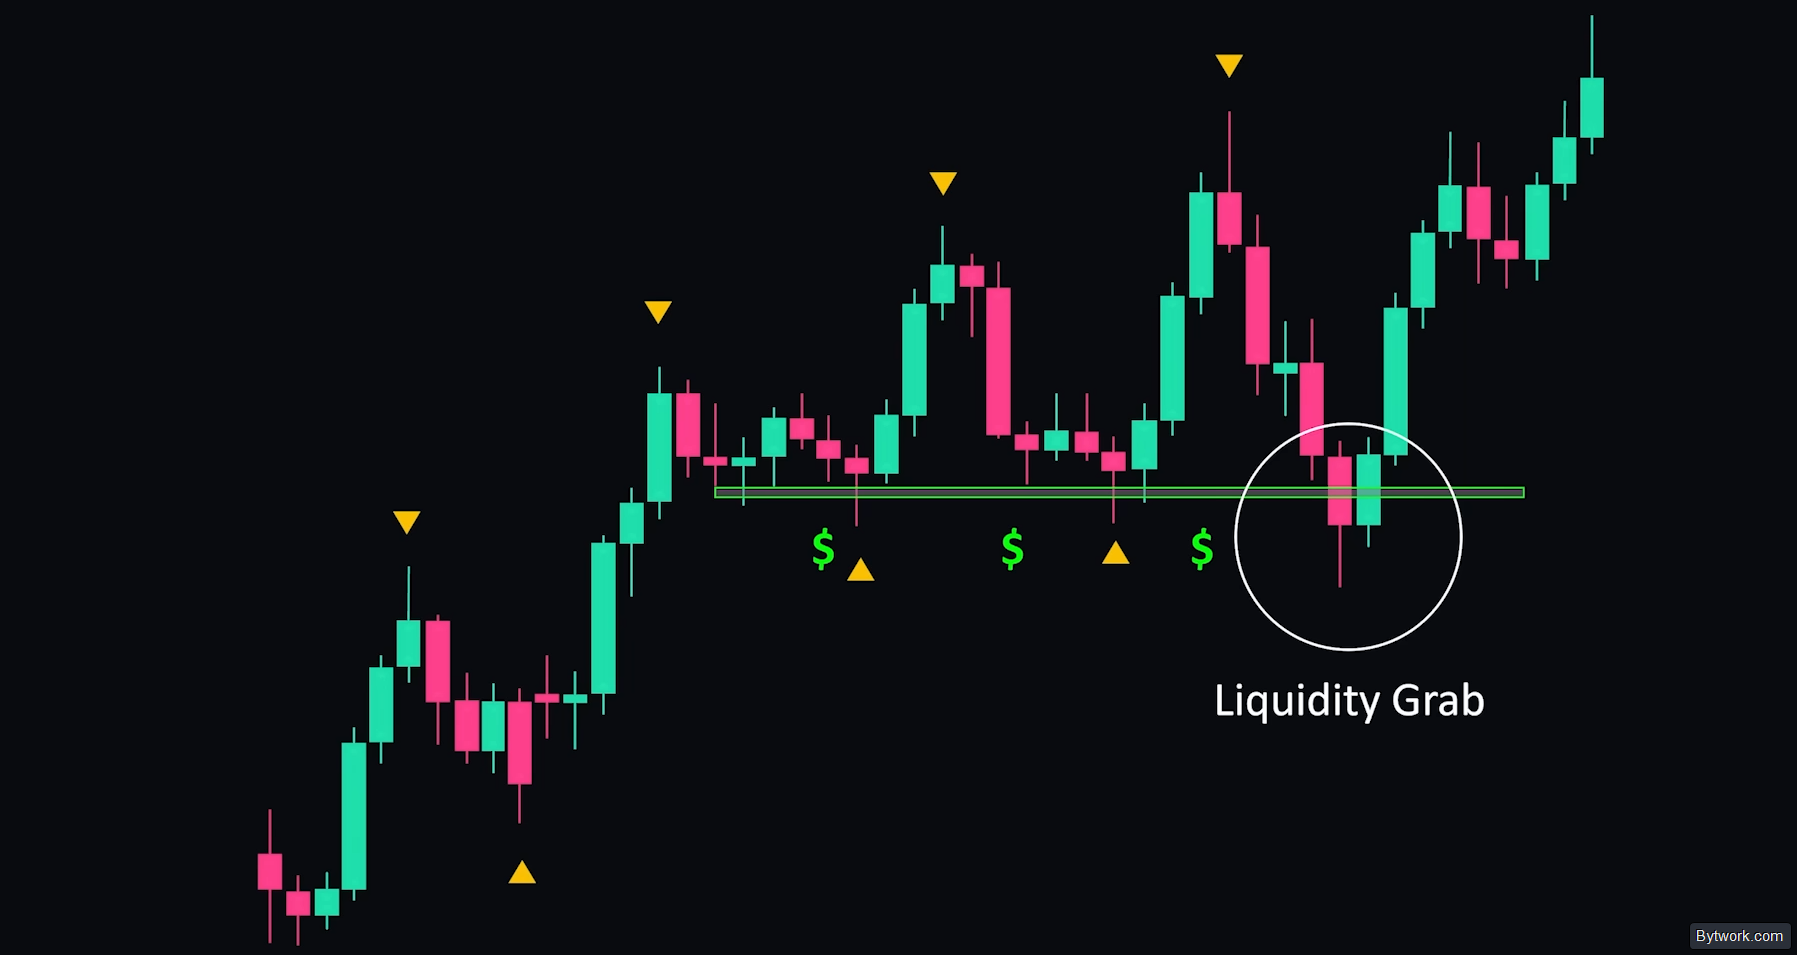
Second, a liquidity grab. If the swing low is in a liquidity zone, the price may briefly break it to grab liquidity and then quickly reverse. This is merely a false move to capture liquidity, not a real reversal. This makes the Change of Character invalid.
Third, look at imbalances. If there is a Fair Value Gap (FVG) below the swing low, the price may move down to fill or mitigate that gap and then continue rising.
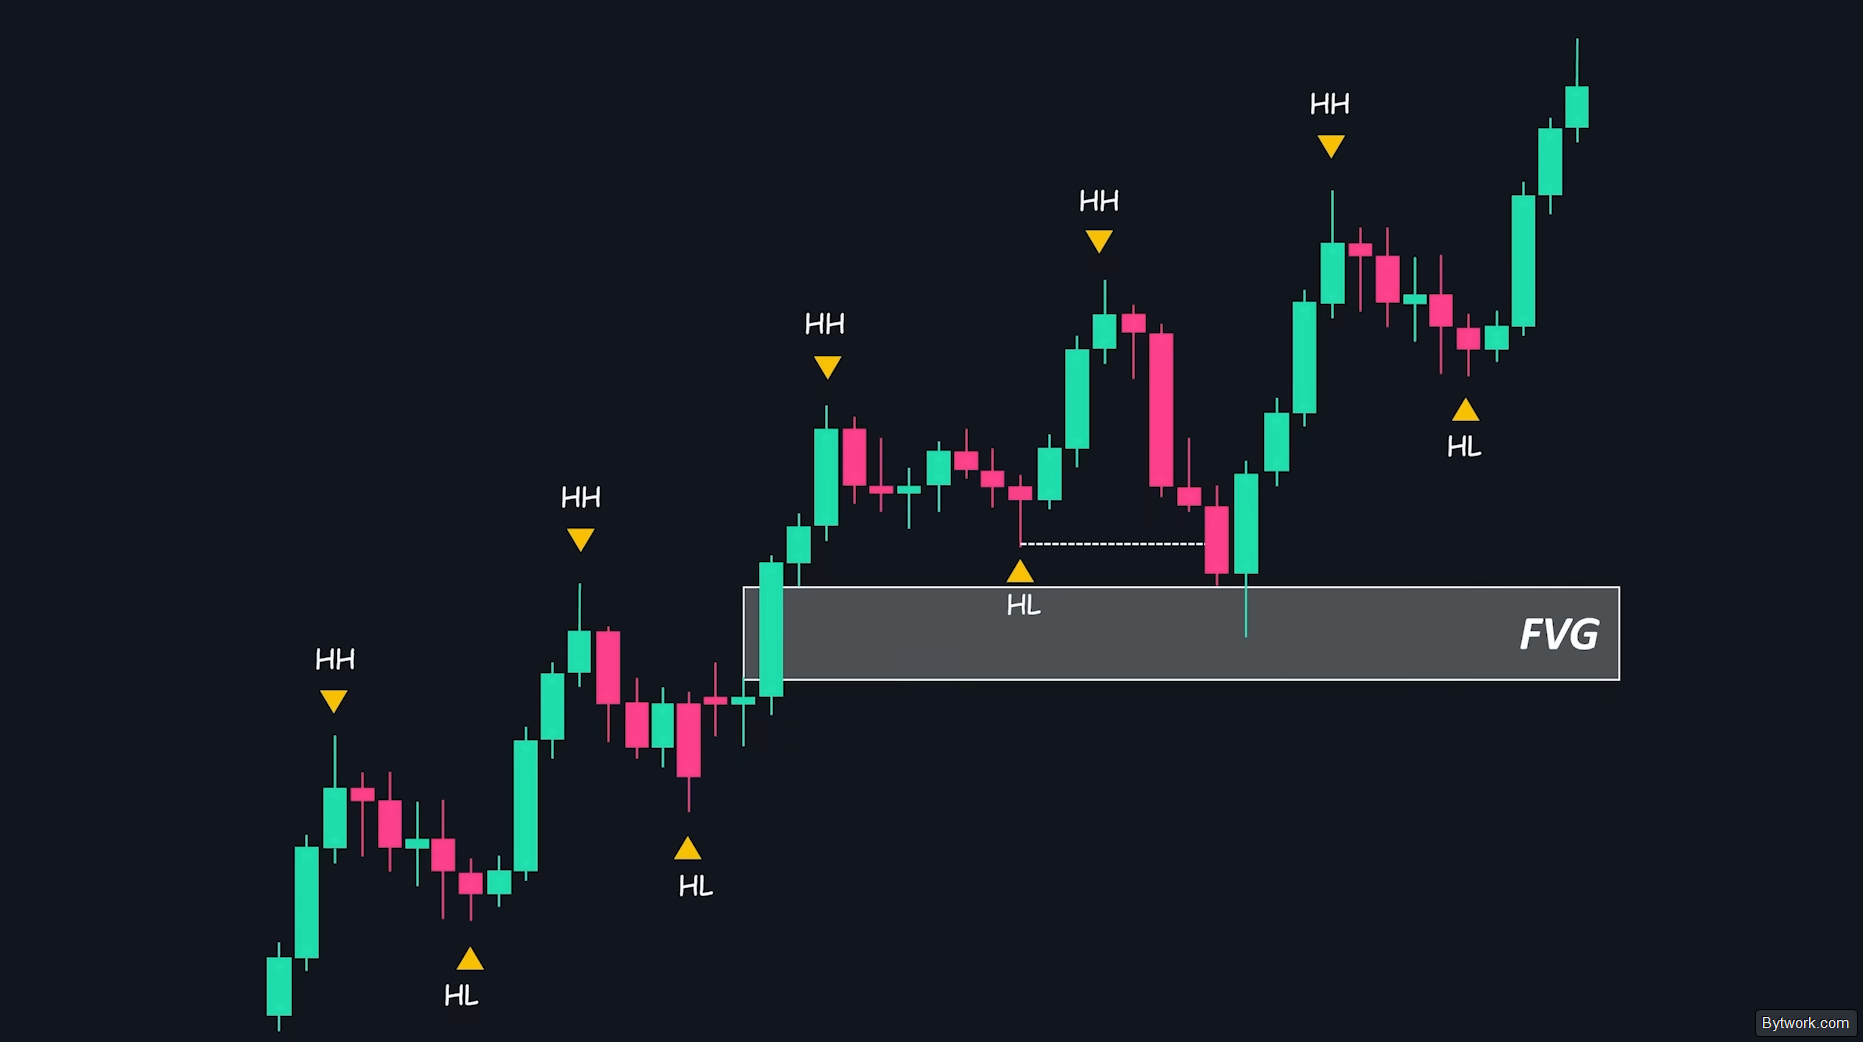
In this case, the downward move is just a reaction to filling the gap, not a real structural shift, which also invalidates the Change of Character.
In these situations, we do not consider the Change of Character as a true reversal and do not place sell orders. By identifying invalid Changes of Character, you filter out false signals and focus on stronger, more reliable reversal setups. All of this helps you stay on the right side of the market.
So, we have discussed ideal trends, non‑ideal trends, and false Change of Character signals. Now let us move on to genuine reversals.
Examples of Genuine Reversals
A true reversal is not just a single break of previous structure, but a sequence of events and a shift in behavior. First, the price fails to make a new high (showing weakness), and then it breaks the protected low with strong momentum. This is where control shifts from buyers to sellers.
However, the best reversals do not happen randomly. They often appear at critical levels, such as key pivot points or higher timeframe levels, or after a prolonged move when the trend is exhausted.
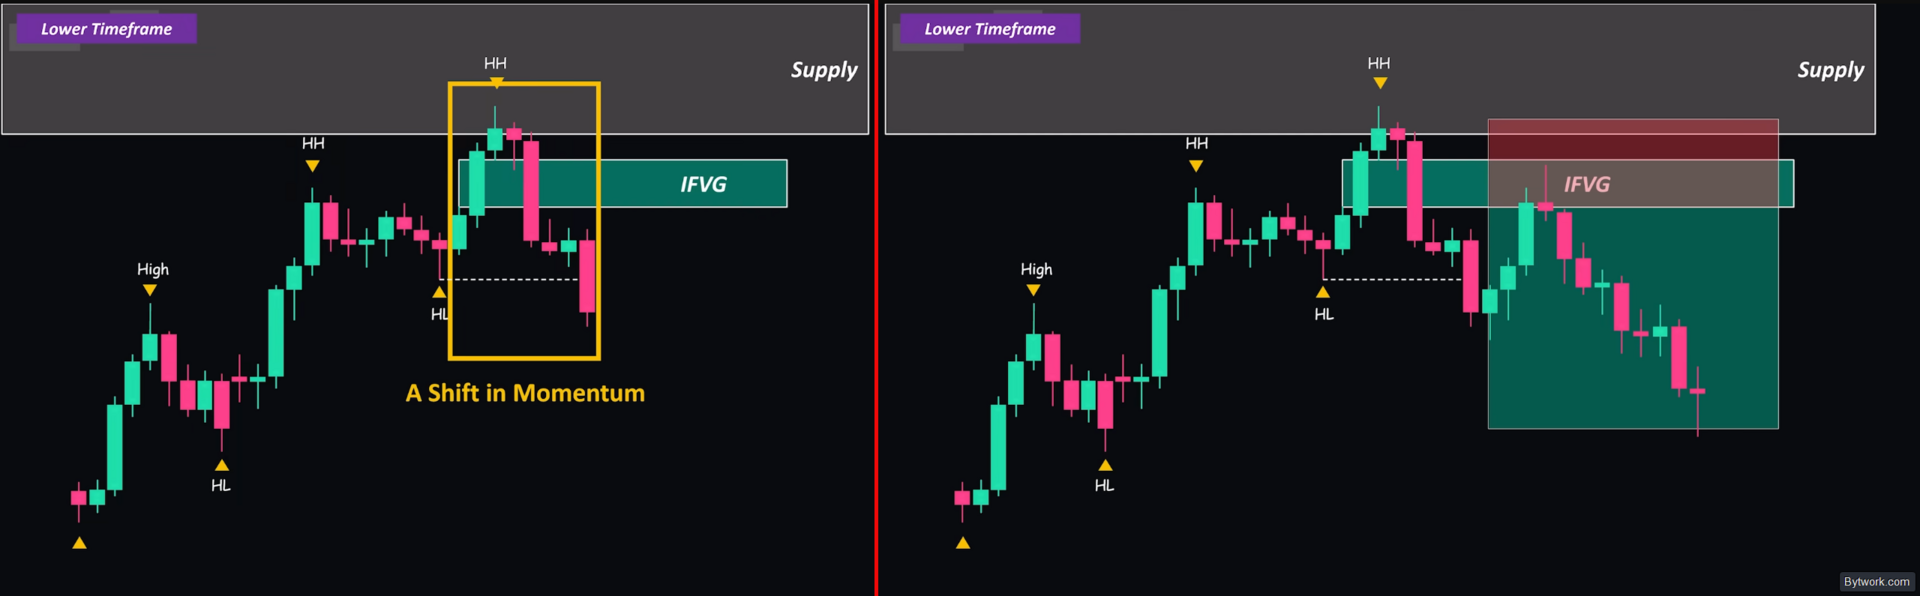
Another important reversal signal is a change in momentum. Notice how the previous upward move created a bullish Fair Value Gap, indicating strong buying pressure. But suddenly the momentum changes and sellers enter the market, and the price forms a bearish gap. This is clearly shown below:

This sudden change indicates that control is shifting from buyers to sellers, increasing the likelihood of a reversal.
How can we use these concepts in trading? That brings us to the second part of the guide – a reversal trading strategy.
A Two‑Timeframe Reversal Strategy
This strategy combines several smart money concepts and uses 2 timeframes. On the higher timeframe, we determine the market direction and mark key supply and demand zones where the price may offer a trading opportunity. Then we wait for the price to enter our zone and switch to the lower timeframe. There, we wait for a clear reversal signal and enter the trade in the direction of the higher timeframe.
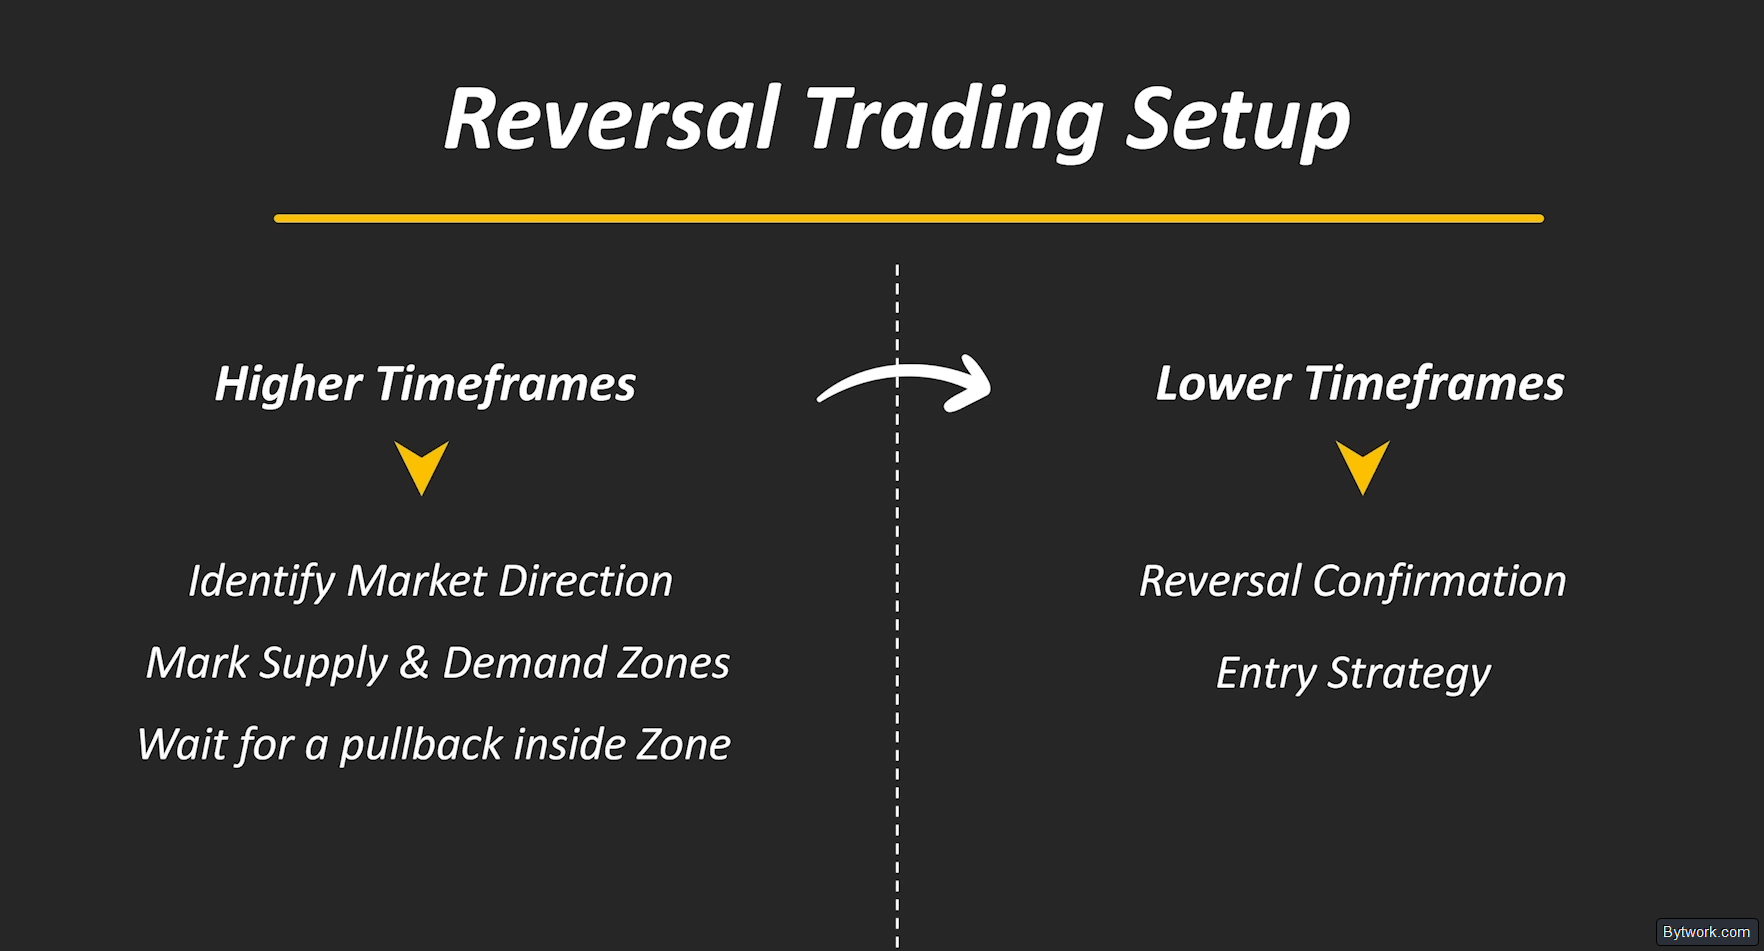
The entry timeframe should be at least 2 times smaller than the higher timeframe. The strategy is universal and works for forex, crypto, stocks, and futures.
However, before trading real assets, always backtest it on a demo account because this will help you understand the mechanics and enter trades with more confidence.
Now let us demonstrate how this trading strategy works on a price chart.
Practical Zone Identification and Entry
As mentioned, the strategy uses 2 timeframes. On the higher timeframe, we analyze the market structure, adding moving averages to filter out noise, to find the direction and key supply and demand zones. If you cannot clearly identify the trend, it is better to move to another currency pair rather than try to force a trade.
- To determine the direction, pay attention to the market structure, swing highs, and swing lows.
- To mark key supply and demand zones, identify zones that created an imbalance, or mark the candle that was followed by 3 impulsive candles.
- For a more precise structure analysis, we recommend studying Japanese candlestick patterns, which complement the analysis.
In this example, here is the key supply zone.
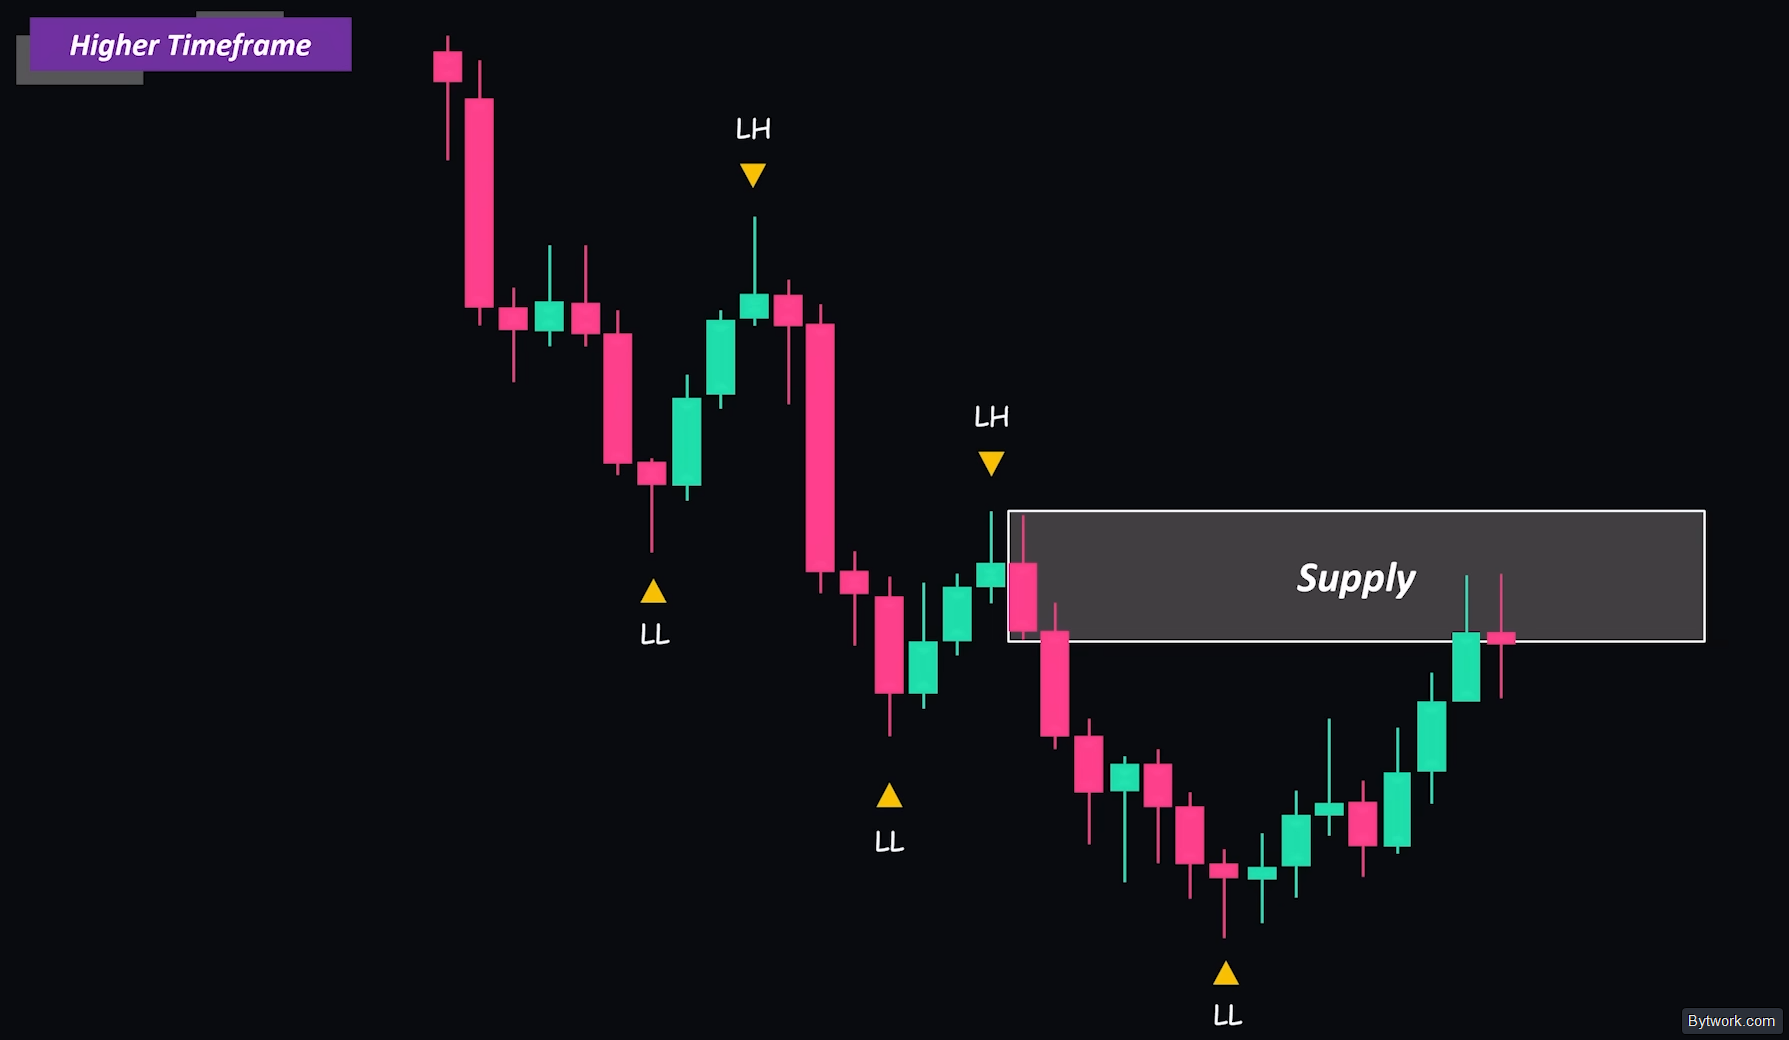
When the price touches this level, we expect a pullback down because this may provide a good trading opportunity. First, we wait for the price to enter our trading zone. Then we zoom in to the lower timeframe to find a short entry point.
Never enter too early, before the price returns to your range, because the market often shakes out early traders. This can lead to a move in the predicted direction, but only after you have been stopped out.
Now let us switch to the lower timeframe.
2 Types of Reversal Entry with a Liquidity Sweep
On the lower timeframe, we see a clear short‑term uptrend. We need to look for a reversal signal and enter a short trade against the trend of the lower timeframe. That is why the strategy is called a reversal strategy.
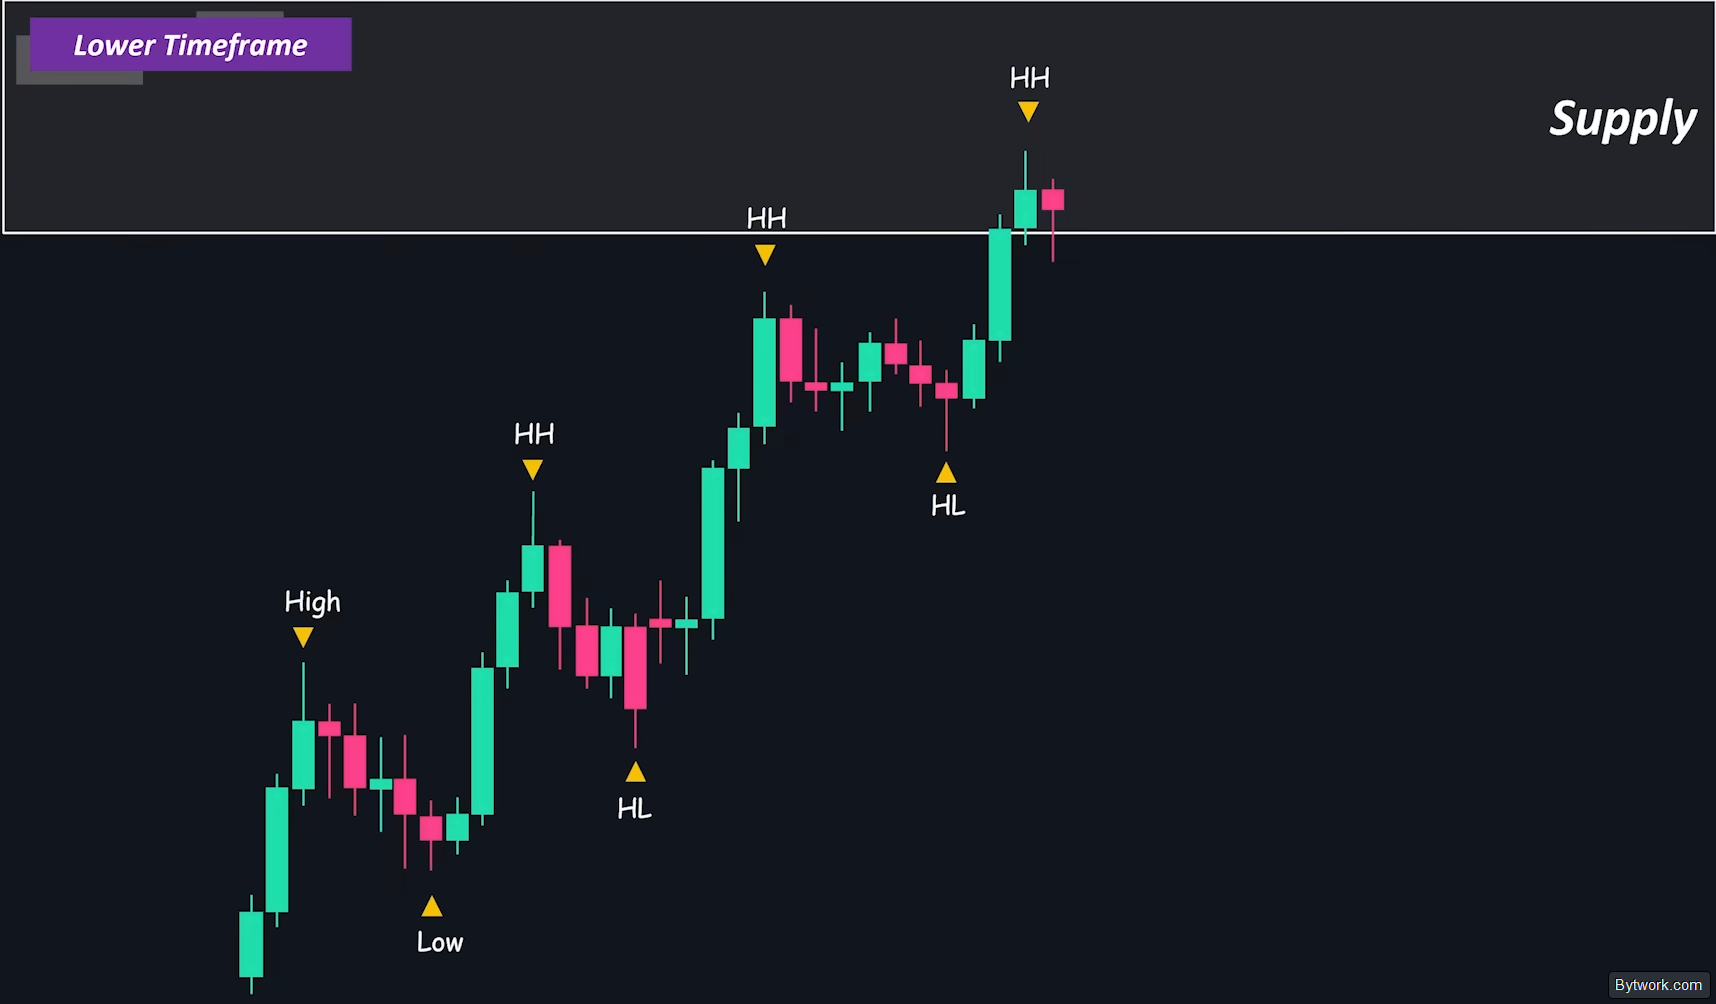
It is important to understand that although we are trading against the trend of the lower timeframe, we are still trading in the direction of the higher timeframe!
Here we explain 2 professional entry types. You may use either one to enter the trade.
The first entry type is a Change of Character combined with a liquidity sweep. A strong trading opportunity arises when the price sweeps liquidity above the previous high, followed by a clear Change of Character. The liquidity grab shows that buyers’ liquidity has been taken and early buyers are trapped.
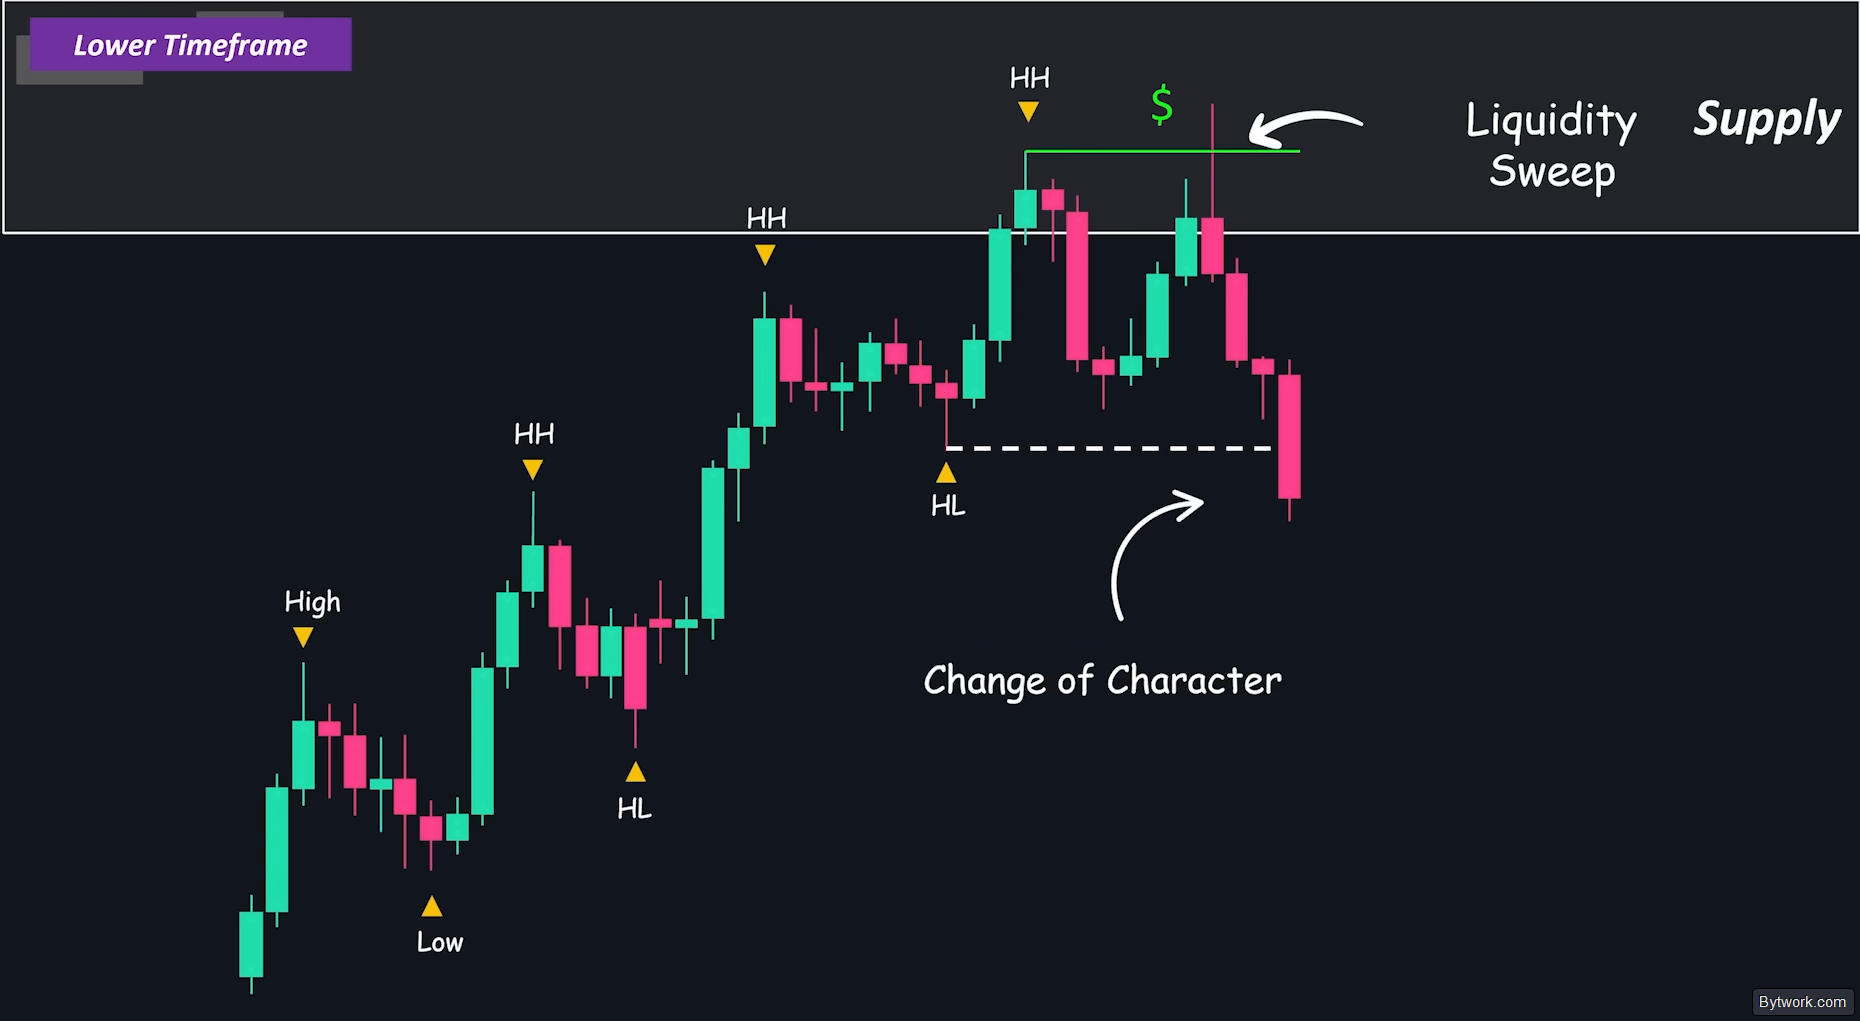
The reversal is then confirmed by a Change of Character when the price breaks the most recent higher low and shifts the market structure downward. But remember, all this price action occurs at the higher timeframe supply level.
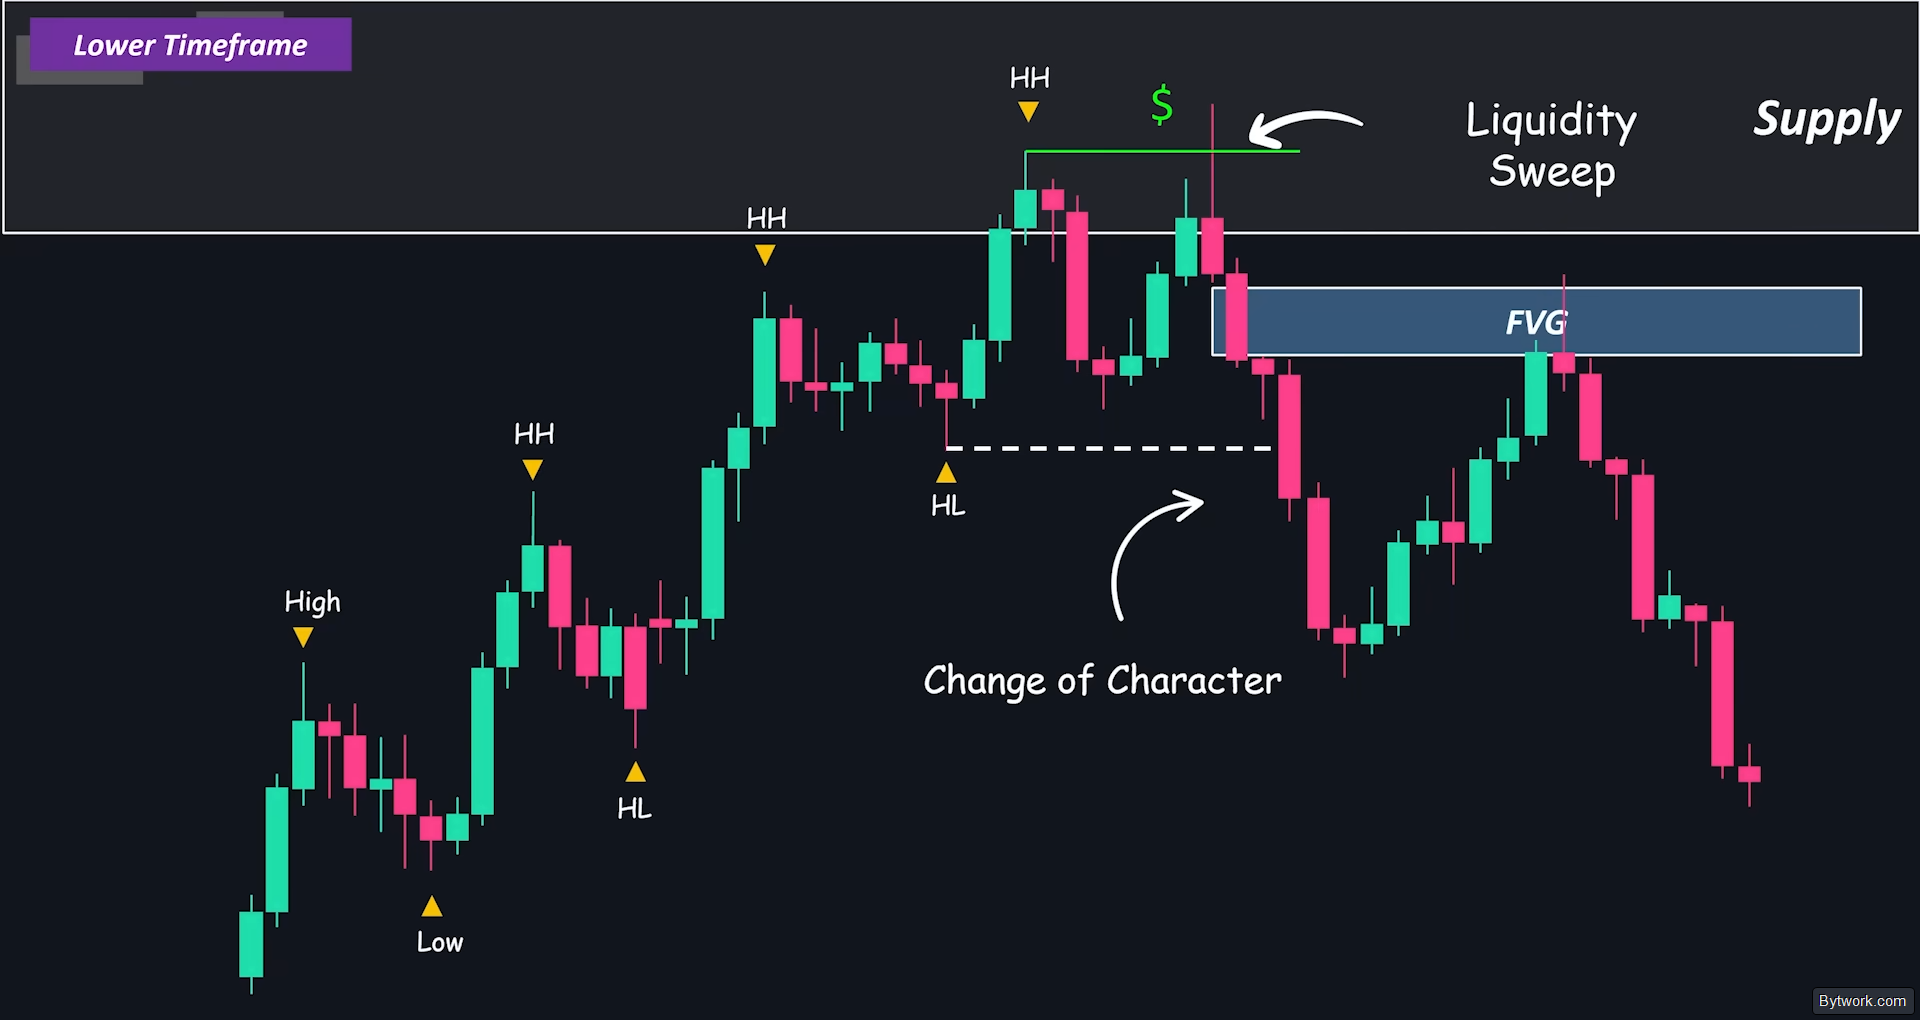
Thus, we are not trading blindly on the lower timeframe. After this, you can wait for a pullback to the new supply level or to an imbalance (FVG) to place a short trade. Use the Fibonacci retracement tool for refinement.
Inversion Imbalance and Trailing Profit
The second entry type is entry via an inversion FVG (Fair Value Gap). If an inversion FVG forms after the price enters the supply zone, it shows a strong shift in momentum. This is a powerful reversal signal that can create one of the best trading opportunities.
We place a limit sell order at the start of the zone and set the stop loss above it. As targets, we can aim for a solid risk‑to‑reward ratio of 1:2 or 1:3, and then set the next target at the next key level ahead in the direction of the price.
Another approach is trailing profit, which can sometimes lead to very large trades with a high risk‑to‑reward ratio.
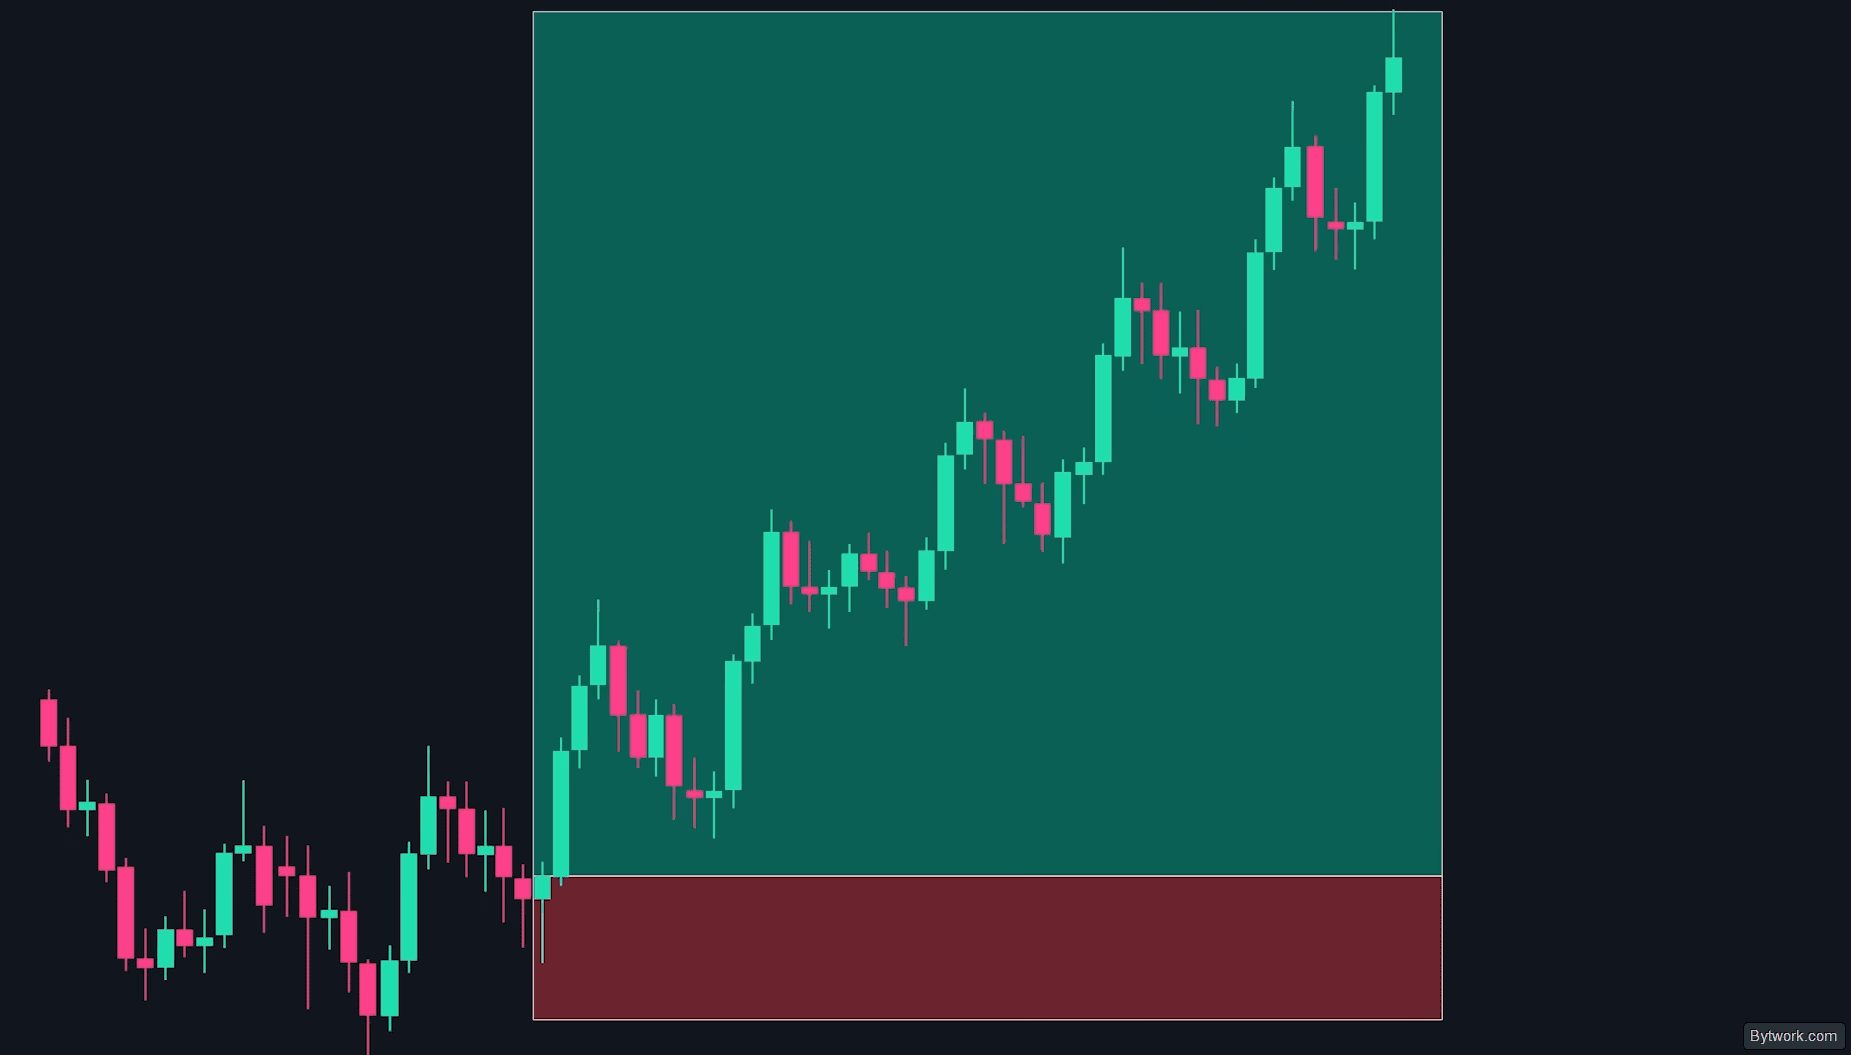
Trailing profit works as follows: once you enter a trade and the price moves in your favor, move your stop loss just below the new swing low.
If the price moves again, adjust the stop loss below the next higher low.

Thus, if the price reverses and hits your stop loss, you do not lose money. This reduces pressure and helps lock in profits while keeping you in the trade as long as the trend continues.
Continue using this method, but always set a final target for your trade. If the price keeps moving in your favor, you can achieve substantial profits with minimal risk.
Chart Examples
Now let us look at several examples on the price chart to fully apply this trading strategy.
Our experience shows that strategies based on liquidity grabs (false breakouts) perform significantly better than working with classical chart patterns in their pure form.
Example 1 – 15‑minute chart
Here we have a 15‑minute chart. In the indicator settings, we select Fair Value Gap, Break of Structure, and Change of Character, as shown below.

Now we can see that the price is clearly making higher highs and higher lows with strong upward breakouts. This means we are bullish on this pair and only look for buying opportunities.
The last impulsive move created large FVGs, which show strong buying momentum. We mark the candle that created these gaps as our demand zone.

If the price retraces to this area, we expect a bounce upward and a possible trading opportunity. First, we wait for the price to enter our trading zone, then we switch to the 1‑minute chart for execution.
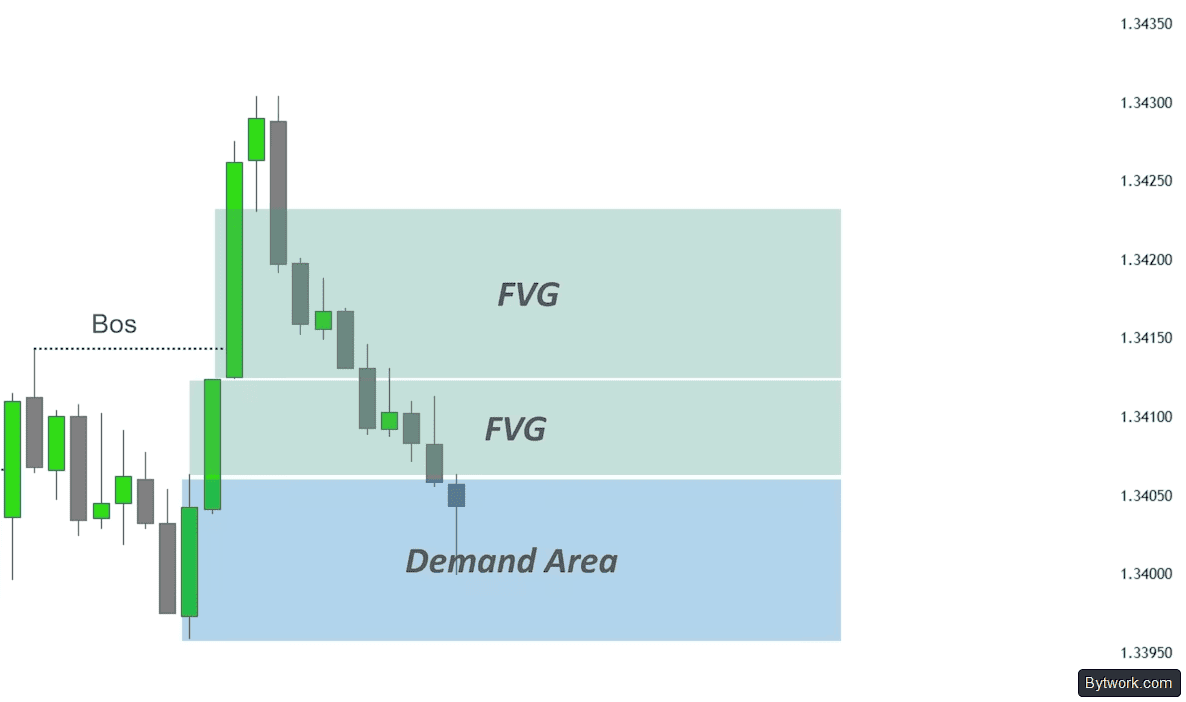
On the 1‑minute chart, we see a clear downtrend – this is simply a pullback into the higher timeframe demand zone. We want to see reversal signals and rejection from this zone to open a long trade.
However, if the price breaks the demand zone to the downside, we do not open the trade!
Moving forward, we see a clear Change of Character. There is also an inversion FVG and a new bullish gap forming. This is exactly the type of reversal signal we were waiting for.

We can place the entry at the start of the zone and the stop loss below it. Our target is the higher timeframe supply zone ahead in the direction of the price.

Remember to always follow a sound risk management plan and never risk more than you are willing to lose, keeping each trade within 1–3% of your capital.
Example 2 – 1‑hour chart
We apply Break of Structure and Fair Value Gap from the indicator settings.

We see a clear downtrend. We mark the candle that created the gap as our supply zone, including the wick. Now we wait for the price to return to this area, then switch to the lower timeframe to find confirmation for a short trade.

We switch to the 5‑minute chart. On this chart, the price has already made a Change of Character. We see an overlapping area of an inversion FVG and a new bearish FVG, forming a strong supply zone. This gives us a strong reason to open a short trade.

As the move progresses, the price falls and creates another bearish gap. Without closing the first trade, we can open a second position with reduced risk. As it continues, the price returns and triggers our first trade. However, the second trade becomes unprofitable if not managed properly and if partial profits are not taken.

What Are the Drawbacks and Risks of Looking for Reversals?
Losses are a normal part of trading, even professional traders face them regularly.
Professional traders typically achieve annual returns of around 30–100%. Chasing unrealistic profits often leads to a cycle where you constantly change strategies after losses.
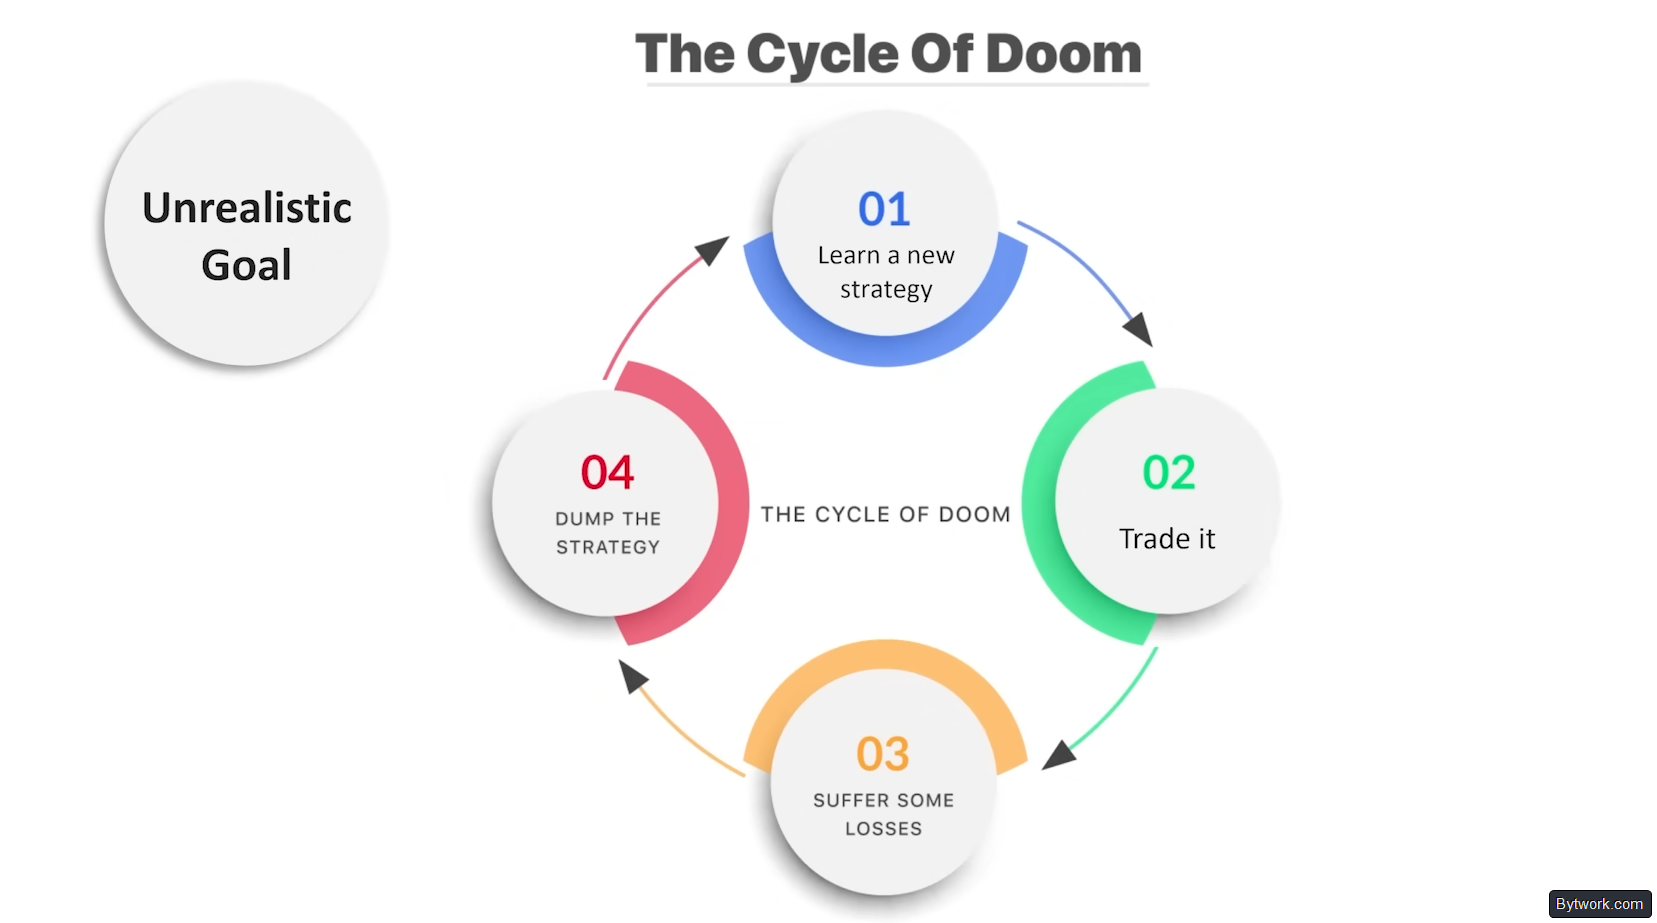
This doom loop arises because you are aiming for results that no strategy can consistently achieve.
Let us consider what other drawbacks exist.
Technical risks:
- The biggest risk is trying to catch a bottom or top BEFORE real signals appear. The market can remain irrational longer than the trader can remain solvent.
- Up to 95% of trendline breakouts are fake, and the price quickly returns to the trend.
- Large players deliberately provoke false moves to collect retail traders’ stop losses (fuel) before the true reversal.
- On lower timeframes (1m, 5m), there is a lot of random noise and false signals.
- Waiting for 100% confirmation of a reversal makes you miss the best entry point and reduces the risk/reward ratio.
Psychological and systemic disadvantages:
- Attempting to predict a market crash or a perfect reversal out of ego rather than facts.
- Without a multi‑timeframe approach, the trader suffers a string of small losses.
- A reversal is not a point but a process of control shifting from buyers to sellers, which can be accompanied by a prolonged period of uncertainty or sideways movement.
- Trading against the trend is dangerous because the reversal may turn out to be just a deep correction, after which the trend resumes.
And as they say, if you cannot see where the liquidity is hidden on the chart – you are that liquidity for the market maker. If you cannot see where the liquidity is hidden, use liquidation maps to visualise market maker positions.
Summary
Beginners try to catch a bottom or top to feel like geniuses who predicted a crash or a pump. But the reality is that the market pays not for cleverness, but for disciplined waiting for confirmation.
Professionalism lies in the ability to push through nervousness and follow the system, even when it is scary. Successful traders know that you need to stop trading your ego and start trading the chart.
You should always trade with the trend to increase your winning percentage. In a bull market, it makes sense to catch upward moves rather than small pullbacks. But remember, the trend is your friend until it ends!
A single chart is a recipe for disaster. The reality is that small trends on 1‑minute charts always lose to impulses on daily or 4‑hour intervals. The real experience of traders with 7–12 years of experience shows an evolution from believing in a magic indicator to understanding market structure.
If the noise on the chart bothers you, try the Heikin Ashi indicator for a clearer view of the trend.
Postscript: we have been trading since 2018 and have tested hundreds of strategies and indicators. Choosing a trading system can be helped by the trading section! Yours truly, editor Pavel Grachev for bytwork.com.
This material is for informational purposes only and does not constitute financial advice.

Now reading


In DePin, people create networks themselves, share traffic or capacity, and receive rewards in tokens from these projects.