Volume Profile: How to Filter Out 99% of False Breakouts. A Comprehensive Guide
In this guide, you will learn all the secrets of trading with the Volume Profile. This is not just theory – it’s a distillation of 8 years of experience:
- This base has helped hundreds of traders in our community pass prop challenges and achieve consistent profitability.
- We will break down setups for precise trades.
- We will turn chaotic trades into a clear step‑by‑step algorithm.
- And we will answer the most non‑obvious questions about the Volume Profile and provide a clear checklist.
The Essence of the Volume Profile
Volume Profiles show how much trading volume occurred at each specific price level. This is a crucial difference from traditional volume indicators, which show total volume for the entire trading day – that is far less useful for finding meaningful levels.
To open the profile, in the left panel, under the forecasting and measurement tools, select Anchored Volume Profile. Then click on the chart at the point from which you want to start the profile calculation – and it will appear on the right.

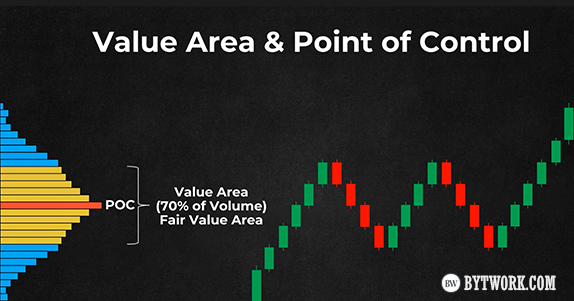
The bars on this profile show how many trades occurred at each price level. The longer the bar, the more volume at that level.

The red line marks the Point of Control (Point of Control or POC). This is the level with the highest trading volume.
Why is high volume so important?
A level with large volume indicates a price where buyers and sellers showed particularly strong interest and where they took active action.
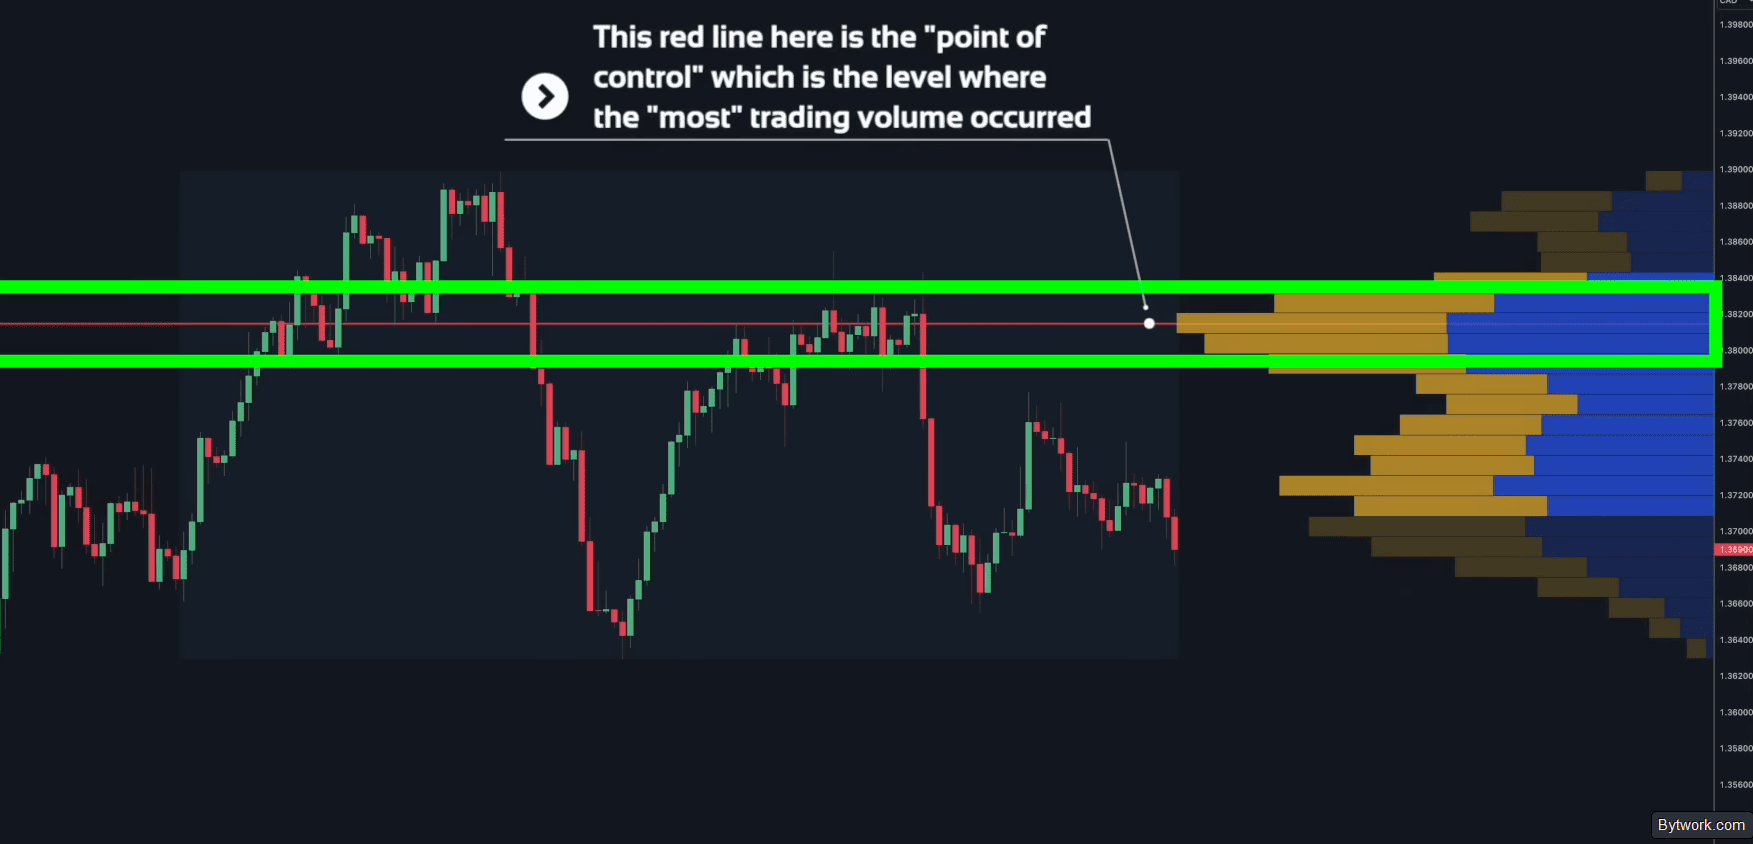
This means that if the price returns to this line in the future, there is a high probability of renewed interest and new actions. This creates excellent opportunities for entering or exiting a trade.
To move forward, it is important to understand a few elements of the profile.
Volume Profile Elements: POC, VAL, VAH
- HVN (High Volume Node) – the upper volume peak, an area of high trading activity.
- LVN (Low Volume Node) – a trough in the profile, minimal trading volume (a “hole” in the middle of the chart).
- HVN (POC) – the Point of Control, the longest red bar with maximum volume (at the bottom).
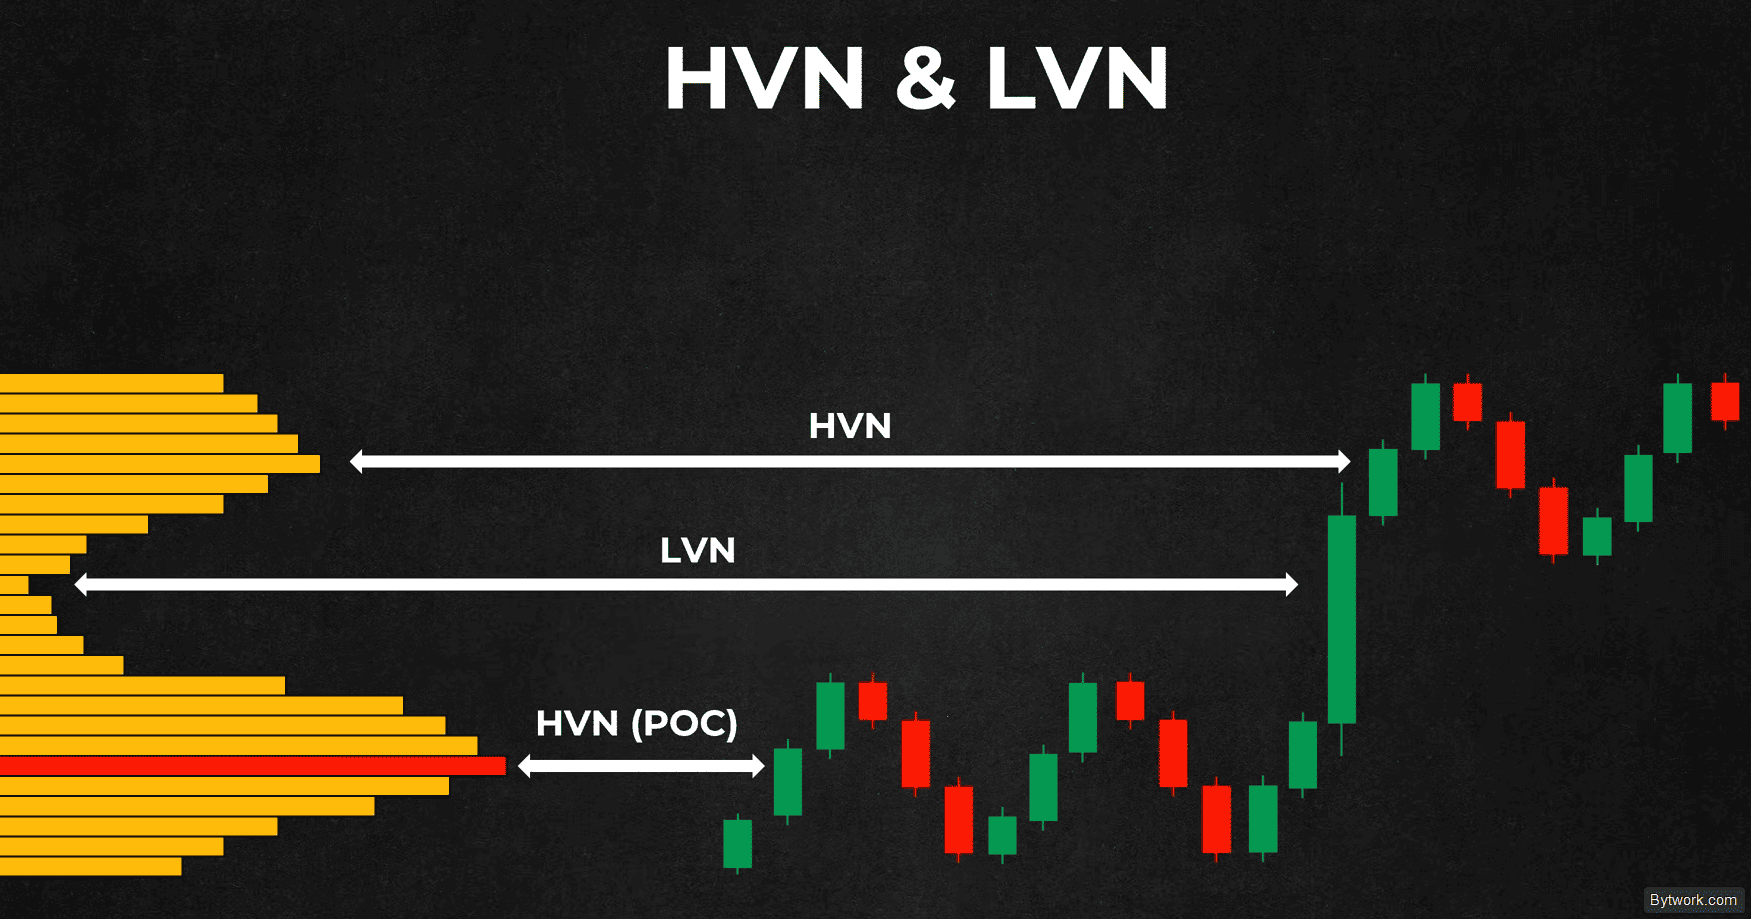
There are also VAH and VAL:
- VAH (Value Area High) – the upper boundary of the Value Area.
- VAL (Value Area Low) – the lower boundary.

Experience shows that the POC, VAH and VAL levels are most effective on the first test. Repeated touches lose significant strength because liquidity in that zone has already been exhausted.
Volume Profile Shapes
Let’s briefly look at the shapes. There are four of them.
|
Shape |
Market State |
Tactic |
Signal |
|
D |
Balance (70% of the time) |
Trade from the edges to the POC |
Close inside the Value Area |
|
P |
Bullish trend or bounce |
Go long from the POC or VAL |
Close above half of the range |
|
B |
Bearish trend or reversal |
Go short from the POC or VAH |
Close below half of the range |
|
Thin |
Aggressive impulse |
Look for Volume Bumps on a retest |
Impulsive move on news |
There are also big B, small B, and other shapes, but in classical technical analysis we use these four.
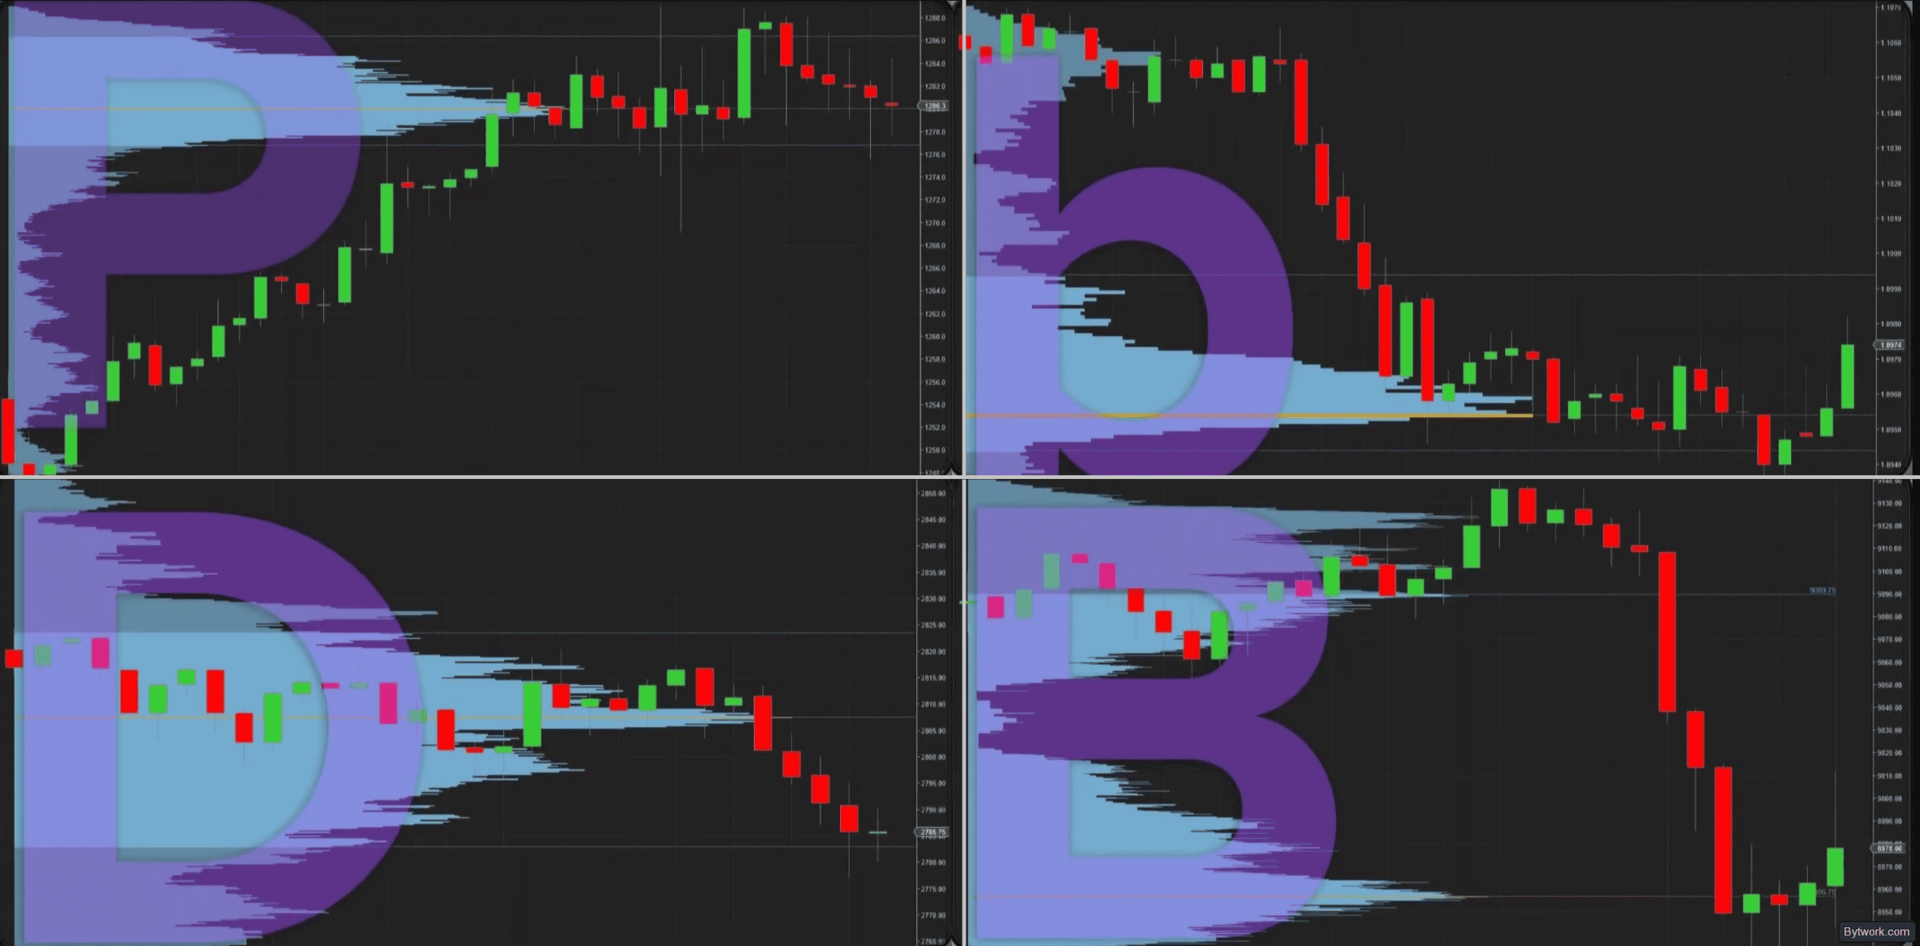
Let’s move closer to real examples.
Combining with Key Levels
Like any indicator, the Volume Profile must be combined with price action methods, for example, using key support and resistance levels.
For instance, you can apply the Volume Profile at the start of a specific price move – then the volume will be calculated only from data after that anchor point.

The red line is the Point of Control (POC), where the most trades took place during that move. This indicates that the high‑volume zone becomes an area of interest.
If the price returns to this zone, it may give a buy signal or become a good target for exiting short positions.

The real magic happens when you combine high‑volume zones with key levels!
For example, if when zooming in you notice that several important reversal points coincide with a high‑volume zone, that zone becomes even more significant. The higher the quality of the zone, the higher the probability of a price reaction when it returns to it in the future.

By identifying many reversal points and high‑volume bars, you can pinpoint several high‑quality zones to watch for trading opportunities.
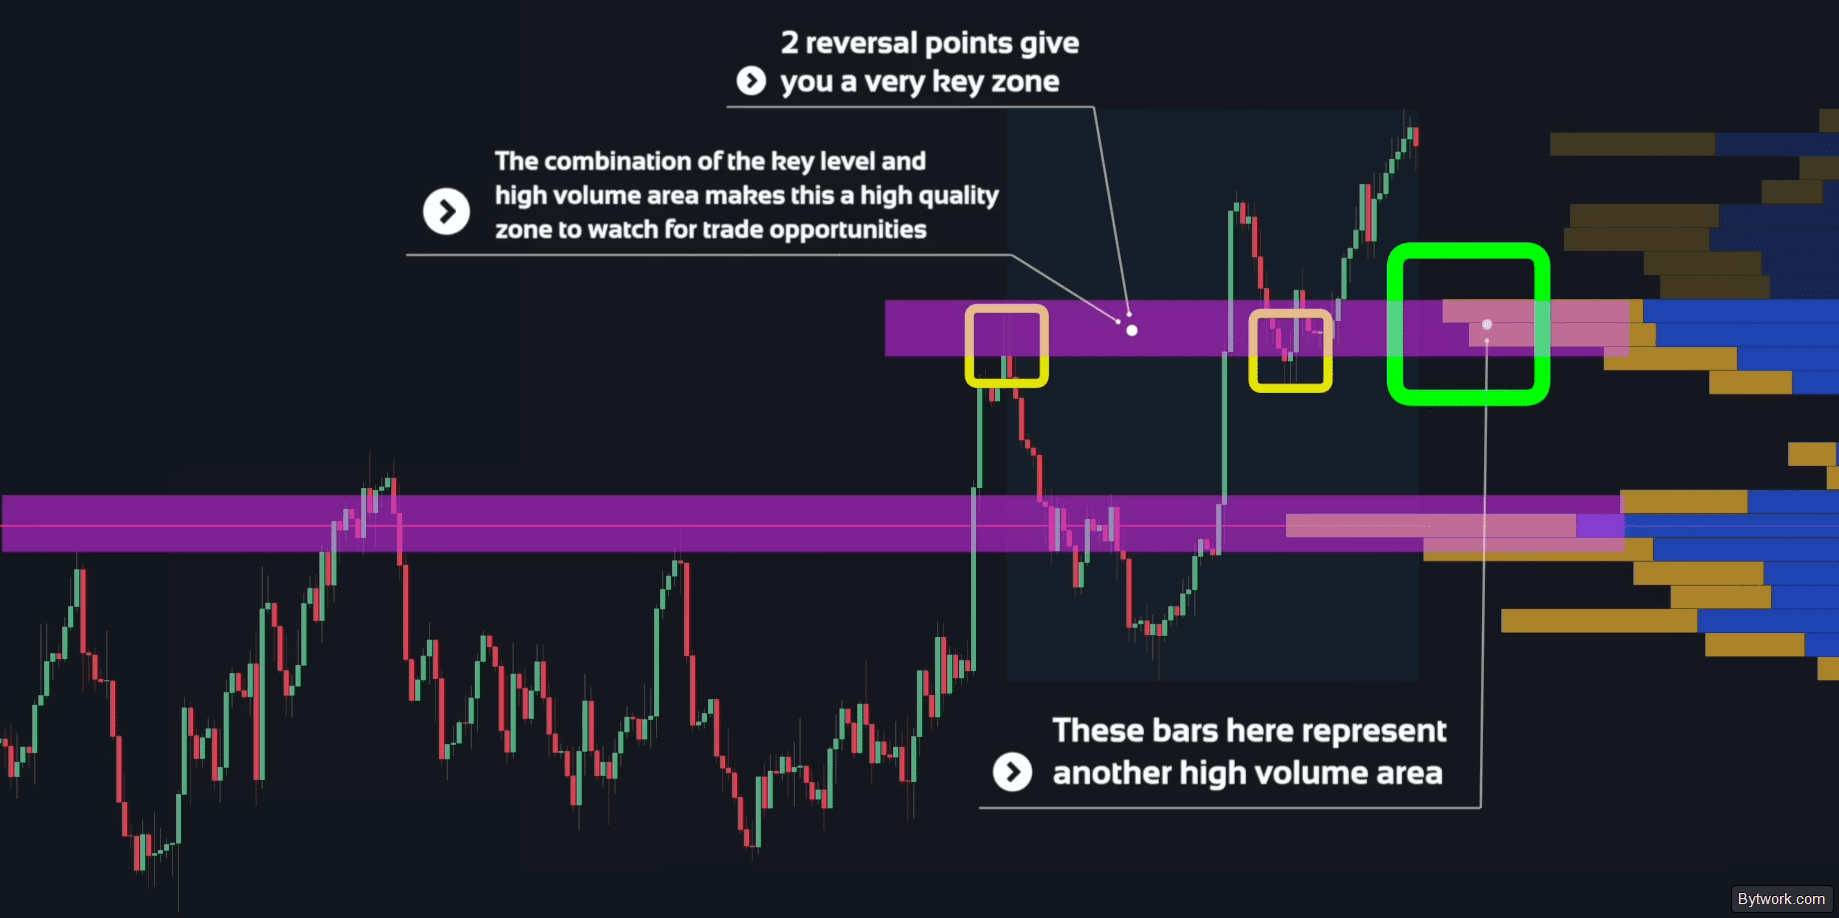
The highest accuracy is achieved when the POC coincides with horizontal support/resistance levels or the Fibonacci golden pocket (61.8%–78%).
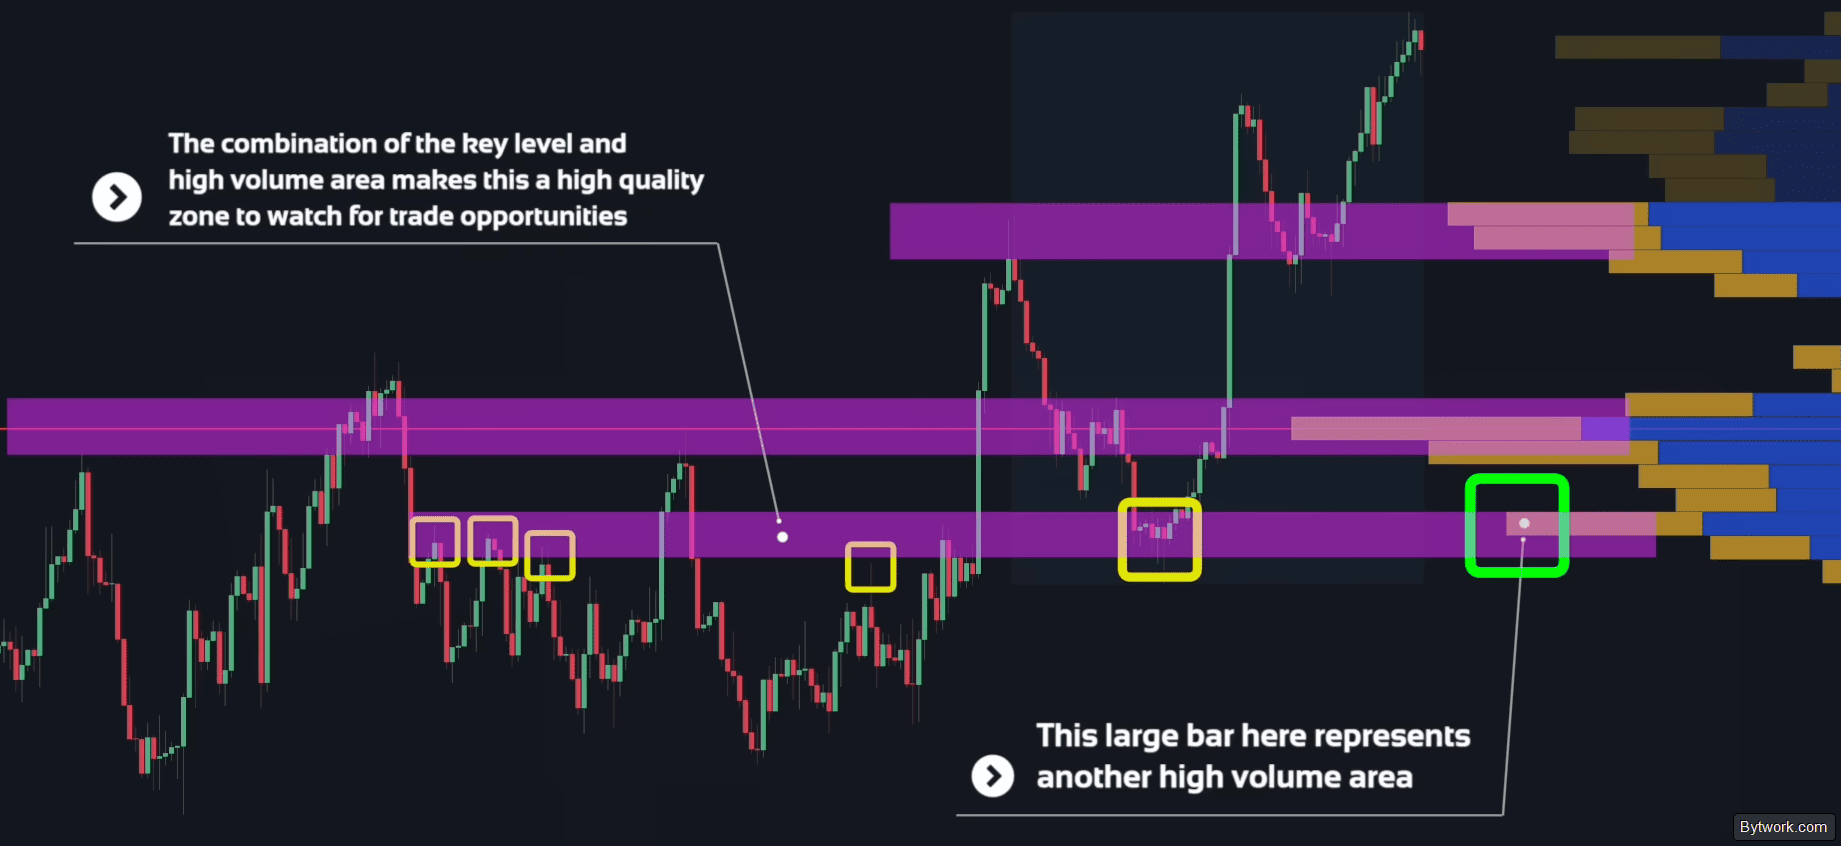
You can apply the Volume Profile to an entire section of the chart to more precisely find the best key zones. By identifying the Point of Control and several reversal points, you will set key levels for potential future reactions.
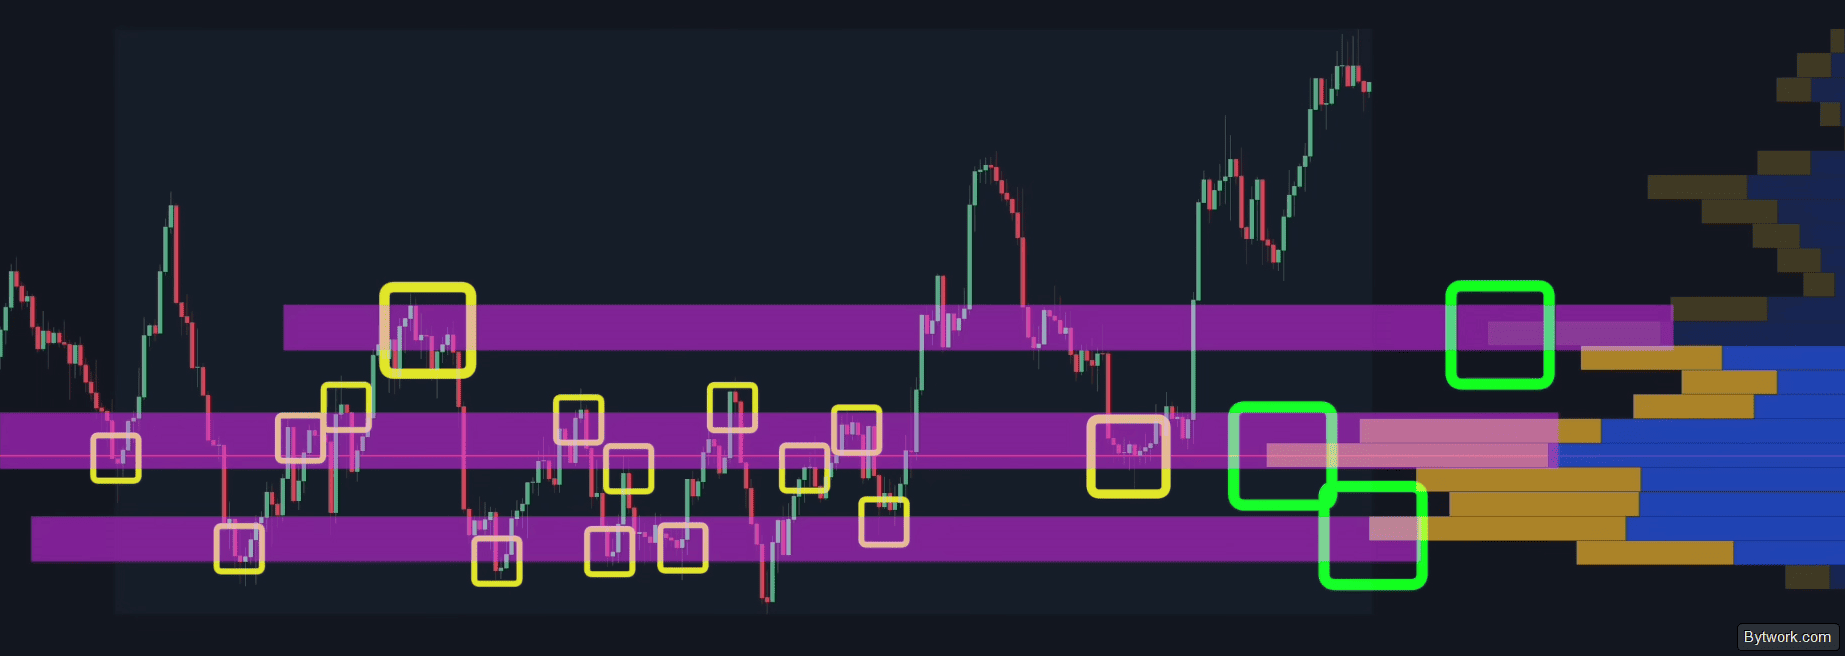
A breakout of a dynamic level (trendline) combined with price leaving the Value Area confirms the strength of the impulse.
However, to take the strategy to the next level, let’s look at the Session Volume Profile.
Session Volume Profile
The Session Profile is especially useful for intraday traders and those who work on lower timeframes.
The Session Volume Profile is an analytical algorithm that shows the distribution of trading volume at each price level within a specific trading session.
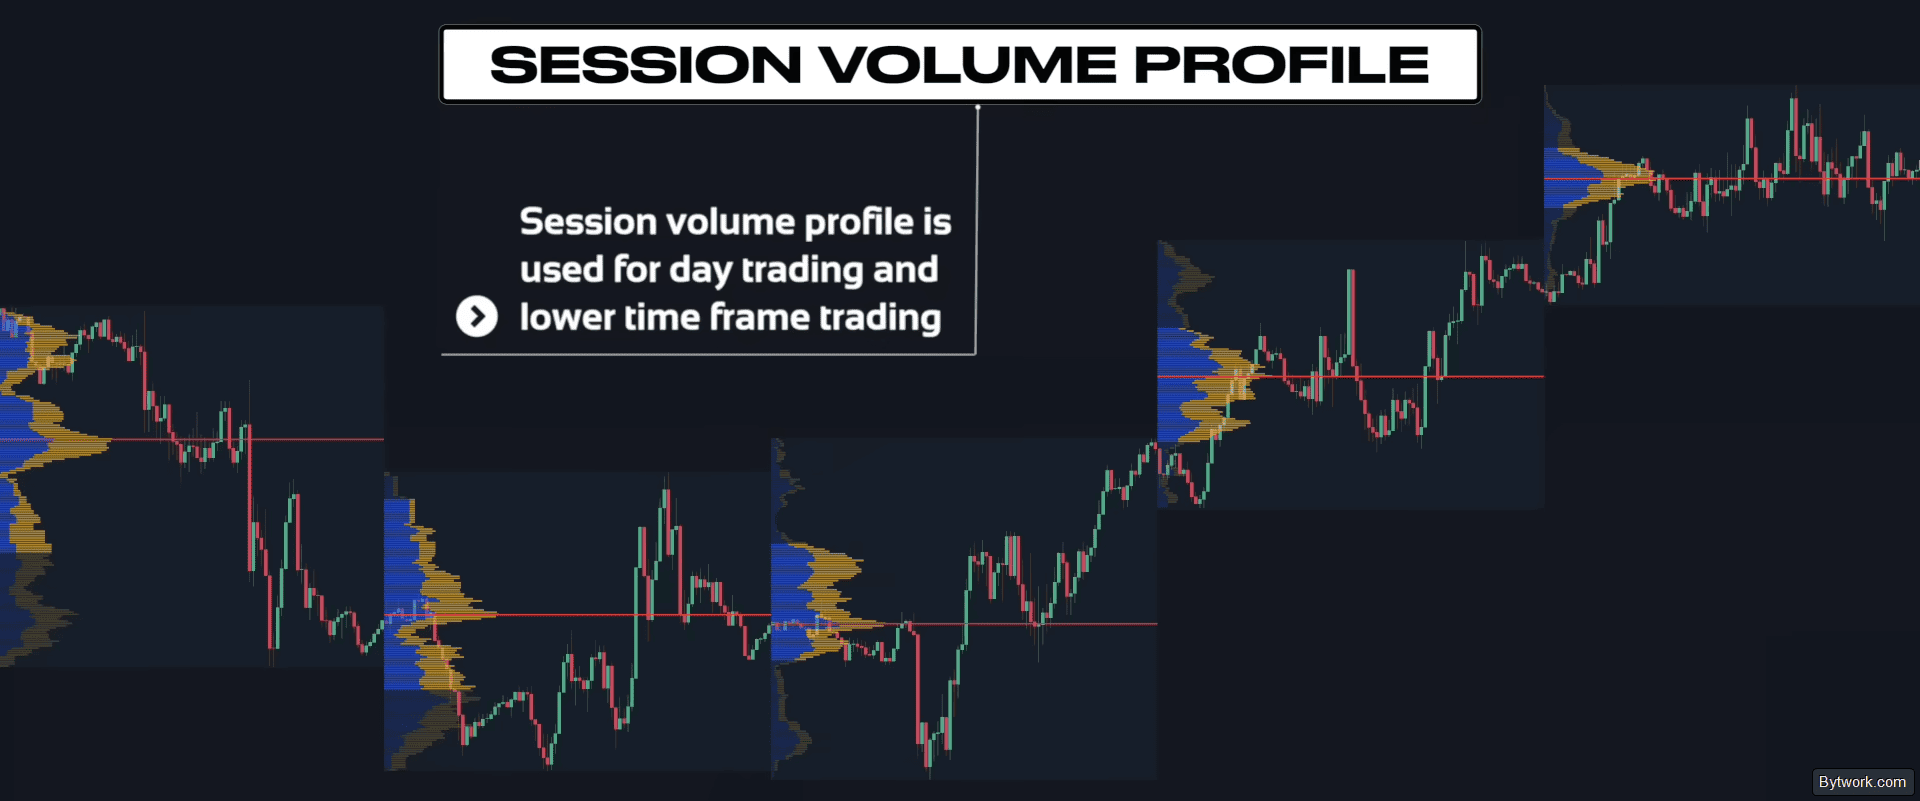
Unlike a vertical histogram that answers the question “when,” the Session Profile shows “where” exactly the battle between bulls and bears took place.
Configuring the Session Profile
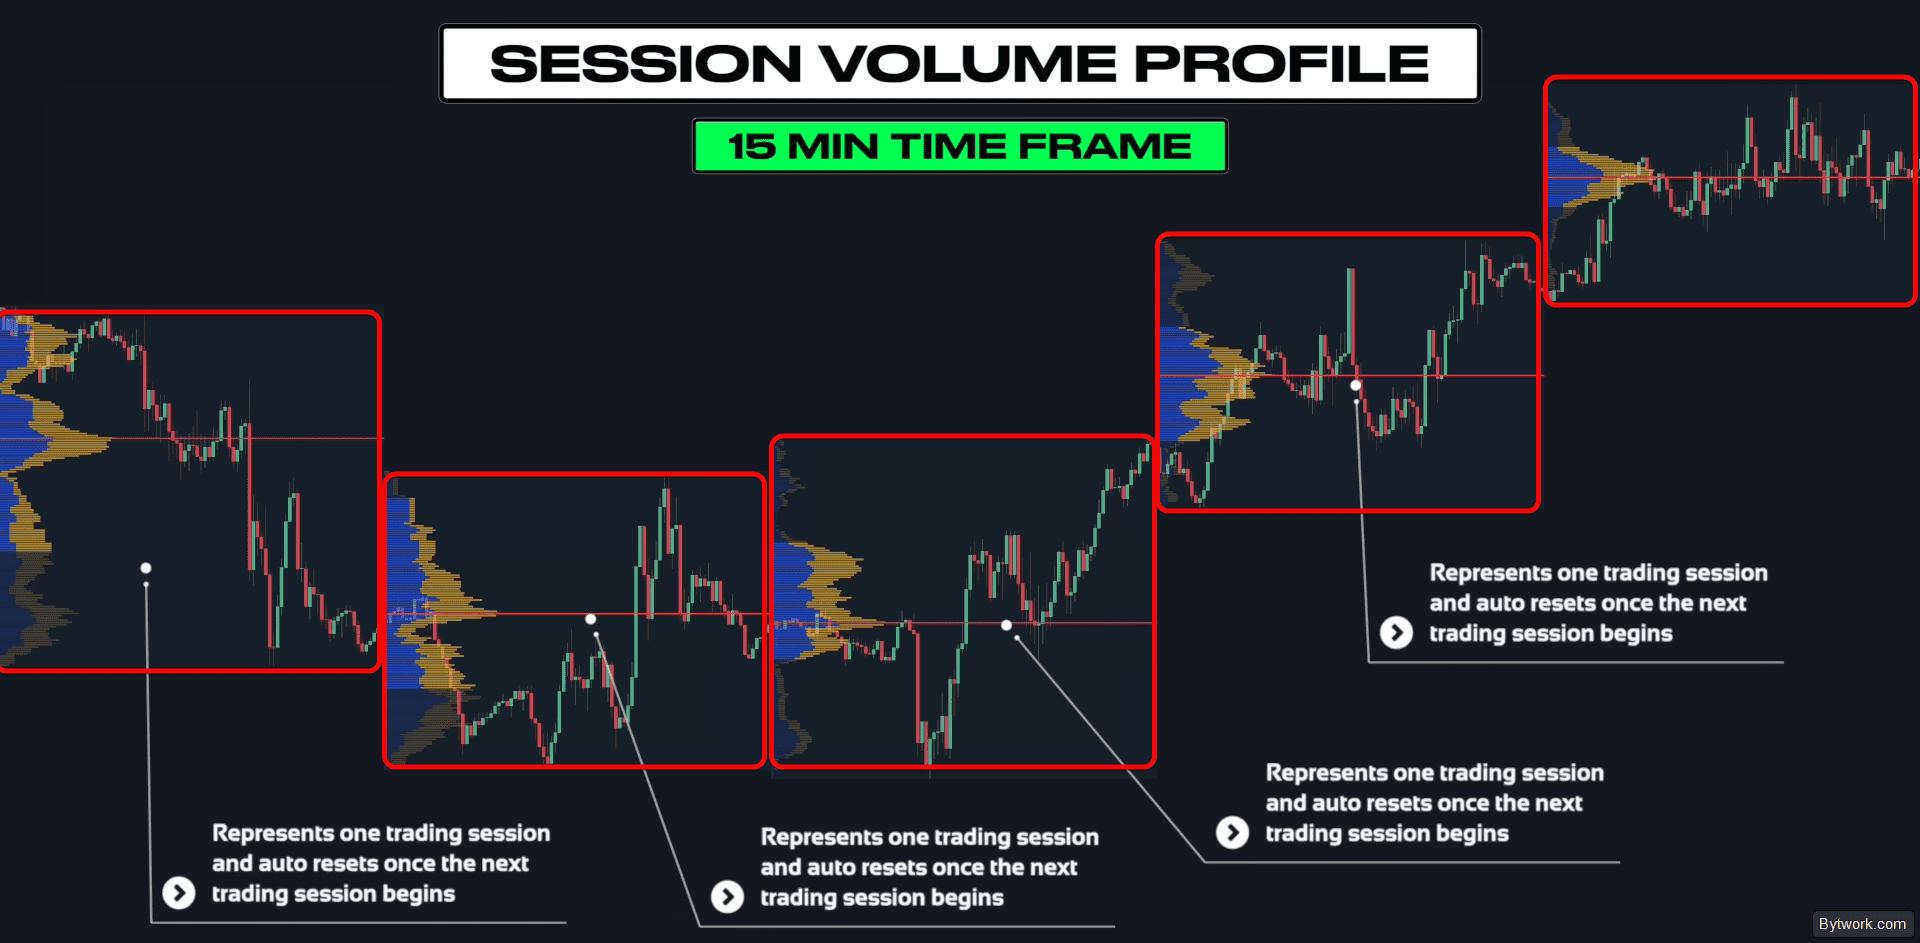
On a 15‑minute chart, you will see several separate Volume Profiles, each corresponding to one trading session and automatically resetting at the start of the next one. This allows for quick entries and exits during day trading.
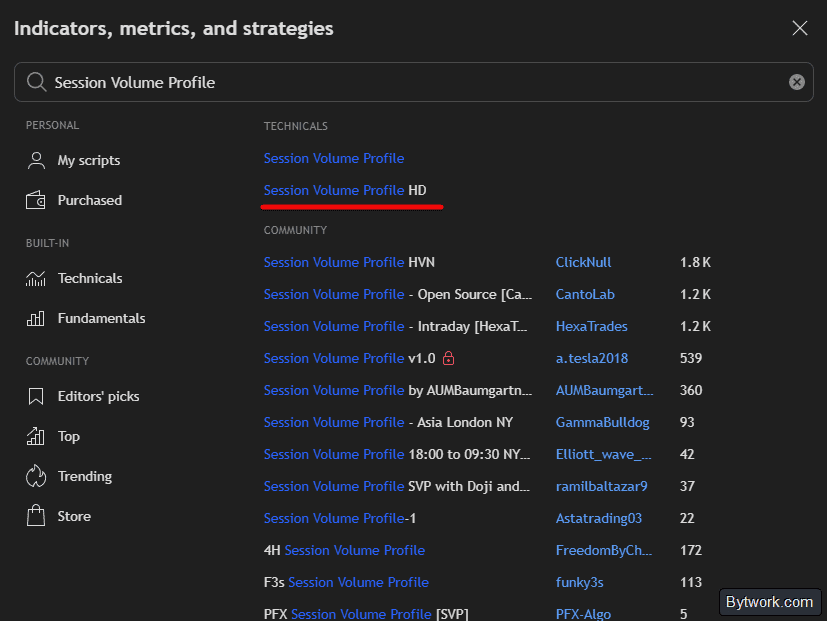
To set up this indicator, go to the indicators section, type Session Volume Profile in the search, and select Session Volume Profile HD.
It will appear on your chart, with each profile corresponding to one trading day.
How to use the Session Profile?
For effective use of the Session Volume Profile, look at the previous trading session and identify its Point of Control and the maximum volume zone. These levels give you a key zone for the current session.
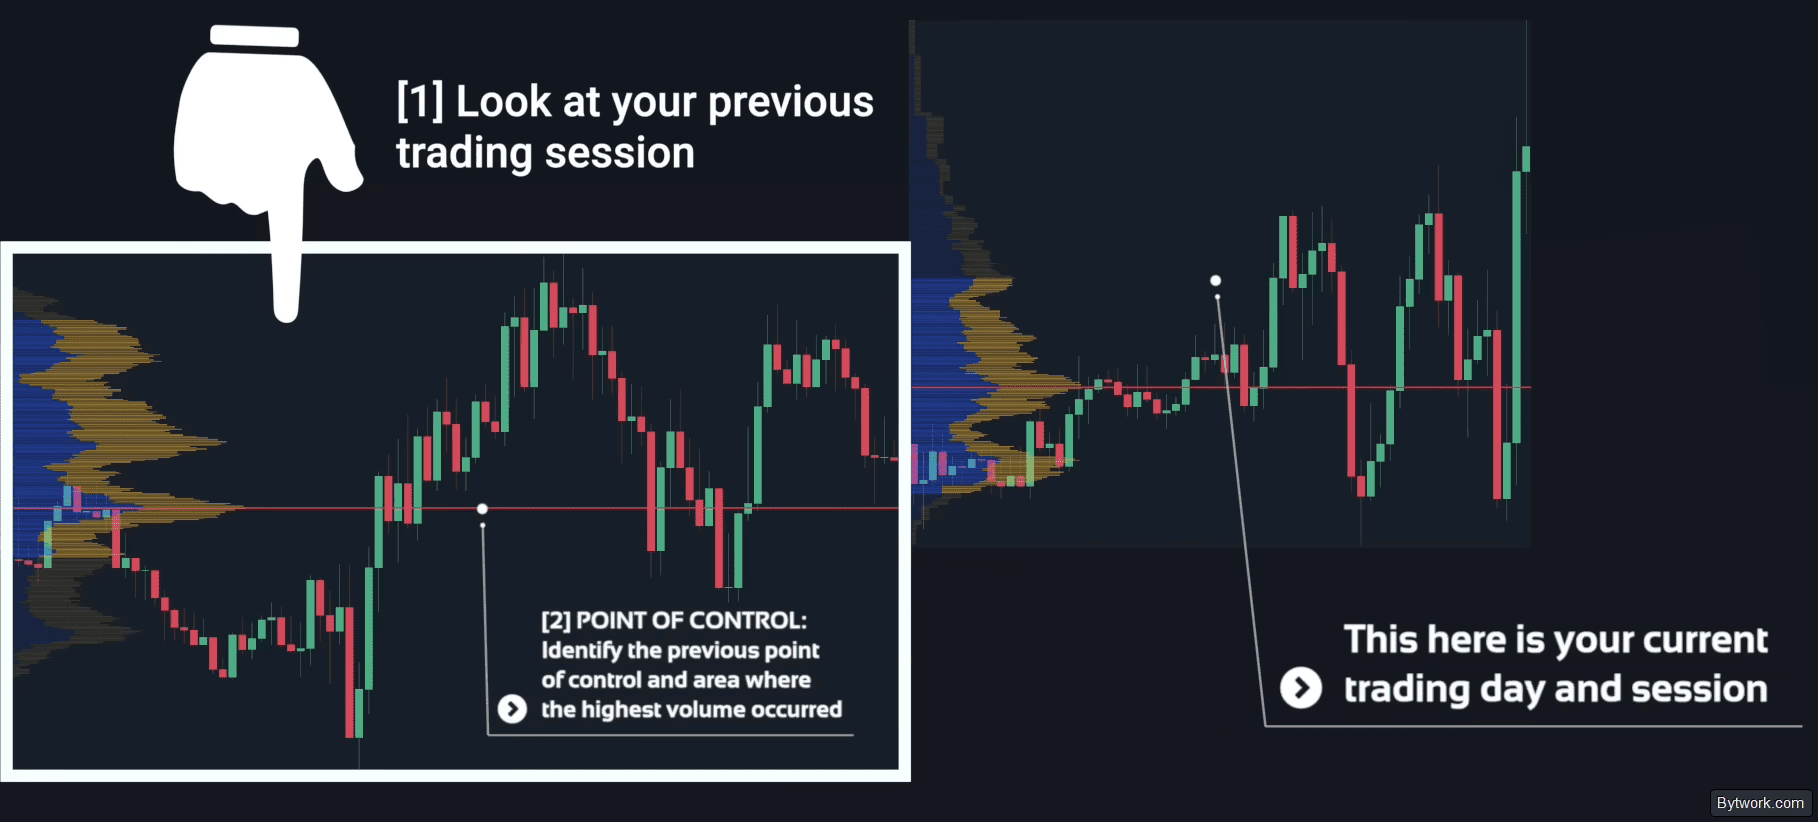
The logic is simple. If a certain price level saw high interest and large volume yesterday, then when the price returns to that zone today, a repeat reaction is highly likely.
For example, when the price approaches yesterday’s POC and forms a long‑wick candle with a color change, it can serve as a buy signal.

Similarly, if a double bottom pattern forms in the same zone, that also provides a quality entry point for a long position.
Use the past session, not the current one, because volumes within the current day change in real time and on lower TFs often give false signals!
Practical Examples of Using the Volume Profile
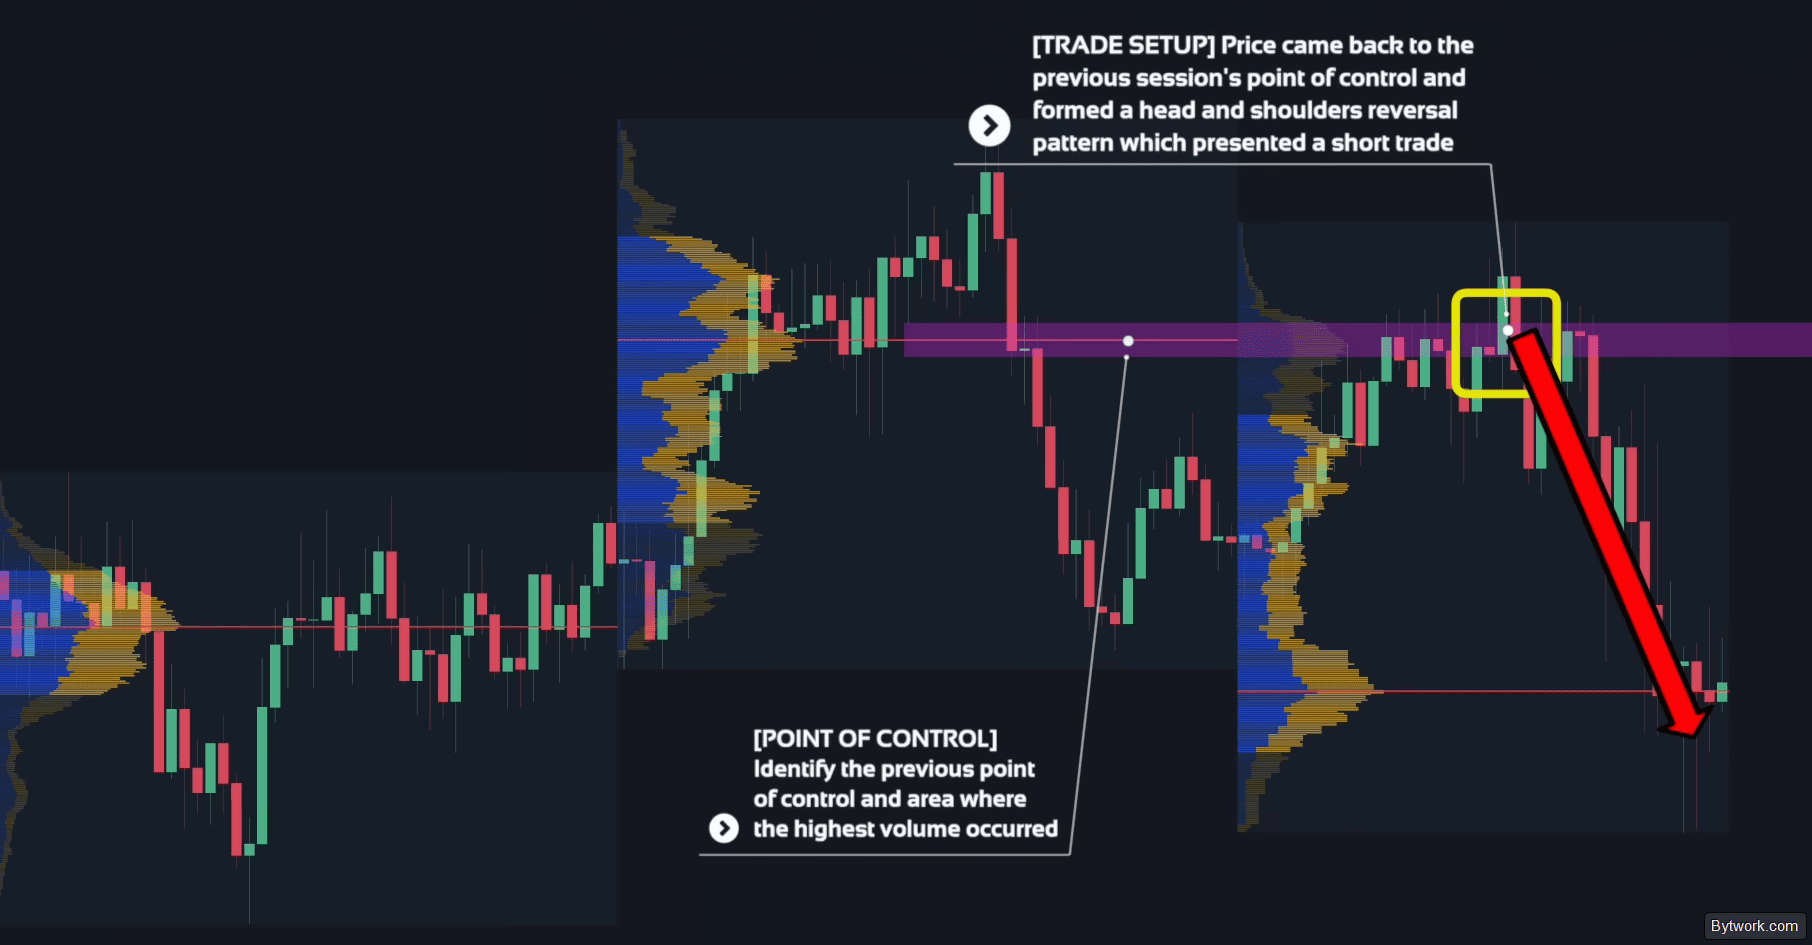
Let’s solidify the material by looking at a trading setup based on a return to the POC:
- The reference will be the Point of Control (POC, maximum volume zone) of the previous session.
- The signal – if the price of the current day returns to the POC and forms a candle with a long wick (pin‑bar).
- We enter the trade after the short position is confirmed by an intraday break of structure.

Example 1 – POC zone reaction
Let’s look at another practical example:
- The POC and high‑volume zone of the previous day serve as reference points for the current session.
- When the price returns to the traded shelf after an intraday break of structure, we enter the trade.
- Candlestick patterns or a breakout of a trendline serve as confirmation signals.
- Result: precise entry points for buy/sell (e.g., a Head and Shoulders pattern).
Example 2 – combining with patterns
We expand the approach by combining the Volume Profile with other patterns. Use POC zones as wide support/resistance areas. If a reversal pattern (e.g., a double bottom) forms in such a zone and a strong bullish engulfing candle appears, it gives a clear edge for an upward move.

Confirm the trend change, wait for a pullback to a key support level, and look for an entry on very small timeframes according to your standard entry/exit strategy.

Moreover, after the first move, there is often a second entry on a continuation – at a newly formed support level, where the entire previous price impulse acts as a trigger for further upward movement.

Example 3 – combination with a trendline
Another example. Use a combination of reversal points, candle shadows, and an imperfect double bottom within the previous POC zone.
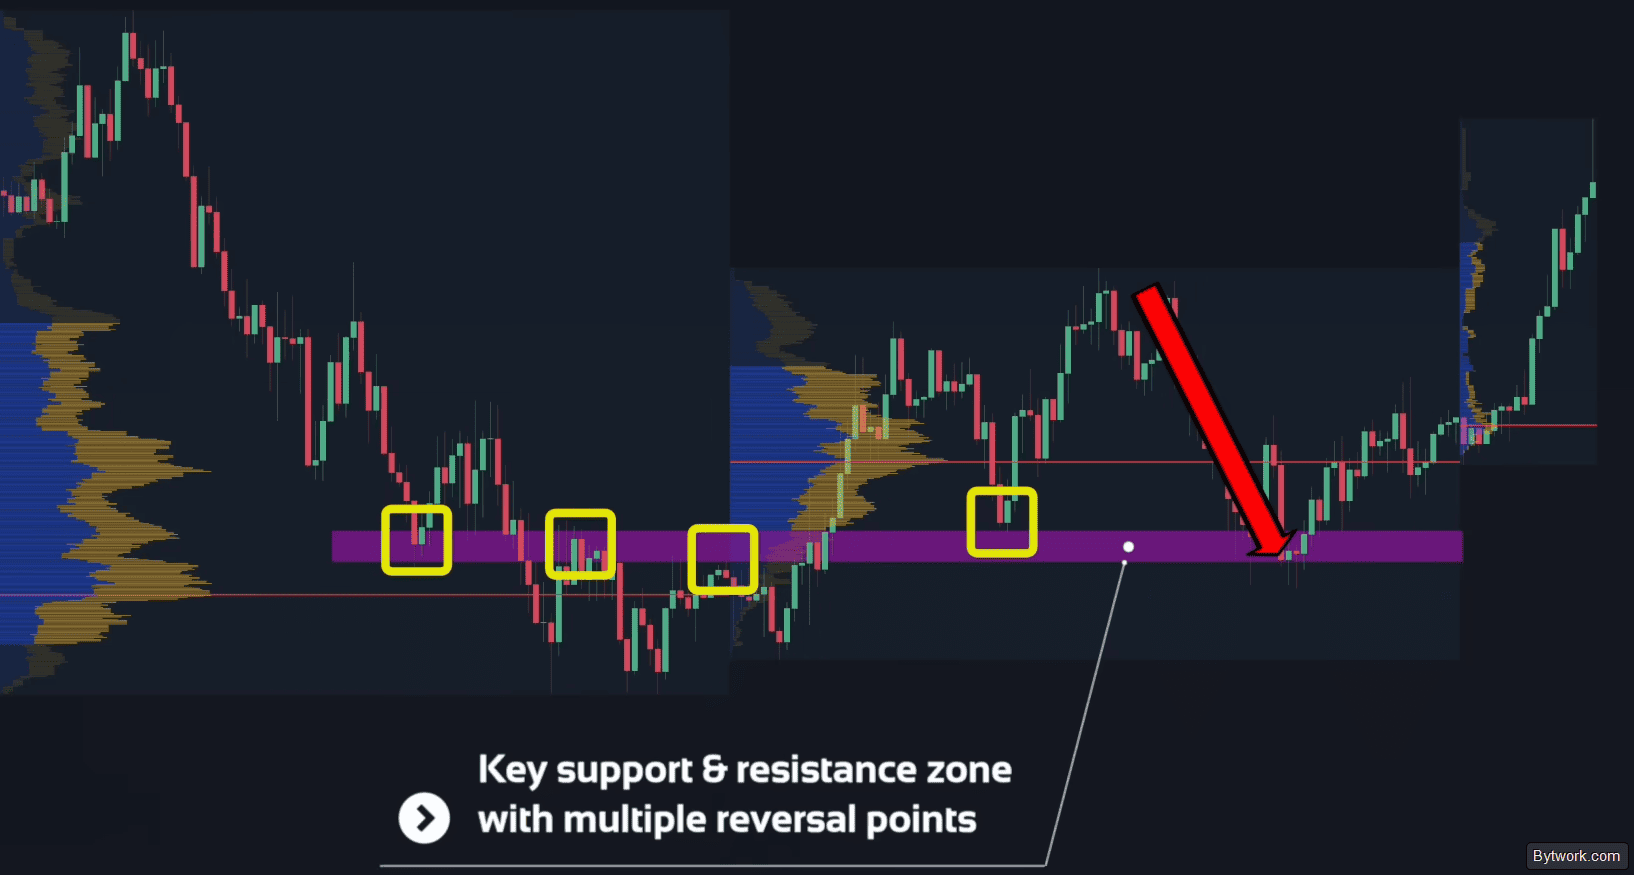
Add a trendline – and as soon as the price breaks it, look for an entry on the lowest intraday timeframes.

Remember: the more factors (volume, patterns, levels, trendlines) converge in one area, the higher the probability of a successful trade!
How to fine‑tune the Volume Profile in TradingView?
The default 24 rows in TradingView blur the image mercilessly. In practice, you should set between 200 and 1000 rows, switching the display to Number of Rows, and for scalping, set Ticks per Row in the range of 5–10.
The colour scheme should be comfortable. Neutral background for the histogram, a contrasting and bright POC, transparency in the 10–40% range, and fill width 30–40%.

Next, set volume to Total. Adjust the Value Area to your needs – standard 70%, expert Core 40%, or mathematically verified 68%.
Be sure to activate the Extend POC Right function until price touches it.
It is important to remember that TradingView roughly approximates tick data, bypassing real L2 and exchange order books.
Three options are available for use:
- free FRVP for impulses,
- paid session SVP for intraday,
- and dynamic VRVP for history.
Our battle‑tested strategy is to drop an FRVP with 400 rows, a Core 40% value area, and POC line extension.
Volume Profile Confluences
Combining the Volume Profile with the VWAP indicator brilliantly highlights price confluences for a deep understanding of the market auction. The Profile captures the distribution of liquidity at specific prices, while VWAP shows the dynamic volume‑weighted average price for the selected period.

The highest A+ signal accuracy is guaranteed by a clear alignment of horizontal volume and dynamic lines. A strong reversal trigger is the confluence of the POC level with the first standard deviation line of the weekly or daily VWAP.
High‑volume nodes clearly confirm VWAP value zones. From experience, testing such a node from above while price is above VWAP confirms a bullish trend. Low‑volume zones often intersect with a strong deviation from VWAP and signal a fast price‑discovery phase due to severe lack of liquidity.
|
Category |
What to use? |
|
RSI / MACD |
RSI and MACD are classical indicators that professionals consider less effective than the Volume Profile. The Profile is called a “money indicator” because it records real transactions, not derivatives of price. Trading solely on volume levels without price context yields a win rate comparable to trading support levels and RSI alone. |
|
Used only as an additional trend filter. The Volume Profile is considered faster because volumes always lead price. In strategies with Volume Delta, moving averages are recommended to be turned off to see the pure volume distribution data. |
In practice, we use the Volume Profile together with Fibonacci, Elliott Waves, and the Double Top pattern.
|
Method / Pattern |
Essence of confluence |
|
POC levels gain significantly more power when they coincide with retracement levels. The most accurate signals occur when the impulse POC merges with the 0.618 or 0.5 levels. |
|
|
Using them together seriously boosts results. The Profile is applied to specific waves (e.g., the trending third or corrective fourth) to catch the end of corrections. |
|
|
The appearance of this structure on lower timeframes is the first sign of a base forming (D‑shaped profile) and the start of consolidation. |
Let’s not forget professional institutional concepts.
|
Concept / Pattern |
Application together with the Volume Profile |
|
Used within SMC to capture a shift in market character. The Volume Profile verifies this pattern – if the break of structure occurs on an exit from a large HVN (shelf), the chances of profit soar to the level of an institutional footprint. |
|
|
ICT trading (FVG, order blocks) |
FVG price gaps are filled in about 43% of cases. When the FVG coincides with an LVN zone and occurs immediately after a POC test, the entry accuracy increases manifold. An order block is considered valid ONLY if it lies inside an HVN; formations within LVN boundaries are usually ignored by large capital. The Volume Profile acts as a kind of X‑ray for the ICT trader – it gives the chance to scan the real positions of market makers, saving you from blind trading based on pictures. |
Now for the strategies.
Volume Profile Strategies
Let’s look at 3 of our trading strategies using the Profile, their logic, targets, and entry points.
Strategy 1 – “the 80% rule”
The strategy’s logic is based on the probability that price will traverse the entire Value Area (VA) range after a retest of that zone.
- Workspace setup
- Session Volume Profile – session volume profile.
- VAH and VAL – the upper and lower edges of the previous session’s VA (RTH).
- Entry conditions
- Opening – when price is outside the previous day’s VA (above VAH or below VAL).
- Return – when price moves back inside the previous day’s VA.
- Confirmation – at least two 5‑minute candles have closed inside the VA range.
- Triggering the trade
- Short – a drop into the VA from above.
- Long – a spike into the VA from below.
- Setting targets
- Take‑profit – the opposite edge of the VA (on entry from VAL, set target at VAH).
- Stop‑loss – placed beyond the entry edge or behind the nearest Low Volume Node (LVN).
Strategy 2 – “the 40% institutional core”
This strategy catches precise trend entry points by narrowing the standard Value Area.
- Structure reading
- Long – formation of a new high.
- Short – formation of a new low.
- Profile adjustment
- Fixed Range Volume Profile – stretch it from the previous extreme to the new one.
- Value Area Volume – change the parameter from the standard 70% to 40%.
- Goal – to highlight the dense trading core of large players.
- Entry point
- Pullback – wait for a correction to the boundaries of the 40% core.
- Fibonacci – this zone often coincides with the 0.5–0.618 levels.
- Entry – enter on the first touch of the core boundary in the trend direction.
- Profit taking
- Take‑profit – a break of the current extreme or the next large High Volume Node (HVN) from a higher timeframe.
Strategy 3 – “the failed auction”
The strategy’s logic is built on collecting liquidity beyond the VA boundaries followed by a sharp price reversal.
- Marking levels
- Volume Profile – place it on the current consolidation or past session.
- Boundaries – fix the VAH and VAL levels.
- Conditions and triggers
- False breakout – an impulsive spike outside the VA on low vertical volume.
- Manipulation – a pin‑bar, hammer, or engulfing pattern with a return and close inside the VA.
- Confirmation – a spike in relative volume on the signal candle.
- Executing the trade
- Entry – open the position immediately after the signal candle closes inside the VA.
- Stop‑loss – placed beyond the false breakout extreme.
- Take‑profit 1 – the POC level.
- Take‑profit 2 – the opposite edge of the VA.
Q&A on the Volume Profile
In practice, using the Volume Profile sometimes differs from pure theory. We’ll explain this in this Q&A section.
Data accuracy
- Why can TradingView’s built‑in Volume Profile be inaccurate?
- TradingView uses heuristic approximation instead of real tick data and gives only an approximate volume distribution. The margin of error is acceptable for contextual analysis but completely unsuitable for scalping.
- What is the difference between real volume and tick volume?
- Real volume counts every contract based on exchange data (CME), while tick volume only records price changes and ignores the number of contracts. As a result, tick volume shifts the POC and reduces the accuracy of the Value Area.
- Why is it not recommended to use the current day’s Volume Profile on lower timeframes?
-
The current day’s profile constantly changes on a 15‑minute chart and generates false signals. It is more reliable to use static Points of Control and maximum volume zones from the completed previous session.
Fine‑tuning the Profile
- How to choose the right anchor point for the Volume Profile?
- The Profile is anchored to the start of an impulse or a reversal extreme to calculate data within a specific move. Anchoring to the entire historical period blurs the accuracy of identifying significant price zones.
- Which Profile setting is mandatory before use?
- It is essential to increase the number of rows in the Inputs section from 24 to 400. This drastically improves the resolution and accuracy of the POC and Value Area boundaries.
- What important levels are hidden in the default Volume Profile settings?
- The upper and lower Value Area boundaries (Value Area High and Value Area Low) are hidden by default. Enabling them brings two clear zones with 70% of traded volume onto the chart, which act as strong support and resistance.
Practical trading strategies
- Where should you place stop‑loss and take‑profit when trading with the Volume Profile?
- The stop‑loss is placed in a low‑volume zone beyond the high‑volume barrier to protect against a breakout. The take‑profit is placed before a high‑volume zone that may become a strong support or resistance level.
- What is the 80% rule and under what condition does it work?
- When price enters the Value Area of the previous session, it has an 80% probability of reaching the opposite boundary. The rule only works if the market confirms a hold inside the zone.
- How do you combine VWAP and the Volume Profile to increase the probability of a trade?
-
The signals of these indicators add up without priority of one over the other. A coincidence of the VWAP level or its deviation with an important Profile level such as LVN, POC, or a Value Area boundary creates a confluence that increases the reliability of the entry in the 4 main models.
- How to distinguish a genuine bullish profile (P‑shape) from a false one?
-
A genuine profile has heavy volume at the top and a thin tail at the bottom, and the daily candle must close above 50% of its range. Without this condition, the pattern is not considered valid.
Free alternatives to the paid indicator
- Is it worth buying a paid TradingView subscription for the Session Volume Profile indicator?
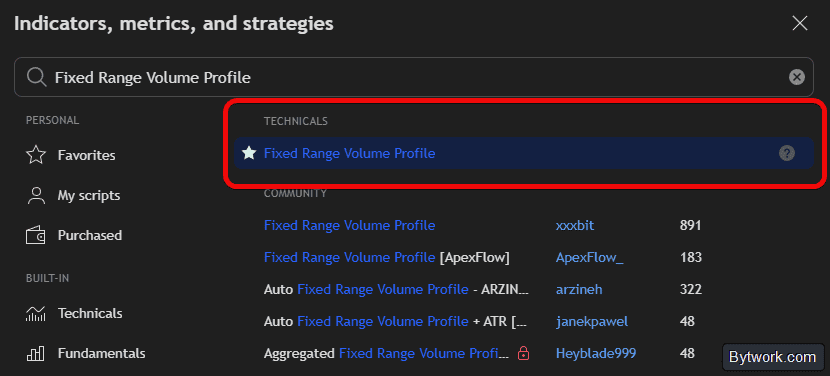
- It is not worth buying a subscription because the free Fixed Range Volume Profile functionality provides identical information when you manually highlight trading days. The paid subscription is only justified for automatic labelling to save time.
- How can you get past session data without a paid indicator?
- To get the data, take the free Fixed Range Volume Profile script and manually highlight the range of each past day. The resulting Points of Control and Value Areas will fully match those of the paid Session Profile.
Value Areas and real statistics
- What numerical values are used for Value Areas?
- For a general perception of fair value, a wide zone of 70% of volume is used. To precisely highlight key supply and demand zones, a narrower boundary of 40% is applied.
- How does deviation from Gaussian distribution affect the interpretation of single‑point tails and initiative moves?
-
Due to deviations from normal distribution, zones with few TPOs may arise from uneven order flow. Nevertheless, such extremes often act as strong support and resistance levels in practice.
- What percentage of volume falls within the first standard deviation?
-
In theory, the first standard deviation contains 68% of volume; in practice this figure is rounded to 70%. This metric means that the bulk of the session’s trades occur within this price range.
- Why is the Value Area based specifically on 68% TPO rather than, say, 50% or 80%?
-
The 68% value is taken from the Gaussian model as a theoretical basis. In practice, the actual time‑at‑price distribution does not match it, so traders round the number to 70% for convenience.
- Does a green volume bar mean that buying predominates?
- No. The colour of the volume bar simply duplicates the colour of the candle above it. In every trade, a buyer and a seller participate simultaneously, so the colour does not reflect the activity of either side.
What are the drawbacks of the Volume Profile?
Like any other indicator, the Volume Profile is not a holy grail. It has several drawbacks and risks, which we will review in the 3 tables below.
Interpretation errors and subjectivity that can lead to loss of capital.
|
Risk |
When the Volume Profile breaks down |
|
Macro news shocks |
CPI releases, FOMC, and other triggers instantly destroy profiles. Price flies through Low Volume Nodes (LVN) with huge slippage. |
|
Opening manipulation |
In the first minutes of the session, the execution of old limit orders forms false High Volume Nodes (HVN). |
|
TF conflict |
Overlaying daily, weekly, and composite profiles gives an excess of intersecting levels and analysis paralysis. |
|
Illusion of prediction |
Essentially, the method is strictly historical. It states a past fact but does NOT GUARANTEE the presence of a large player in the future. |
|
Subjectivity of shapes |
Perfect patterns (P, B, D, Thin) do not exist. An interpretation error (e.g., a candle closing below half of the P‑profile range) turns a bullish signal into a bearish trap. |
The next table describes the technical complexities of the indicator and the fact that it is heavy on the PC. To obtain clean data, some traders have to buy terminals, which is not always practical.
|
Risk |
Hard facts |
|
Data distortion |
Popular charting platforms like TradingView use tick approximation rather than a direct L1/L2 order flow. From experience, this seriously distorts the POC and Value Area on small timeframes. |
|
High initial cost |
To obtain clean CME and crypto exchange data, you have to buy terminals like ATAS, Deep Charts, Sierra Chart, and also pay for data feeds. |
|
Hardware load |
Setting deep detail in the 400–1000 row range heavily loads the CPU and GPU. |
Finally, let’s look at market dead ends and indicator limitations tied to market phases.
|
Drawback |
Specifics |
|
Low signal frequency |
This method of analysis is sluggish. It takes a long time to draw a proper Gaussian curve, so quality setups occur rarely. |
|
Chop inside the VA |
Inside the Value Area (especially around the POC), the market is balanced. Movement is chaotic, so the probability of a setup playing out is minimal. |
|
False weekend (Crypto) |
Saturday and Sunday profiles give false signals due to the absence of institutional liquidity. |
|
No guarantees |
Price often cuts through the POC or VA boundaries with almost no reaction if an aggressive market buyer or seller dominates the market. |
The danger of the Volume Profile lies in using it blindly, detached from price context and fundamental factors. Without understanding the mechanics of the auction, this analysis method turns into a collection of random horizontal lines on a chart.
Time to move on to conclusions.
Afterword
The Volume Profile may seem complicated at first, but after a little practice it becomes one of the highest‑probability advantages you can add to your trading. Just remember our 5‑step checklist:
|
|
Step |
Action |
|
1 |
Setup |
Set Row Size in the range of 400–1000 rows. Switch volume type to |
|
2 |
Context |
Stretch the profile over the last 5 trading sessions. Read the profile geometry – D (balance), P (bullish long), B (bearish short), or Thin (impulse breakout). Apply the 50% filter – for a P‑shape, the close must hold above the middle of the range; for a B‑shape, below it. |
|
3 |
Entry |
Wait for the first test of the POC, VAH, or VAL zones. Place a limit order at the outer edge of the volume node (do not place the order exactly on the POC line). Wait for a trigger – a pin‑bar, doji, or engulfing pattern on increased vertical volume. Strengthen the entry point with confluence from Fibonacci (0.5–0.618), a VWAP line, or a classical strong level. |
|
4 |
Management |
Apply the 80% rule – if quotes have held inside the |
|
5 |
Filters |
Do not open positions inside a dense POC during chop and sideways movement – there you will only collect market noise. Close positions 5 minutes before major macroeconomic news releases and do not enter the market for another 10 minutes after the release. Do not try to enter a reversal inside extreme vacuum zones (LVN) – large players break through them impulsively with almost no resistance. |
If you remember the 4 dimensions of market structure, you will be able to integrate the Volume Profile into your trading system.

Afterword: We have been trading since 2018 and have tested hundreds of strategies and indicators. Your editor – Pavel Grachev for bytwork.com.

Now reading


In DePin, people create networks themselves, share traffic or capacity, and receive rewards in tokens from these projects.