Elliott Waves: how to Enter Trades with a 1:10 Reward‑to‑Risk Potential – A Guide
In this guide, you will gain access to hidden techniques that most traders are unaware of. You will learn how to count and trade Elliott Waves correctly, master precise rules, combine Elliott Waves with Fibonacci levels, and explore all wave characteristics—equality, alternation, truncation, and targets. This knowledge will become your roadmap for understanding the market and accurately forecasting major price reversals. Waves work in crypto, stocks, and forex.
The Nature of Waves and Market Psychology
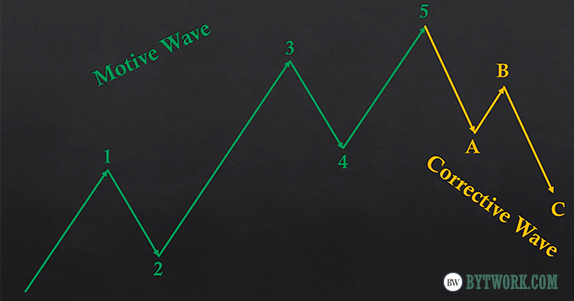
Elliott Waves are a technical analysis method based on identifying recurring market patterns of 5 impulse and 3 corrective phases, reflecting the cyclic psychology of market participants.
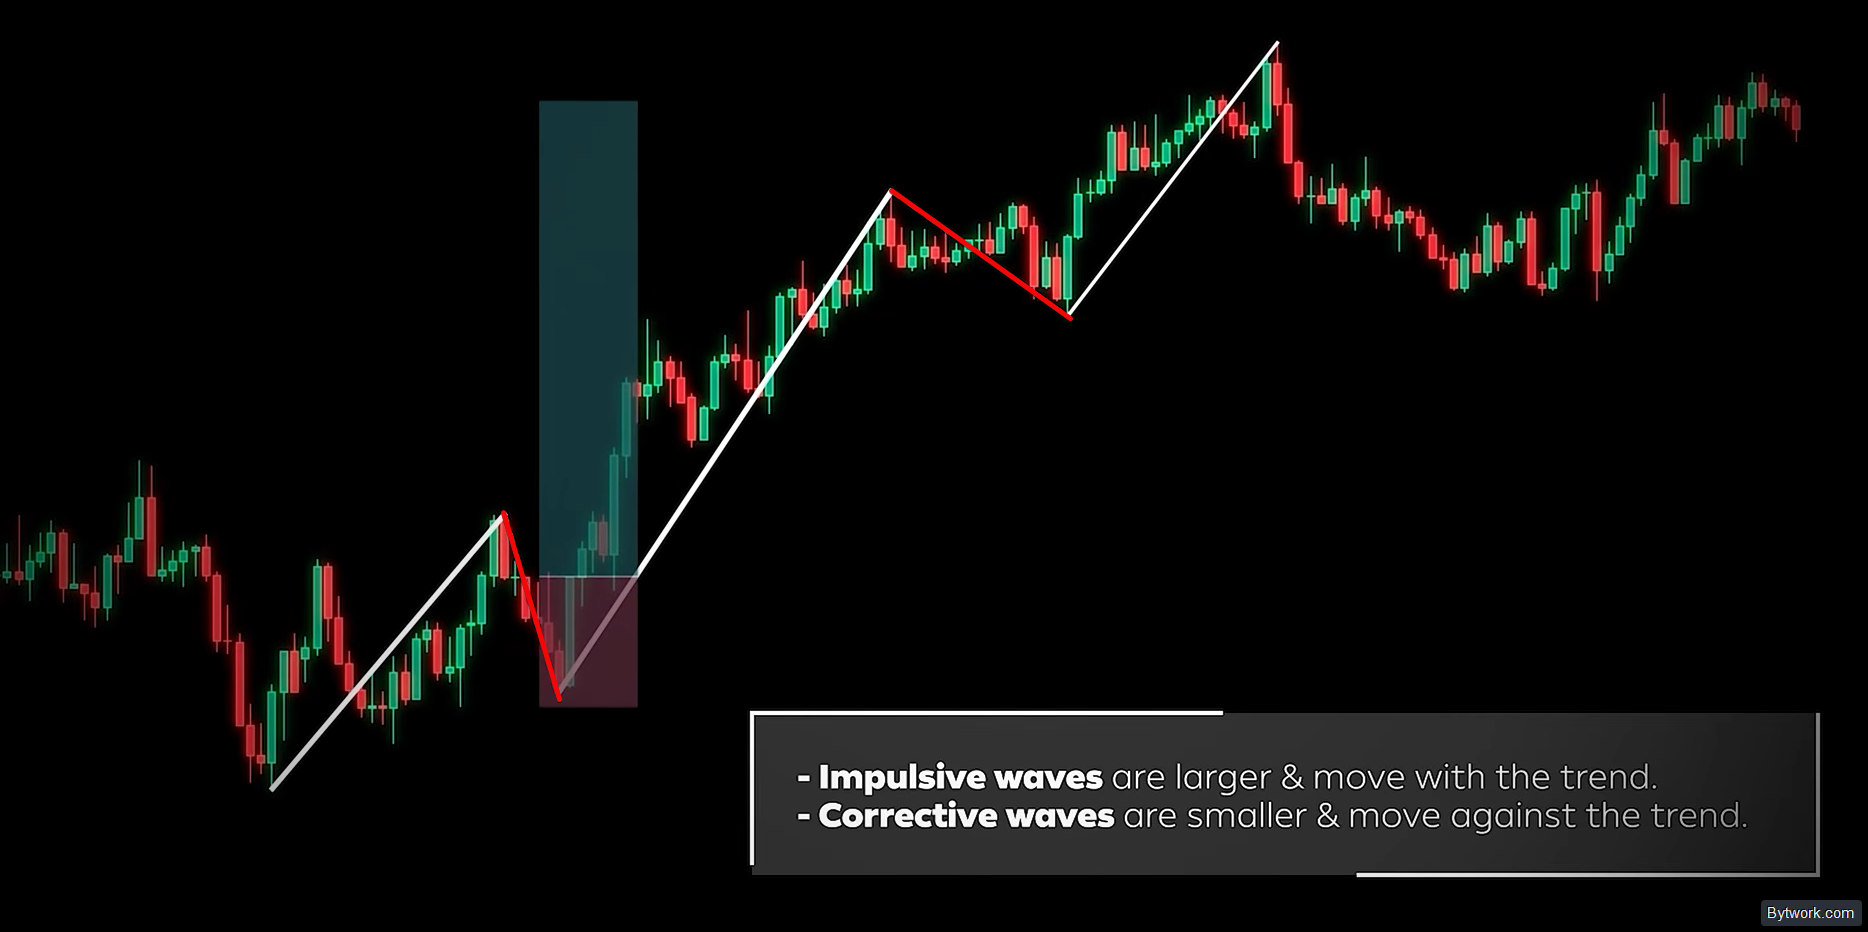
There are two types of waves:
- Impulse waves – drive the trend upward, providing the bulk of profit.
- Corrective waves – temporary pullbacks, suitable for entry points.
It is recommended to trade in the direction of impulse waves because they offer the greatest profit potential. Trend lines and moving averages help determine the direction of waves, filter out noise, and separate impulses from corrections.
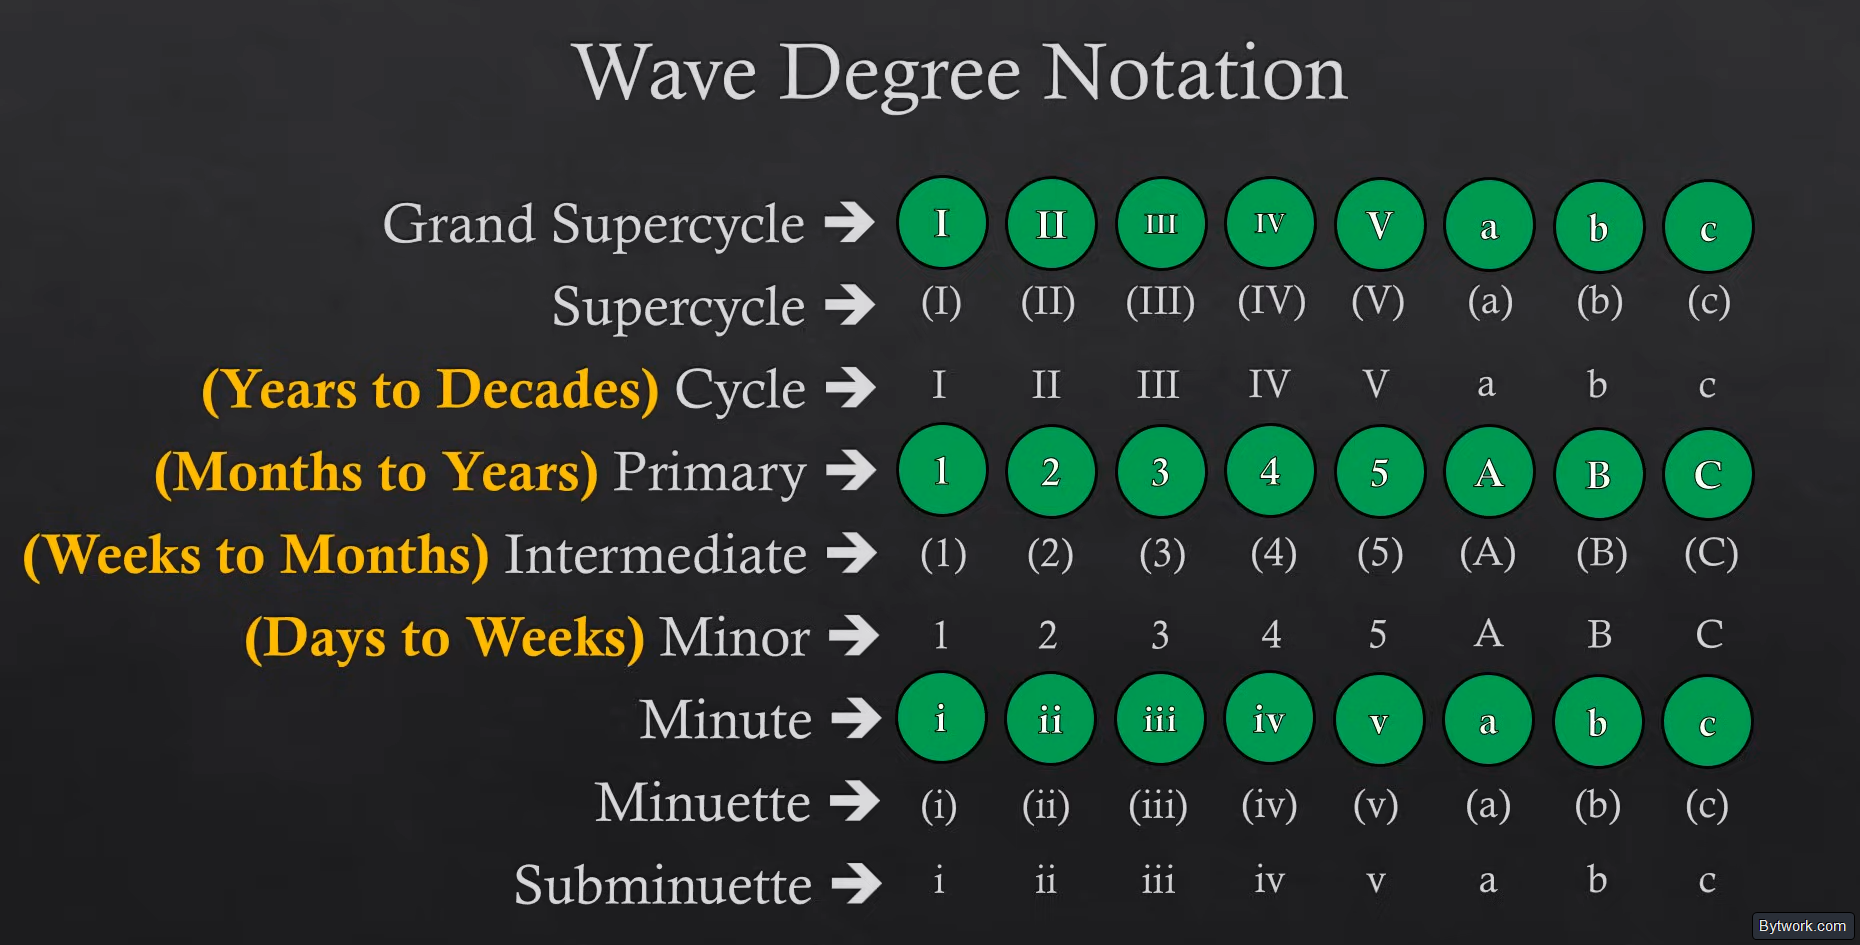
According to the theory, waves are divided into 9 degrees—from Grand Supercycle to Subminuette. In practice, however, tracking 3 degrees is sufficient.
Elliott Waves have three key elements:
- Basic 5‑3 pattern (the most important element).
- Vertical proportions of waves based on Fibonacci.
- Horizontal proportions of waves based on Fibonacci.
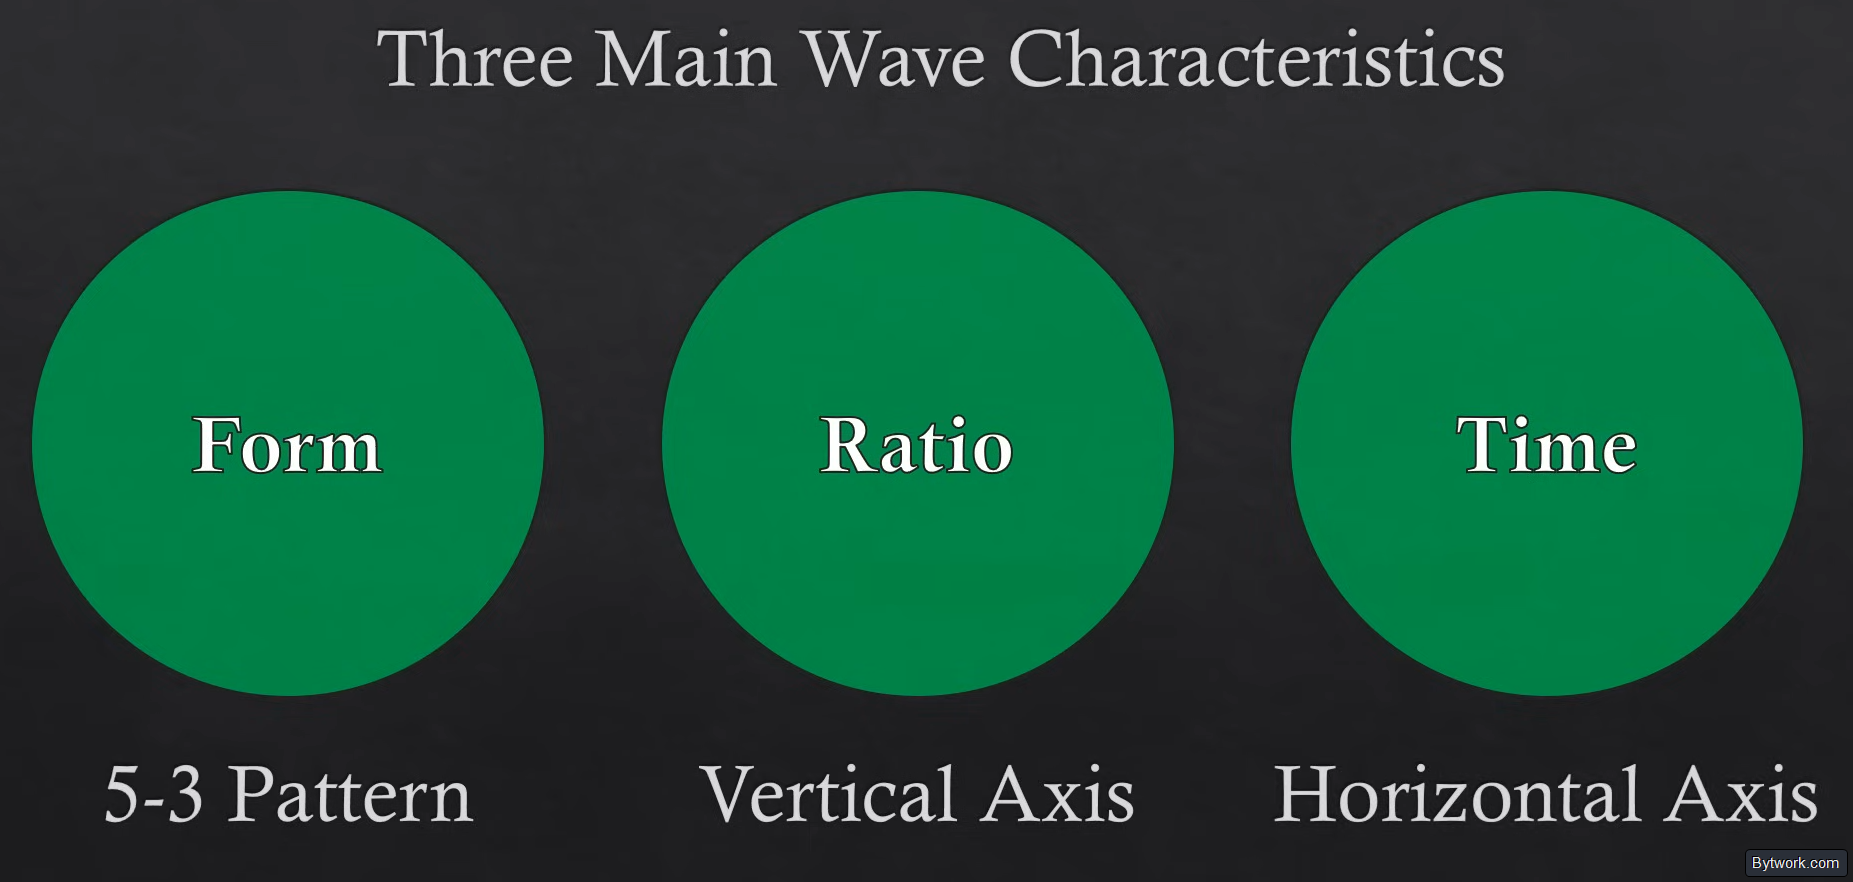
These elements have a strict hierarchy of importance—form always takes the highest priority, followed by ratio (price), and time comes last.
The 5 Waves in the Wave Cycle Structure
The Elliott market cycle consists of 5 waves of growth and 3 waves of decline. The trading strategy is based on buying during upward pullbacks and selling during downward ones.
Cycle structure and correction depth:
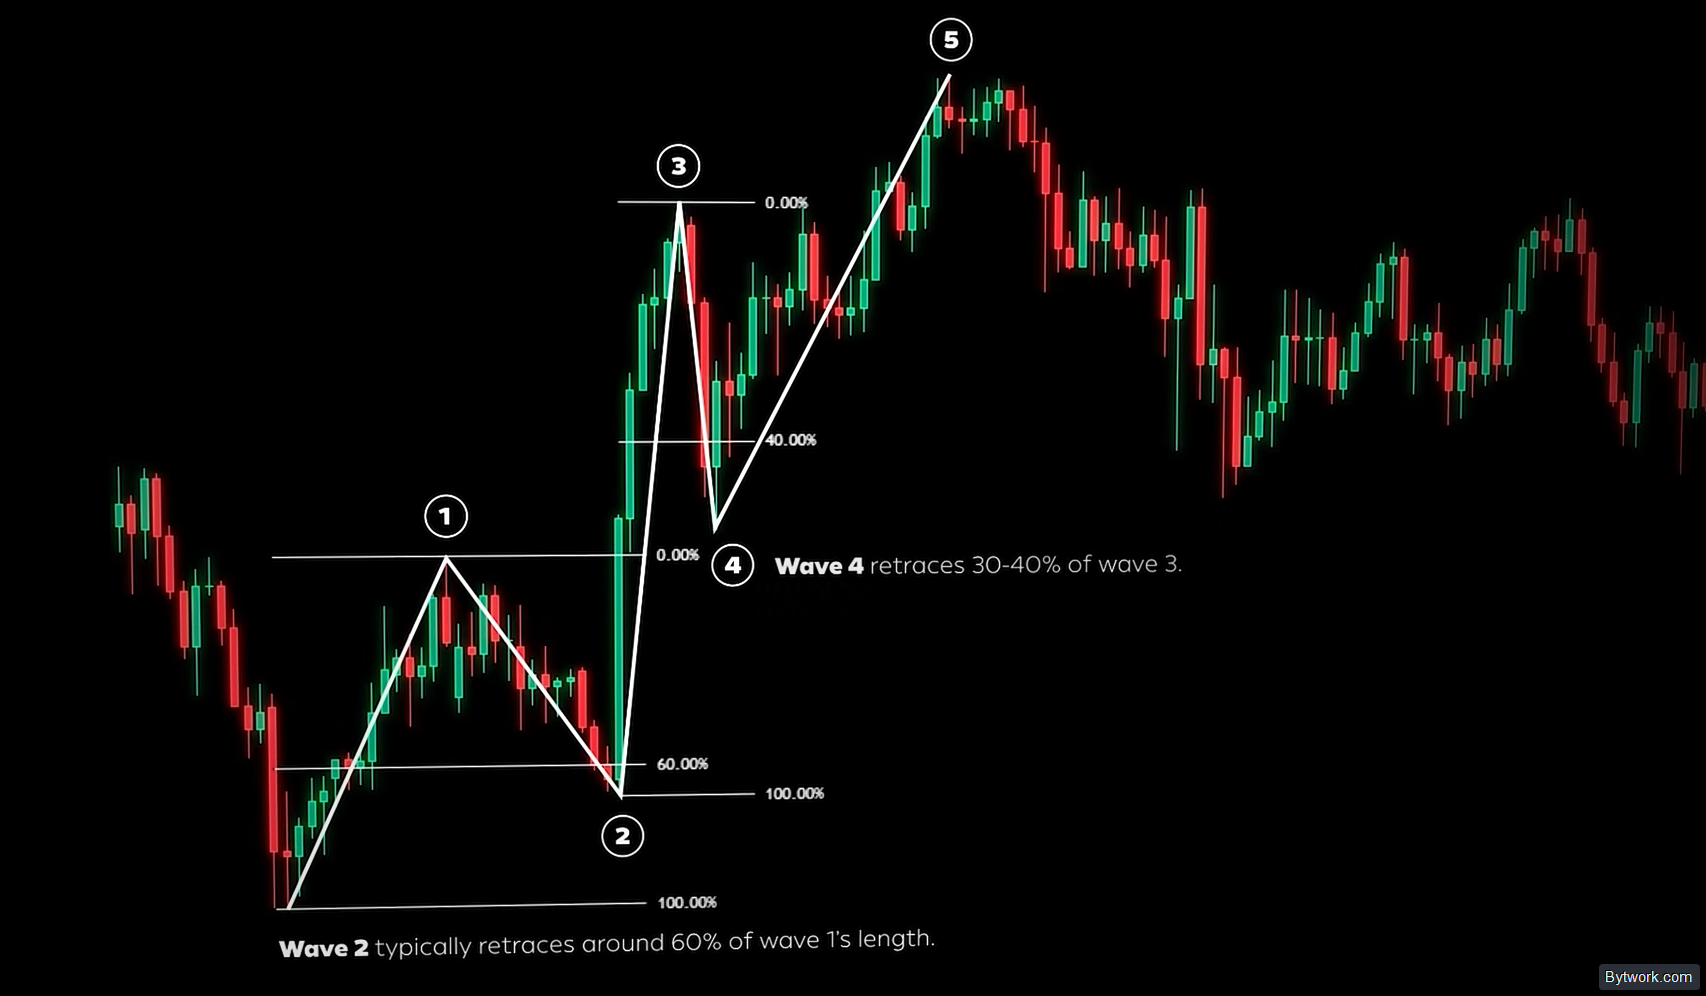
- Wave 1 – the first impulse upward, initiating a new uptrend. Traders often look for Change of Character (CHoCH) to confirm a real trend reversal.
- Wave 2 – the first correction, retracing about 60% of wave 1’s length.
- Wave 3 – the strongest and longest impulse upward in the cycle.
- Wave 4 – the second correction, typically 30–40% of wave 3’s length.
- Wave 5 – the final impulse upward, completing the uptrend.
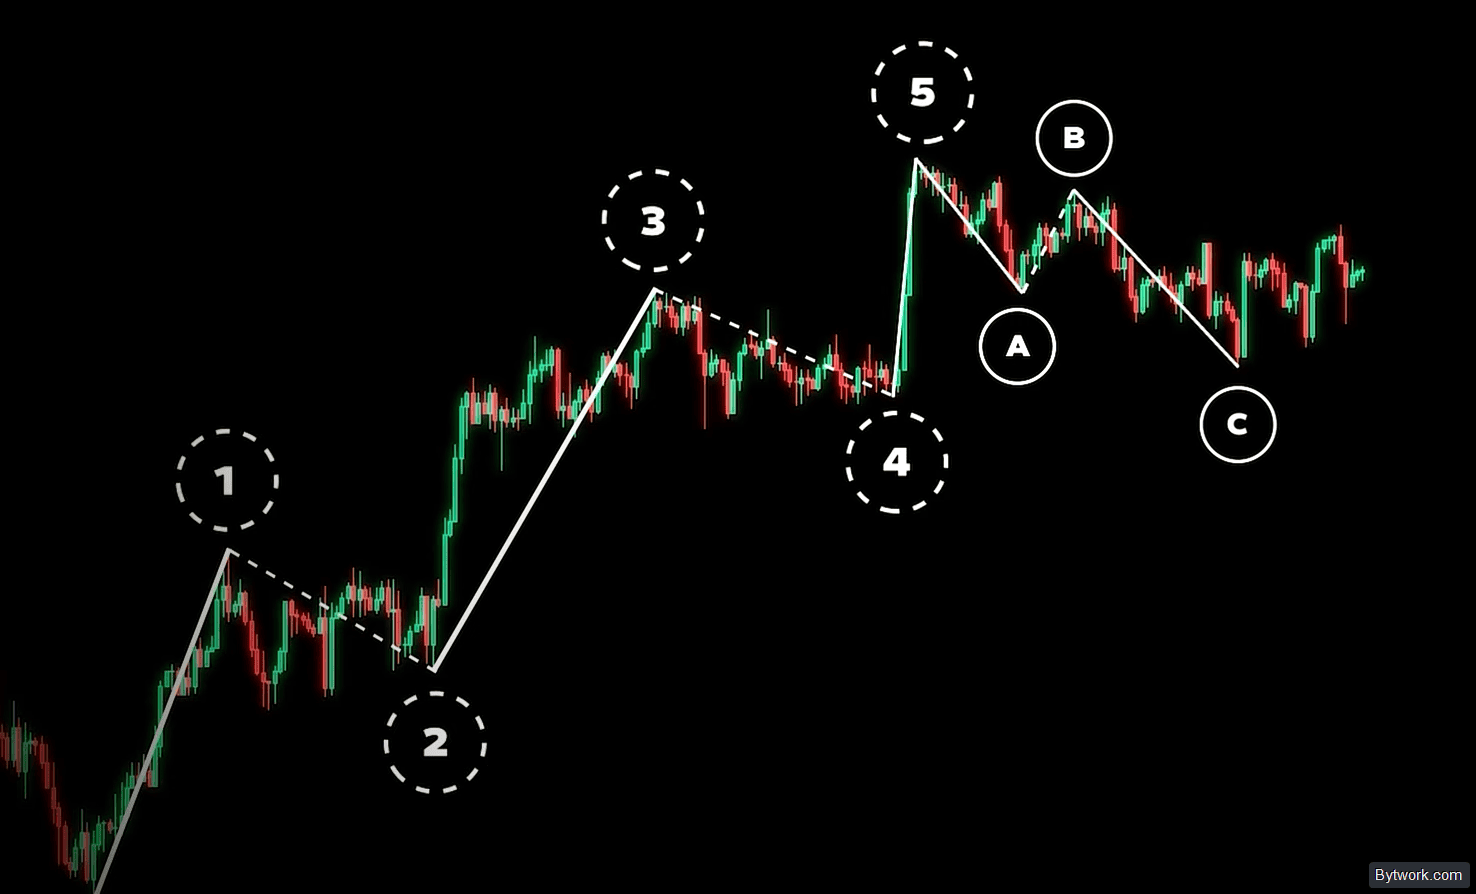
Then comes the decline. These are waves A, B, C – a downtrend consisting of 2 impulses down and 1 correction up.
The 3 Golden Rules
There are 3 golden rules that govern wave labelling:
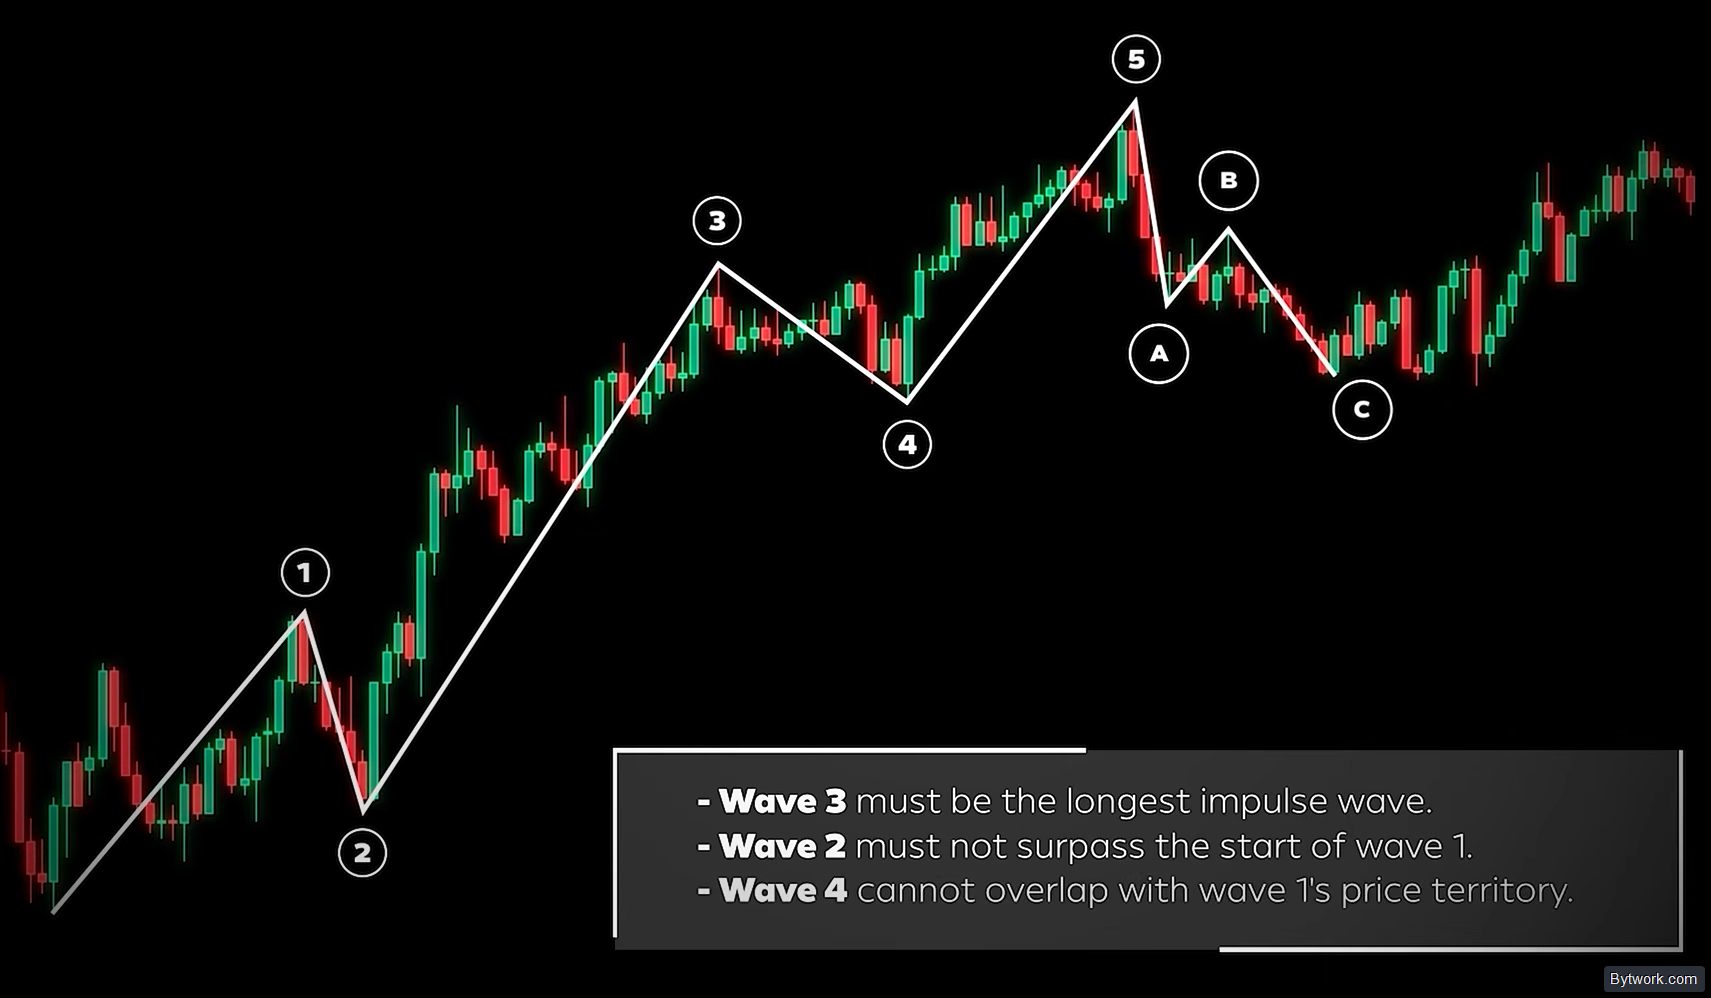
- Wave 3 must be the longest or the strongest impulse wave and cannot be the shortest;
- Wave 2 must not retrace beyond the start of wave 1;
- Wave 4 must not overlap the price territory of wave 1.
Violation of any of these rules invalidates the wave count.
In addition, 3 additional guidelines help refine the interpretation:
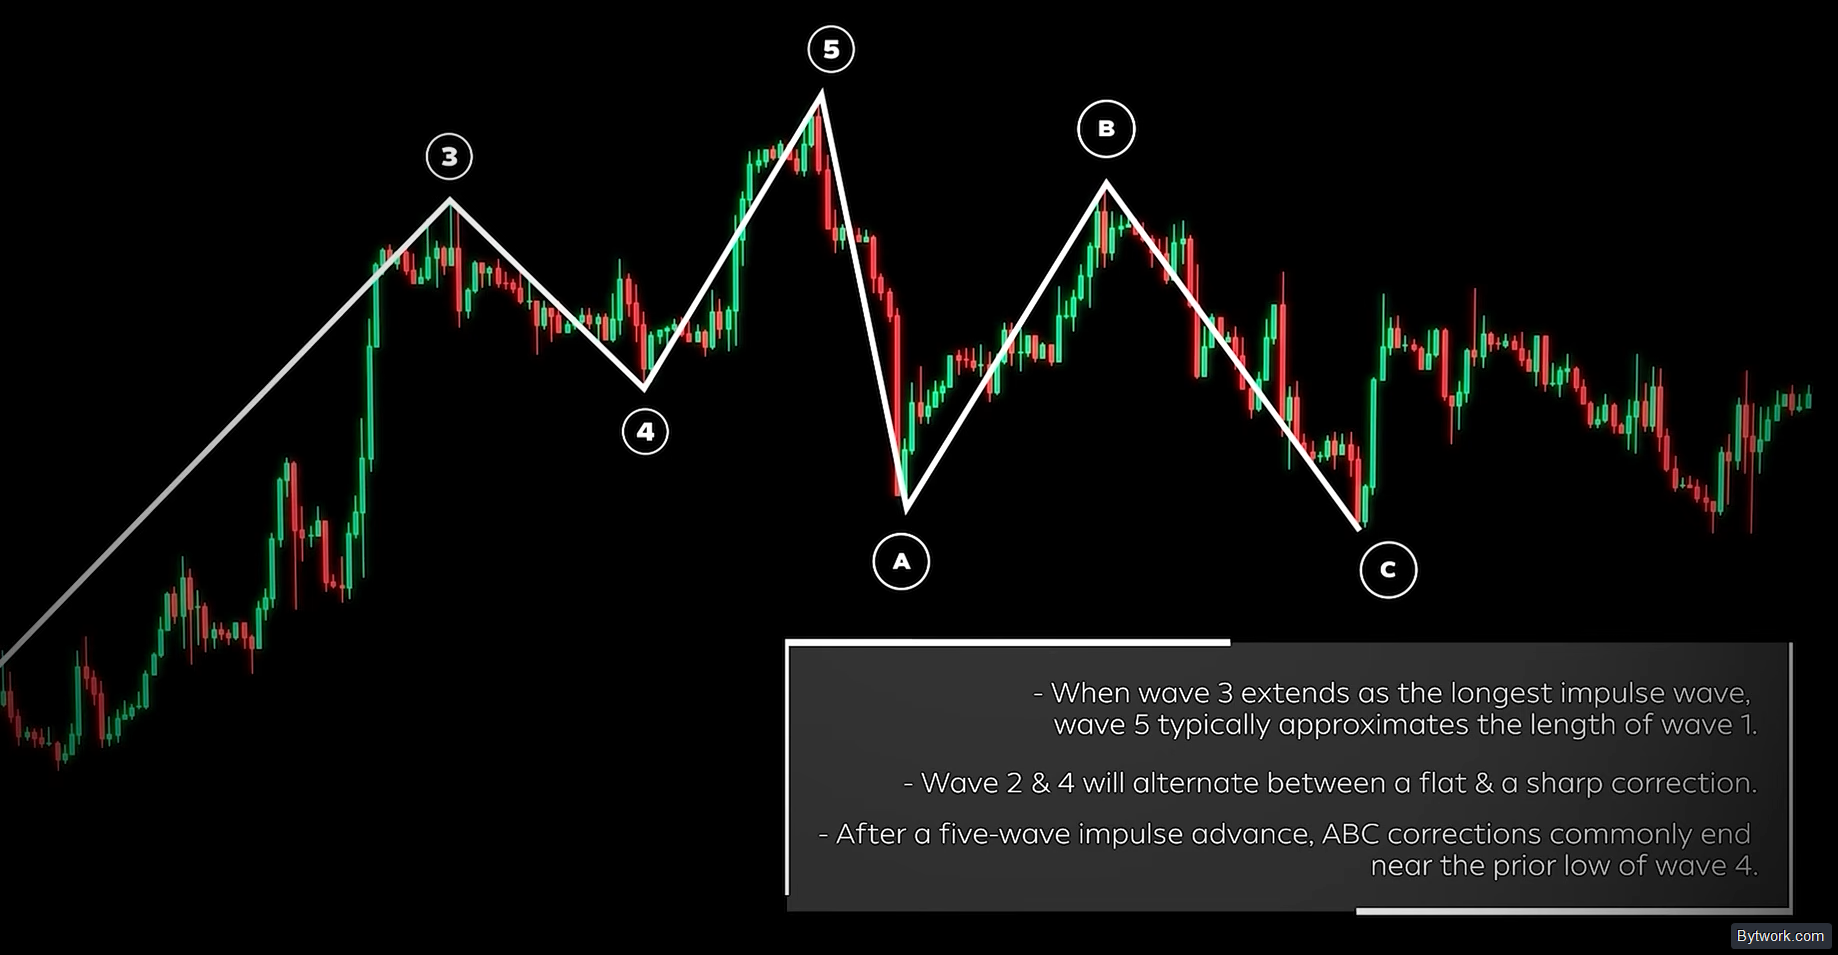
- First, when wave 3 is the most extended, wave 5 often approximates wave 1 in length;
- Second, waves 2 and 4 tend to alternate in structure – if wave 2 is a sharp correction, wave 4 often turns out to be a flat correction, and vice versa;
- Finally, after a five‑wave impulse advance, the ABC correction most often ends near the previous low of wave 4.
Applying Fibonacci in Wave Analysis
Combining Elliott Waves with Fibonacci levels helps traders pinpoint price reversals with accuracy.
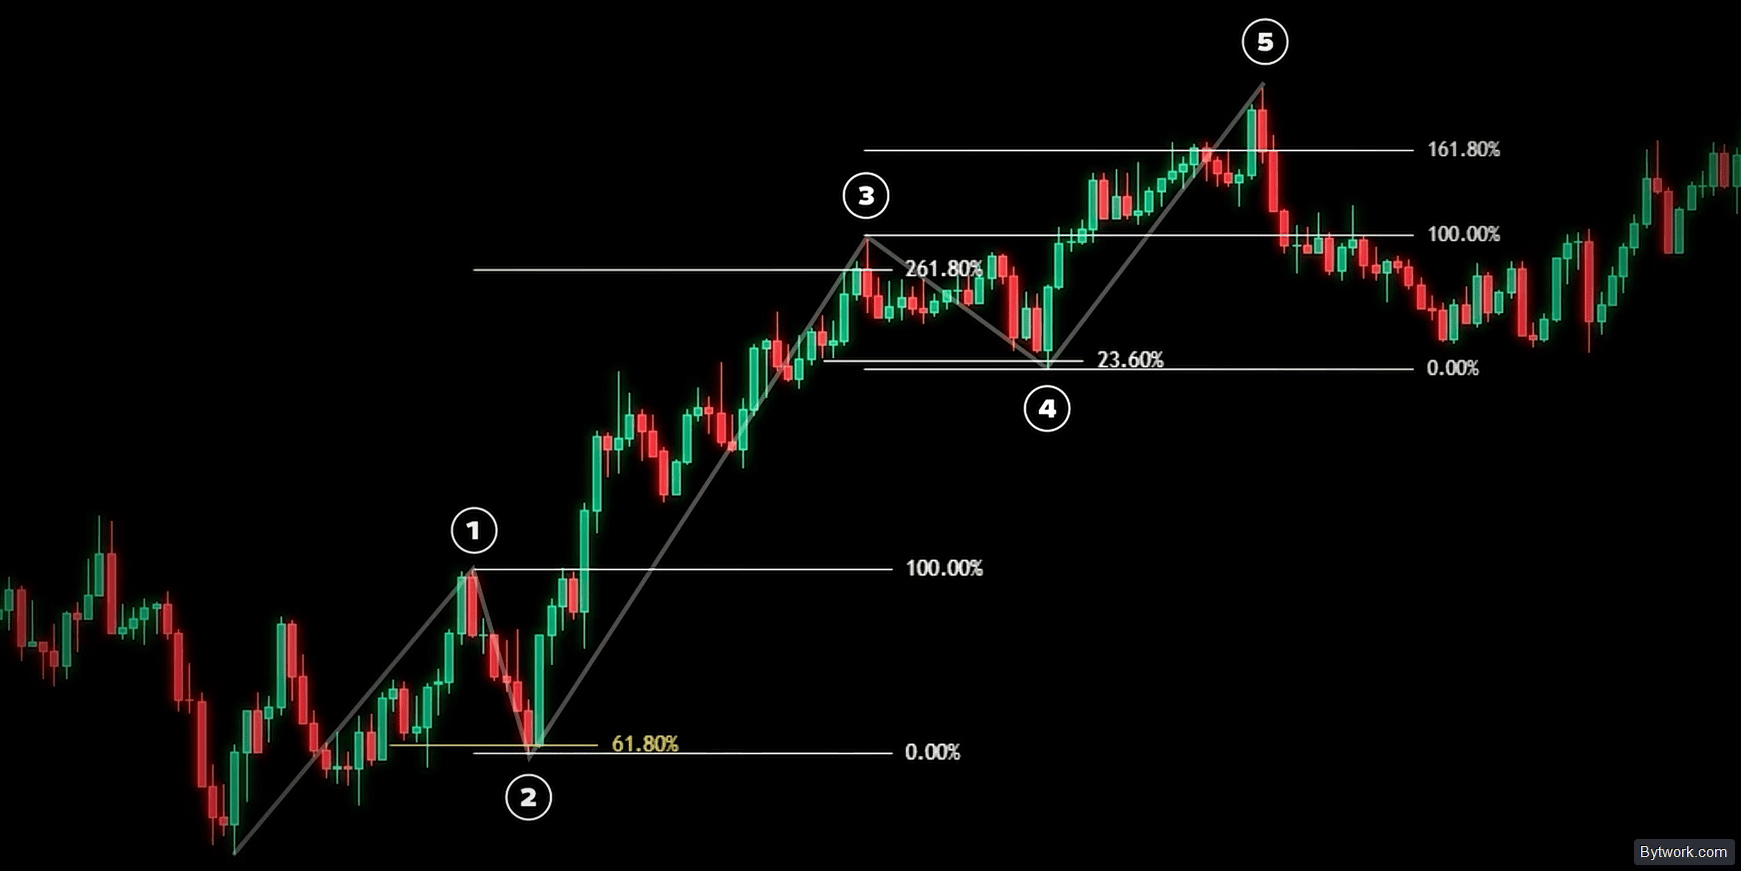
Price relationships:
- Wave 2 – retracement of 50% or 61.8% of wave 1.
- Wave 3 – extension to 161.8% of wave 1.
- Wave 5 – equals 100% or typically 161.8% of wave 1.
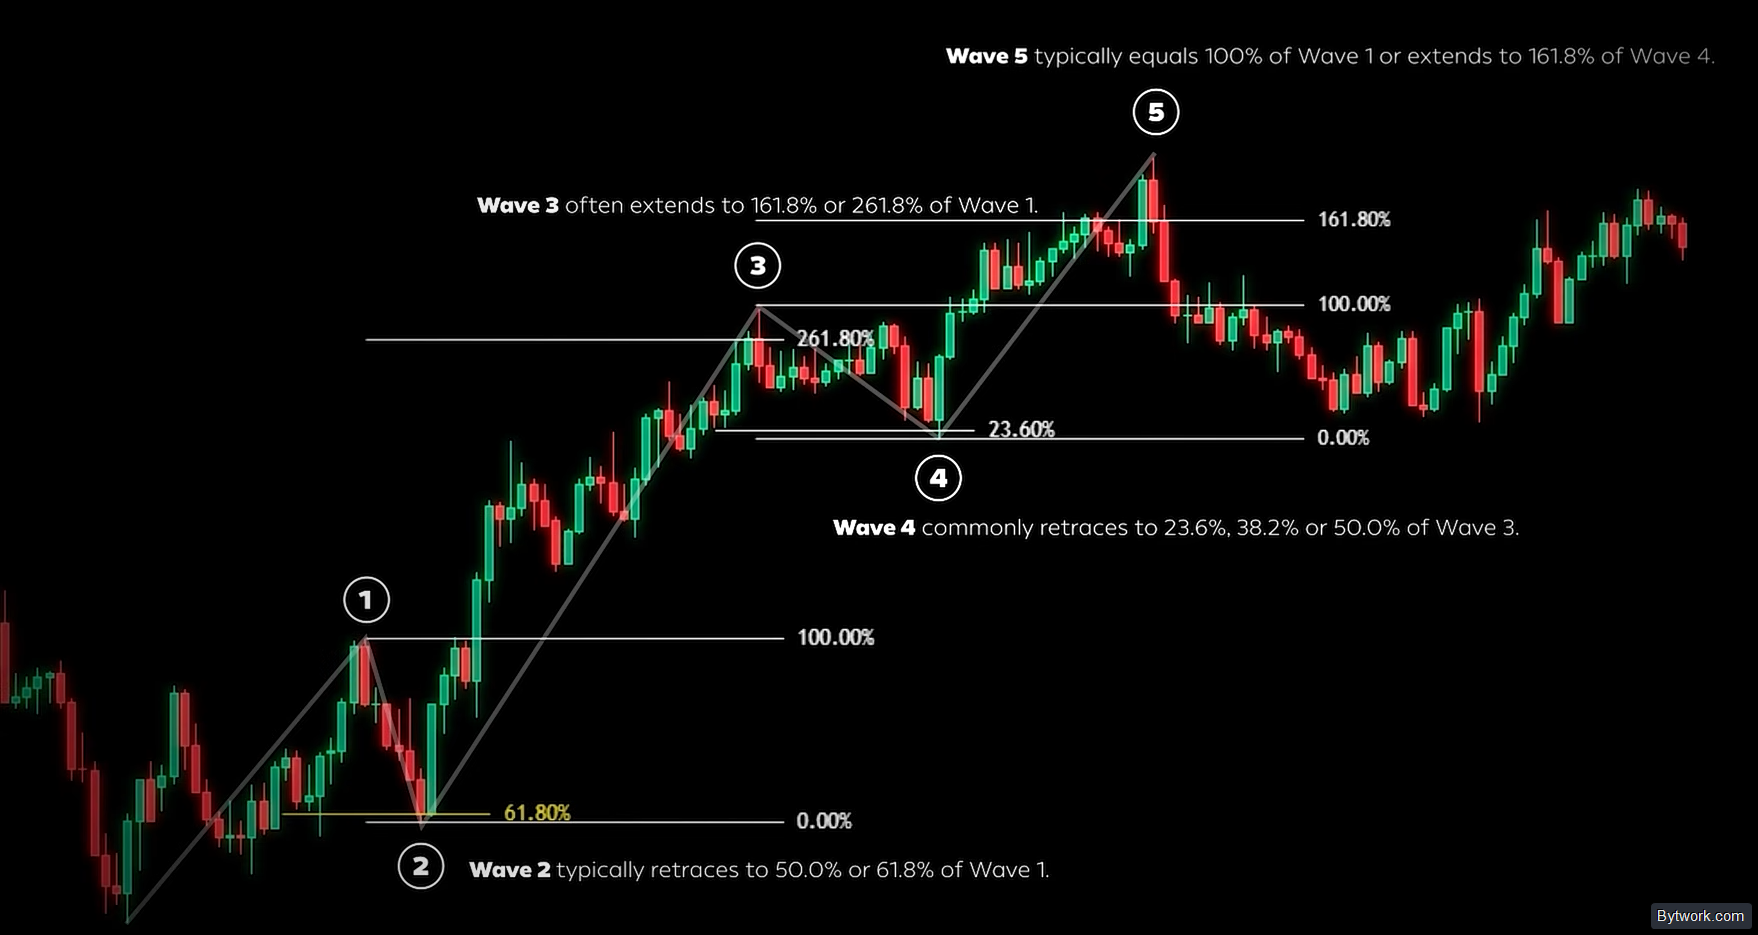
The technical secret that beginners overlook when calculating targets for the 5th wave is the mandatory switch to a line chart that uses only closing prices. On clean lines, the structure becomes perfectly even. For candlestick charts without wick noise, use Heikin Ashi. Understanding Japanese candlesticks is essential for clearly identifying reversals at wave endings.
In volatile markets, Fibonacci levels drawn on candlesticks often fail due to wick noise. But on clean lines, the structure becomes ideally proportional, and extension targets match point‑for‑point.
Wave Analysis in a Bear Market
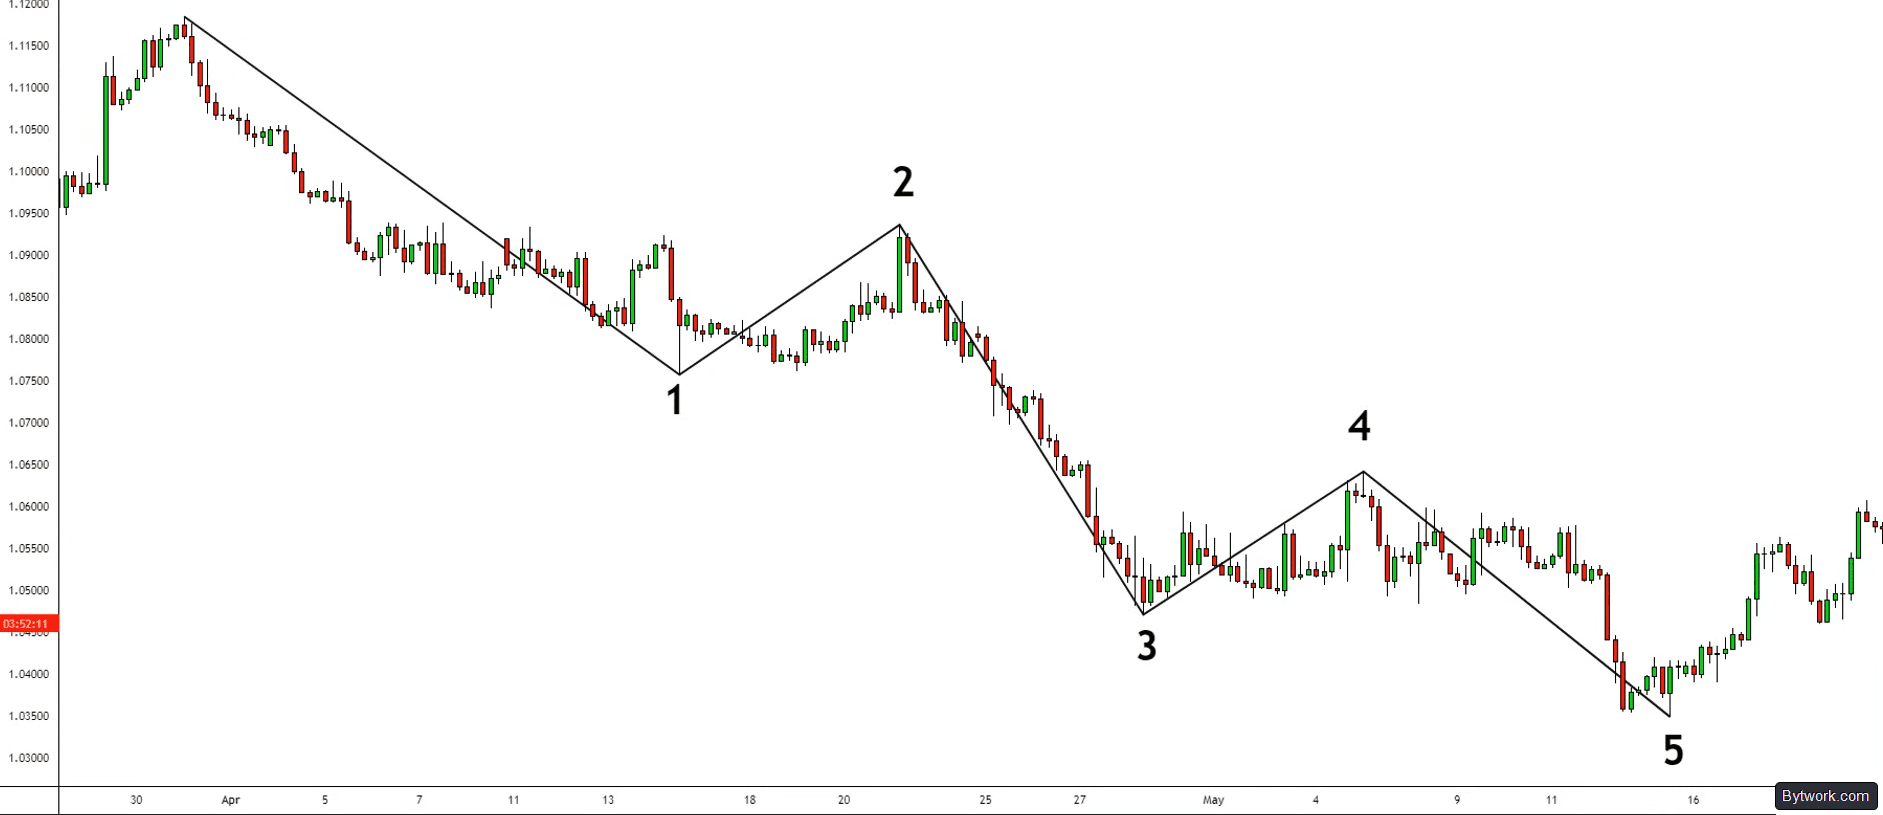
In the example below, the market moves downward with impulse waves (1, 3, 5) and corrective waves (2, 4).
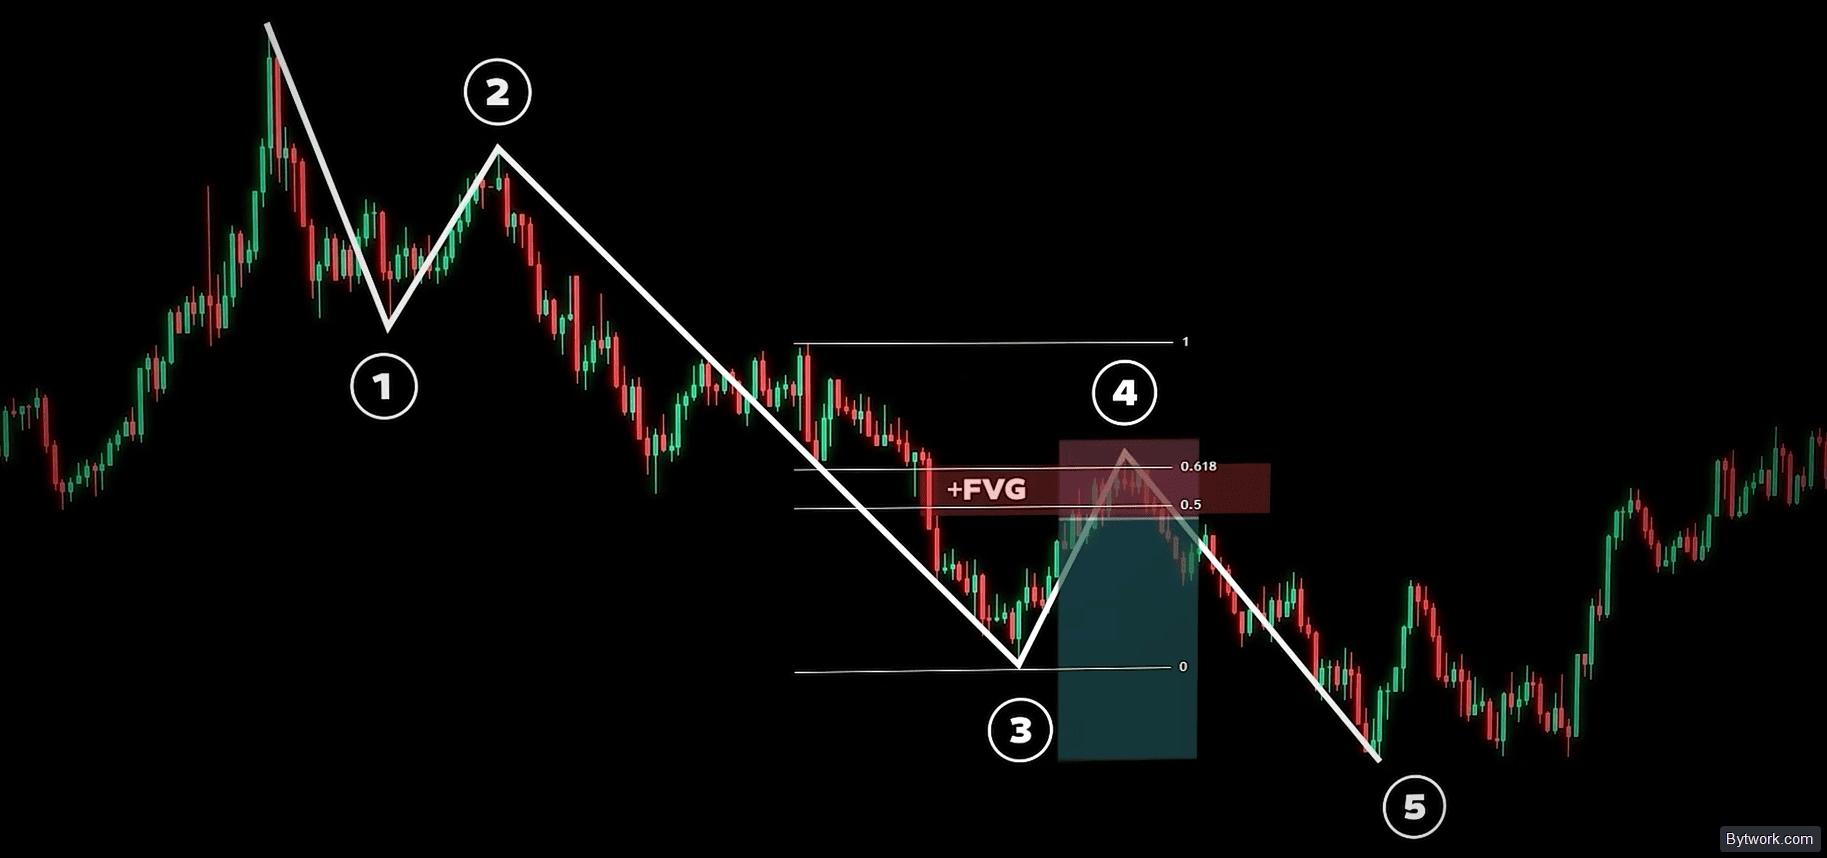
Wave 4 is considered a correction to wave 3. In this zone, traders often look for confirmation via +FVG (fair value gap), which is used as an area of interest for entering a sell trade in the direction of the fifth wave. At the same time, Fibonacci retracement levels (marked 0.5 and 0.618) are applied to determine the optimal completion point of corrective wave 4 before the final decline in wave 5.
It is important to note that Elliott Wave analysis is not a standalone trading technique, and its subjective nature deters some traders. Nevertheless, many successfully integrate its patterns into their strategies.
Classification of Wave Patterns
Broadly, there are impulse and corrective waves, each with their own patterns.
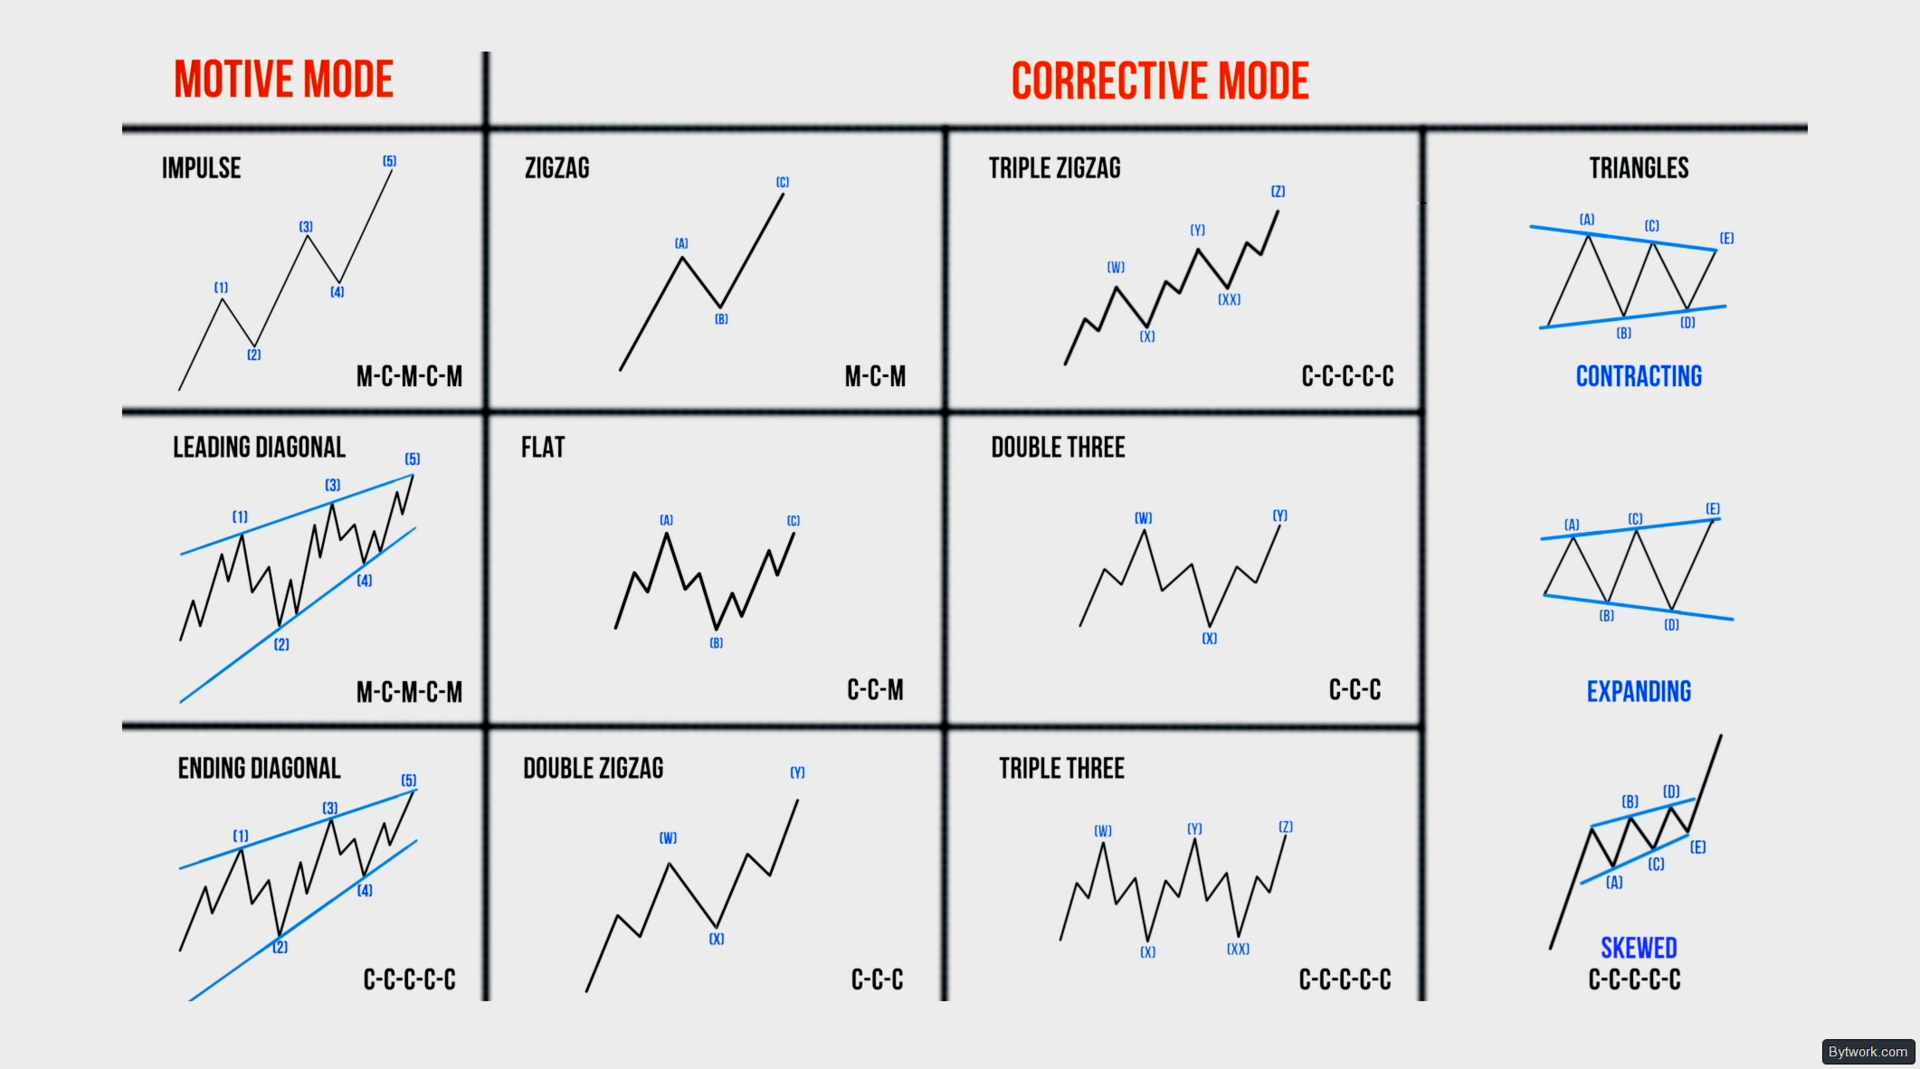
The essence of the patterns is summarised in the table below:
|
Wave Type |
Kind / Form |
Structure |
Characteristics |
|
Impulse |
Impulse |
5 subwaves |
Trend‑following (waves 1, 3, 5, A, C) |
|
Leading diagonal |
5‑3‑5‑3‑5 or 3‑3‑3‑3‑3 |
Occurs in waves 1 or A |
|
|
Ending diagonal |
3‑3‑3‑3‑3 |
Final (waves 5 or C) |
|
|
Correction |
Zigzag |
5‑3‑5 |
B does not exceed the start of A |
|
Flat |
3‑3‑5 |
3 types – regular, expanded, running |
|
|
Triangle |
5 waves (A‑E) |
At least 4 waves are zigzags; most often appears as wave 4 or B |
|
|
Complex correction |
W‑X‑Y or W‑X‑Y‑X‑Z |
Combinations of zigzags, flats and triangles linked by wave X |
There are also rules of equality, alternation, and truncation.
|
Rule / Wave |
Meaning and manifestation |
Fibonacci Targets |
|
1. Equality |
Non‑extended impulse waves are roughly equal in length and time (often Wave 1 = Wave 5). In zigzags, Wave C tends toward the length of Wave A. |
Wave C = 100% of Wave A |
|
2. Alternation |
Consecutive corrections differ in form. If Wave 2 is sharp and deep, Wave 4 is sideways and complex (and vice versa). |
- |
|
3. Truncation |
Wave 5 does not break beyond the extreme of Wave 3 due to trend exhaustion. It must consist of 5 subwaves. A reversal signal. |
- |
Now let us look at real‑chart examples.
Real‑World Examples of Elliott Waves on Charts
Let us examine simple labelling examples on actual price charts. You can see 5 waves up and 3 down, with no rules violated.
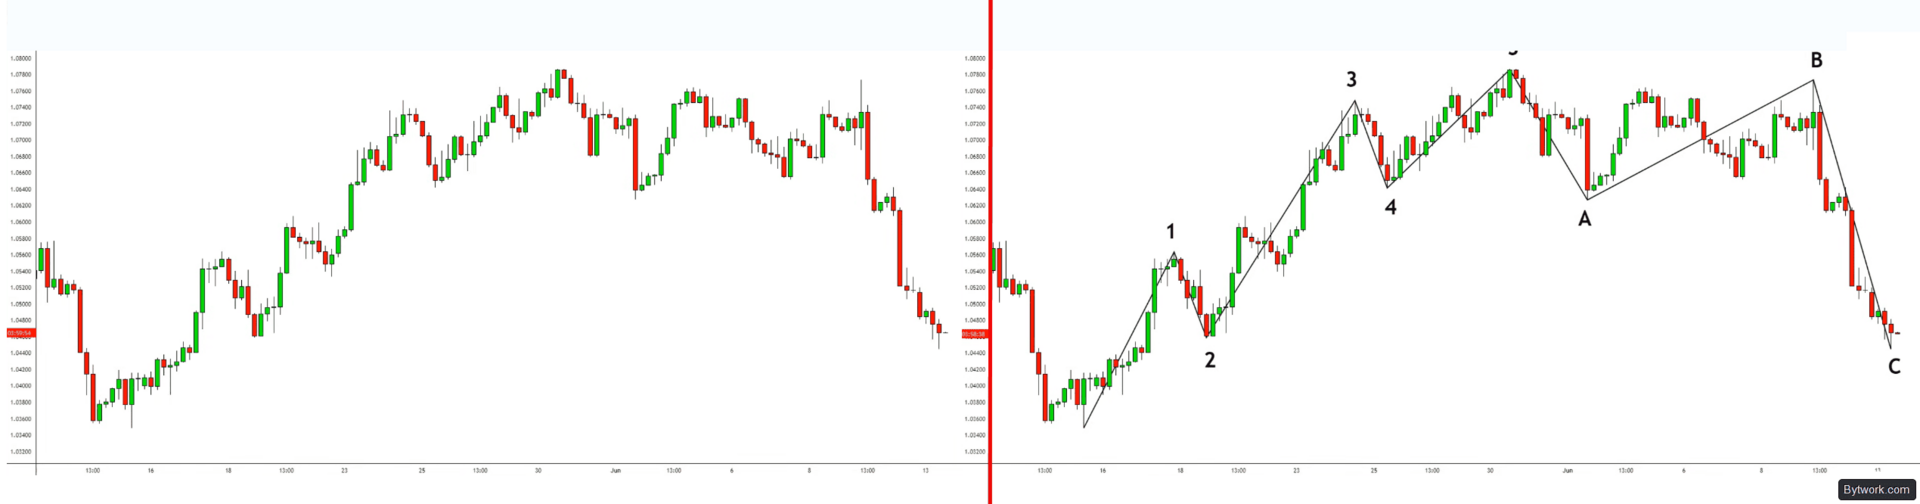
The rules are the same for bull and bear markets, but it is easier to start learning with a bull market and then transfer the knowledge to a bear one.
In the real examples below, vertical and time Fibonacci levels coincide and confirm the wave completion. Fibonacci extension from wave 1 shows the end of wave 5 near 200%. The same ratio is given by the time tool from the start to the end of wave 1.
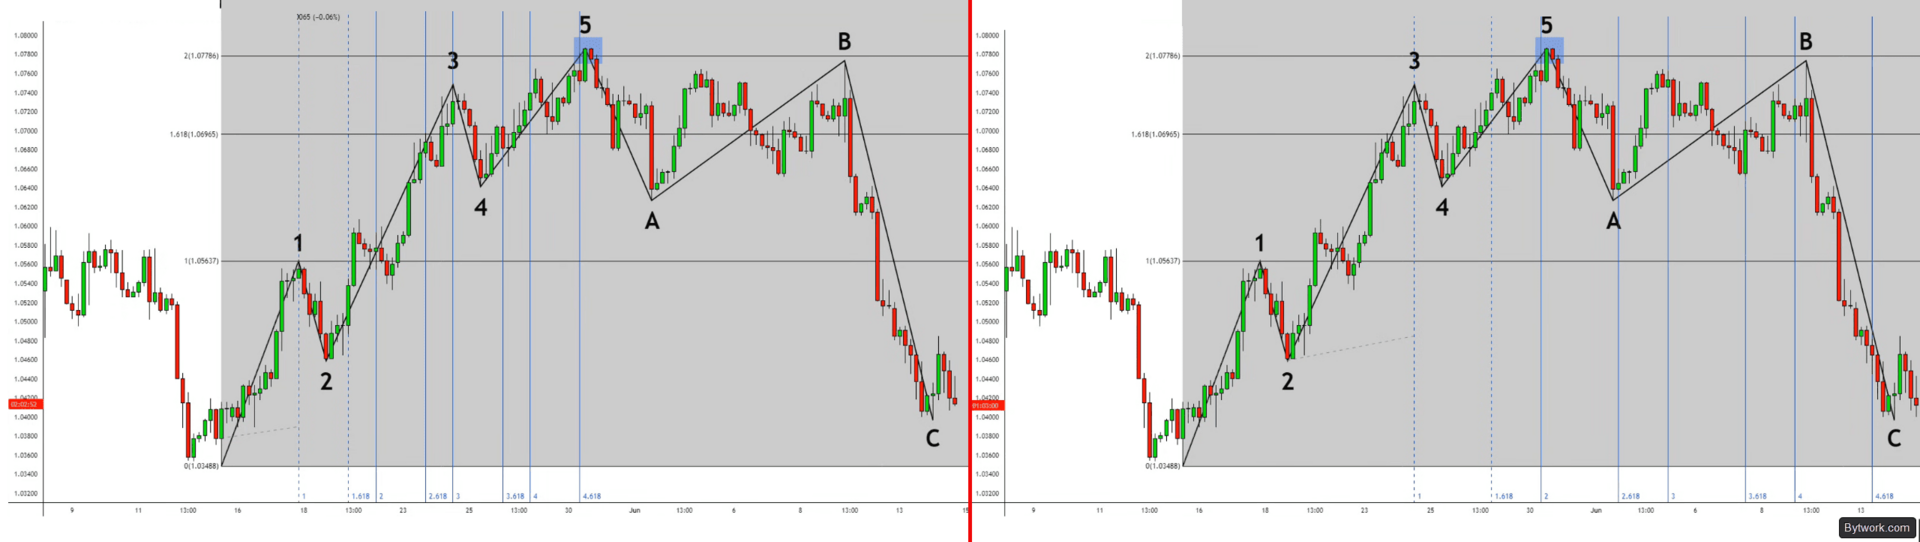
By plotting time differently, from the start to the end of wave 3, the 161.8% level lands in the same zone as the previous 461.8%, while another time tool gives 200% in the same area – this is a confluence of price and time Fibonacci, indicating a key reversal point.
Now let us turn to another real example – a 1‑hour chart in a bear market. If we plot the Fibonacci extension from the start of wave 3 to the end of wave 4, the end of wave 5 falls almost exactly at the 161.8% level.
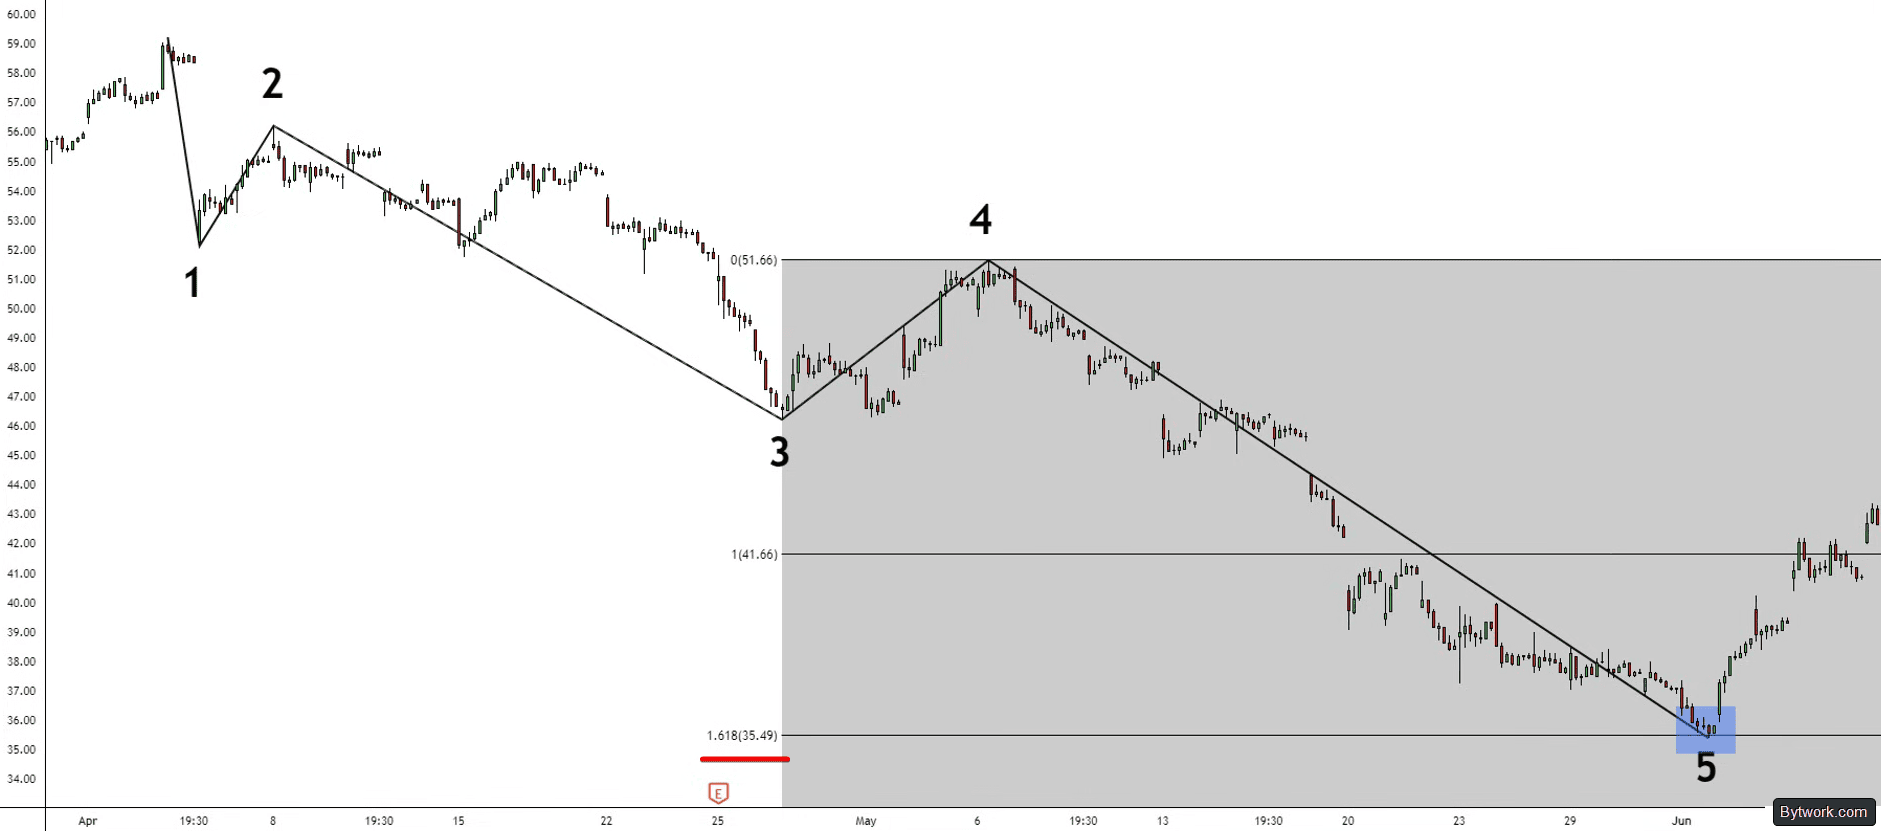
At the same time, Fibonacci drawn from the start to the end of wave 3 points to the same price level but with the 200% level.
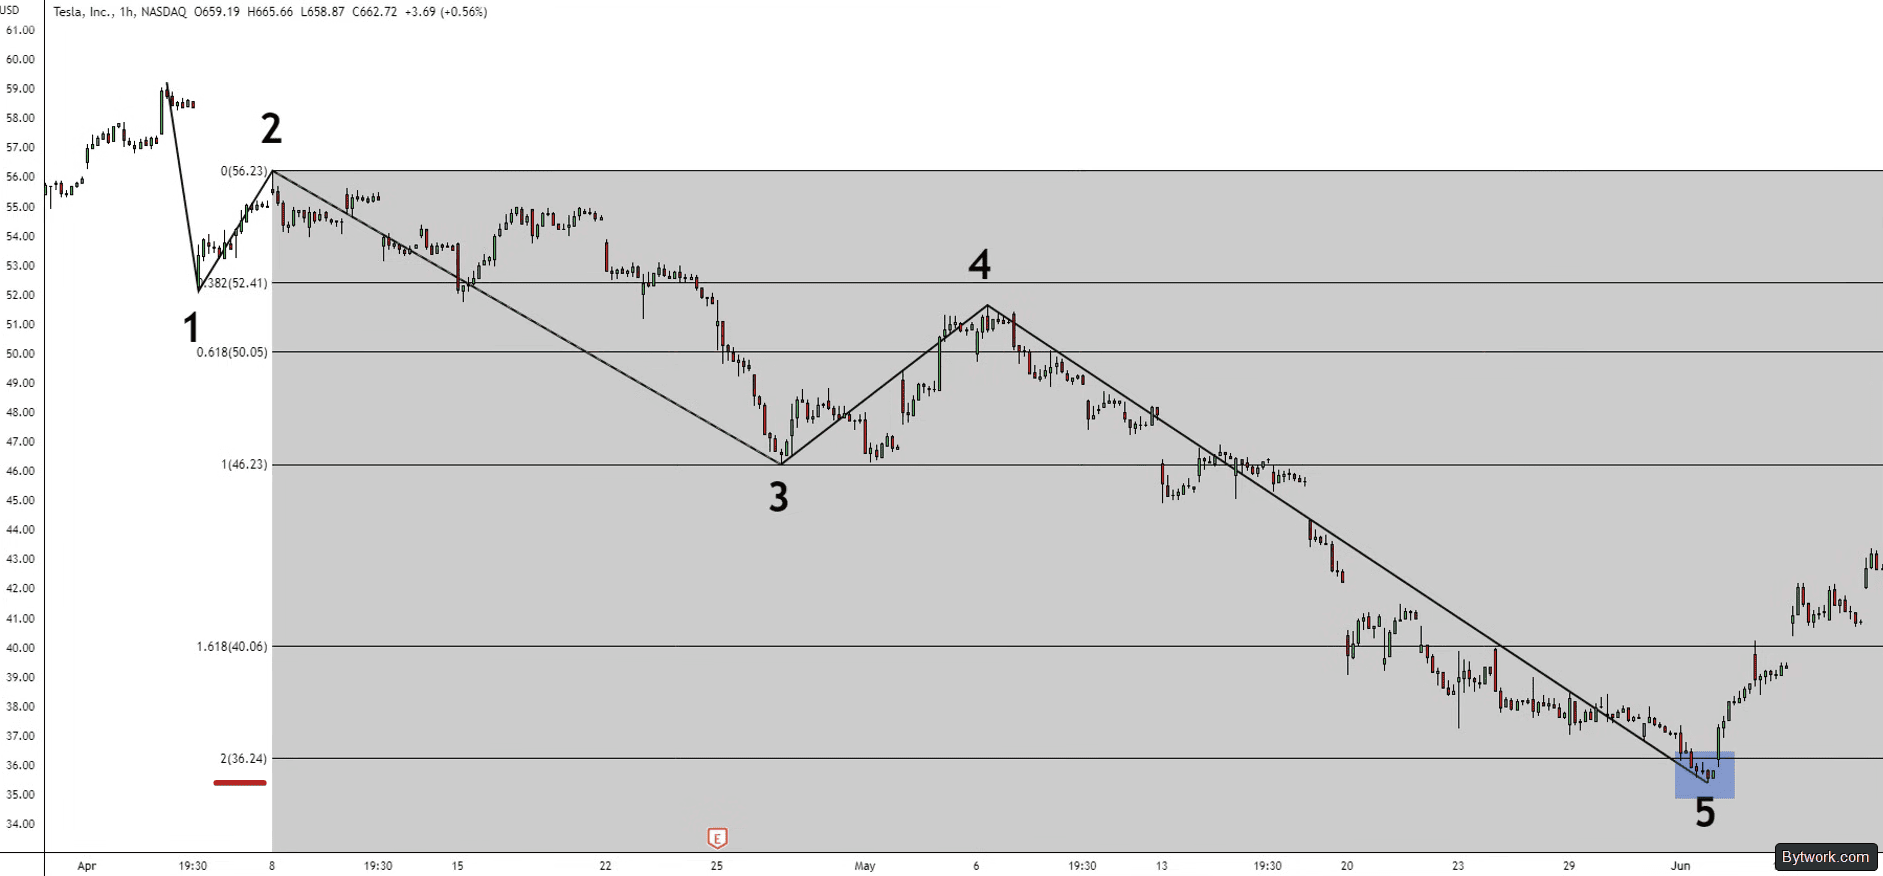
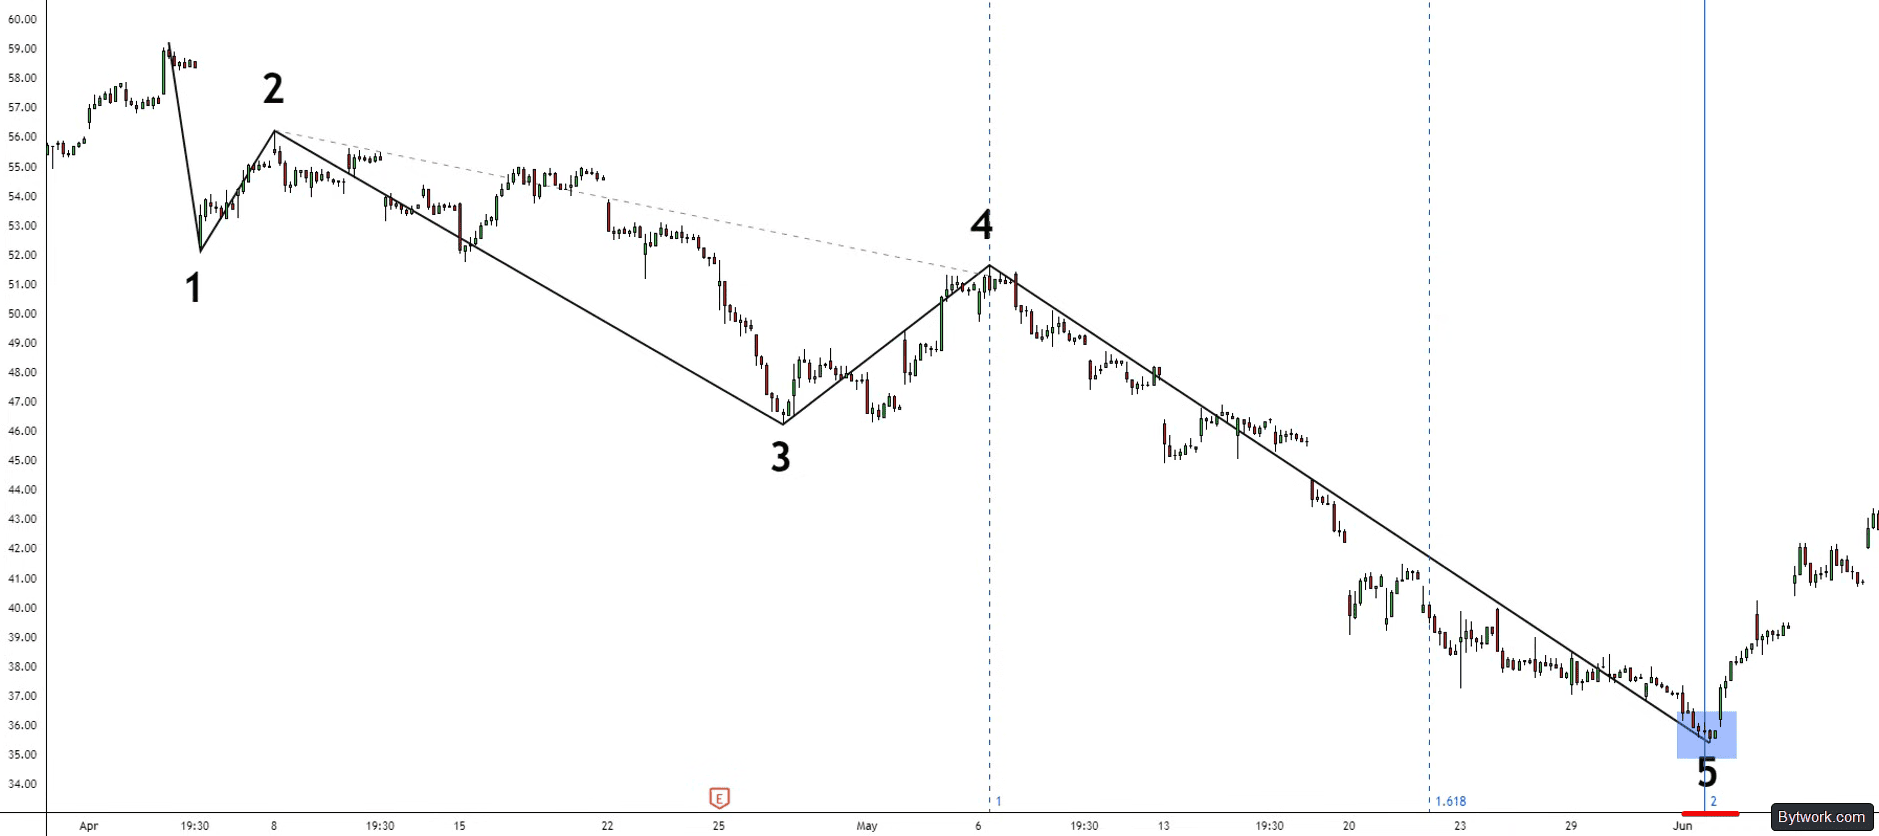
In the time dimension, plotting the time tool from the start of wave 3 to the end of wave 4 gives a coincidence of the 200% level with the final point of wave 5. And another time measurement from the end of wave 1 to the end of wave 3 places the 261.8% level in the same projected area.
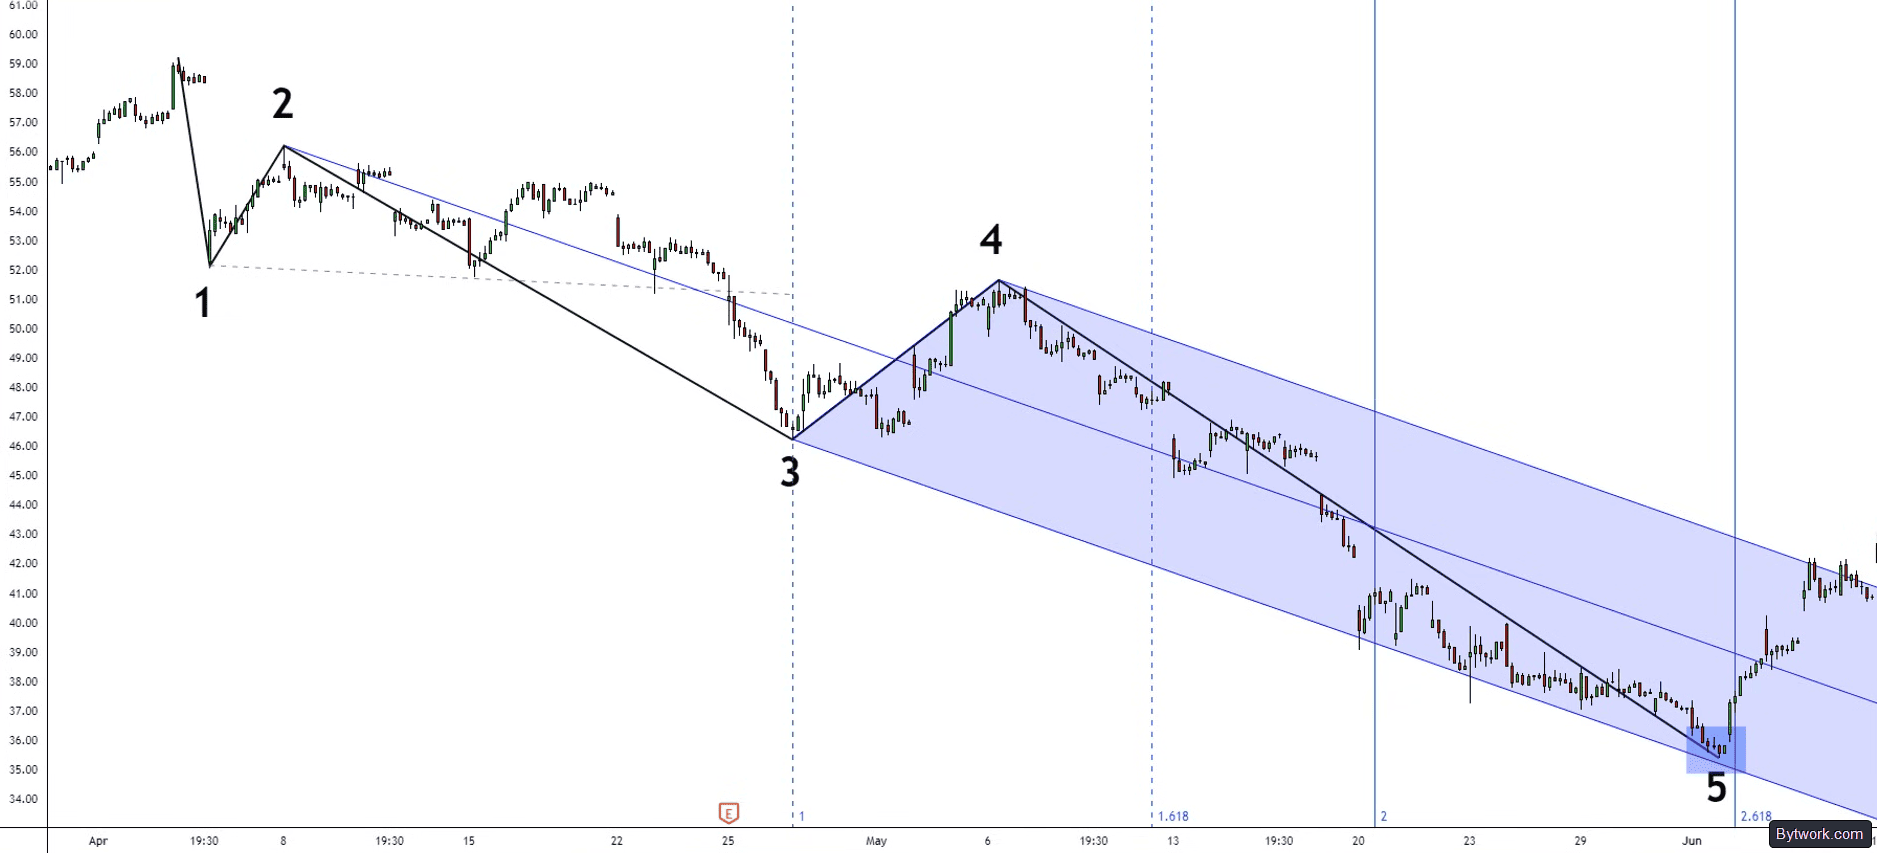
Additional tools reinforce this picture. The standard Andrews' Pitchfork, constructed with the start of wave 3 as the A‑axis and the start and end of wave 4 as the B and C axes, shows that the price fairly accurately respects the lower pitchfork line.
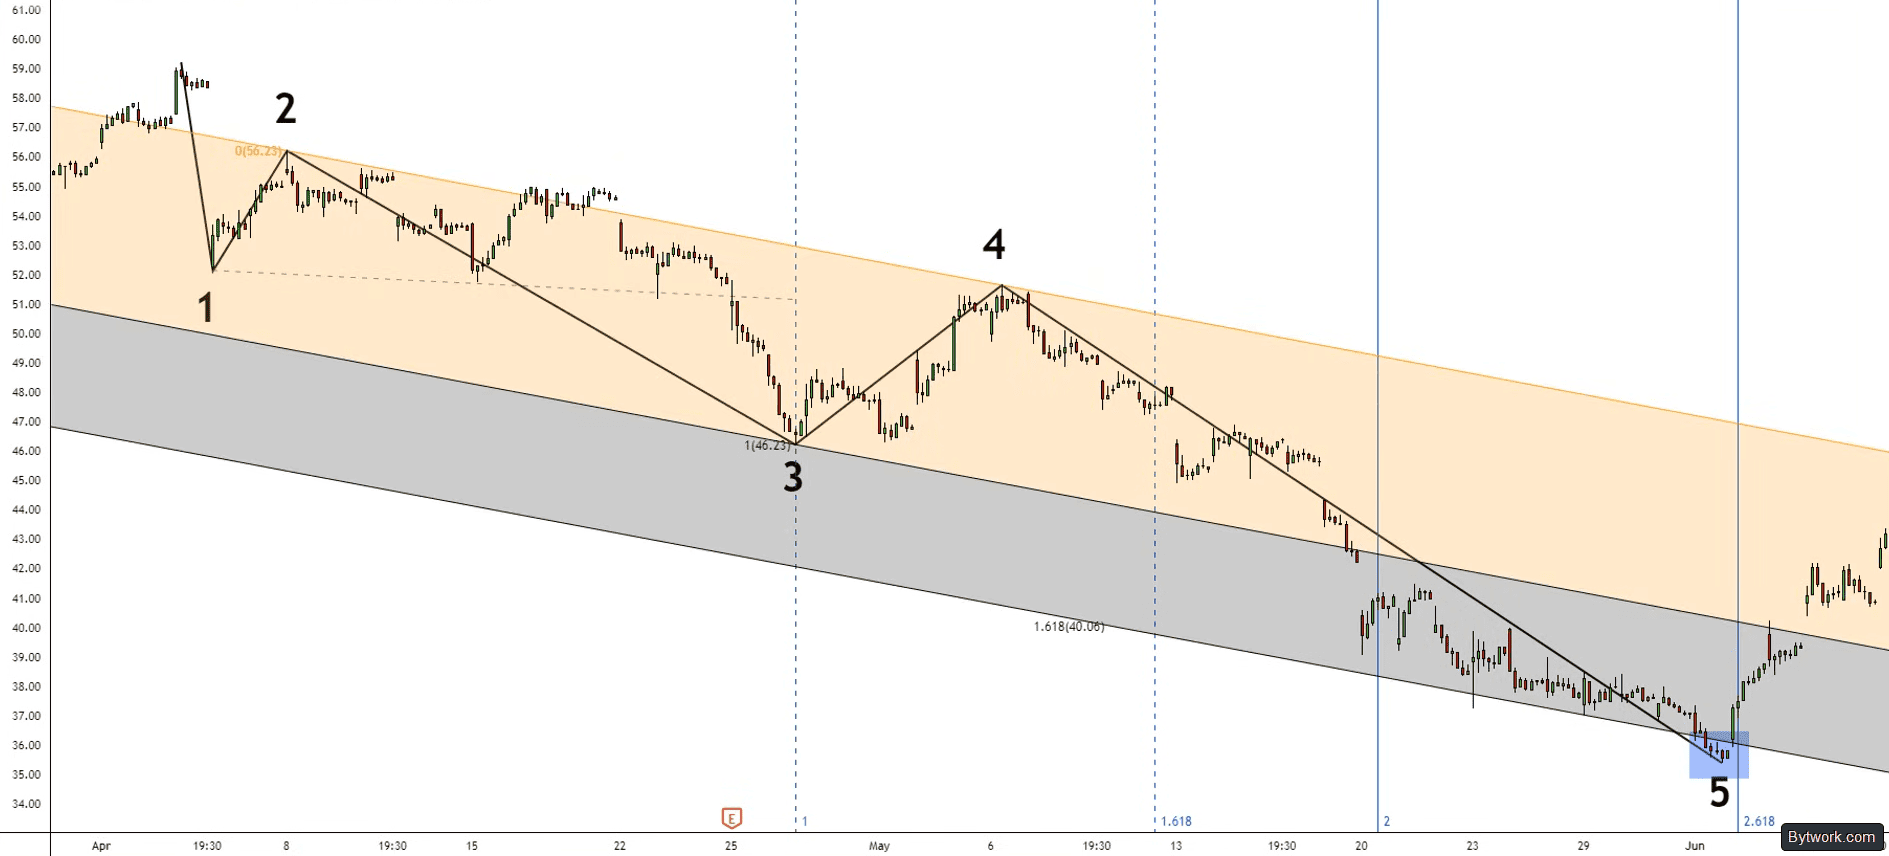
Furthermore, a Fibonacci channel, where the orange zone below is built from points 2, 3, and 4 and extrapolated with a Fibonacci coefficient into the gray channel, also captures the end of wave 5. All these converging signals demonstrate the reliability of combining price and time projections.
Now let us move on to how a beginner can use Elliott Waves in trading.
How Can a Beginner Apply Elliott Wave Theory in Trading?
Mastering the method takes time, but you can apply it right now. For example, when you suspect a price reversal due to bearish divergence on RSI. As we know, divergences can produce false signals, but wave theory helps filter out noise by providing a roadmap. By performing a wave count on recent price action, you can check whether a reversal is indeed imminent.
Labelling starts with higher timeframes:
- Weekly/Monthly – define the global trend and the roadmap – look for historical lows and the last readable pattern.
- Daily/4‑hour – the main working range for identifying current waves, their structure, and target levels.
- 1‑hour and below – for sub‑wave detail and pinpointing entry points with minimal risk.
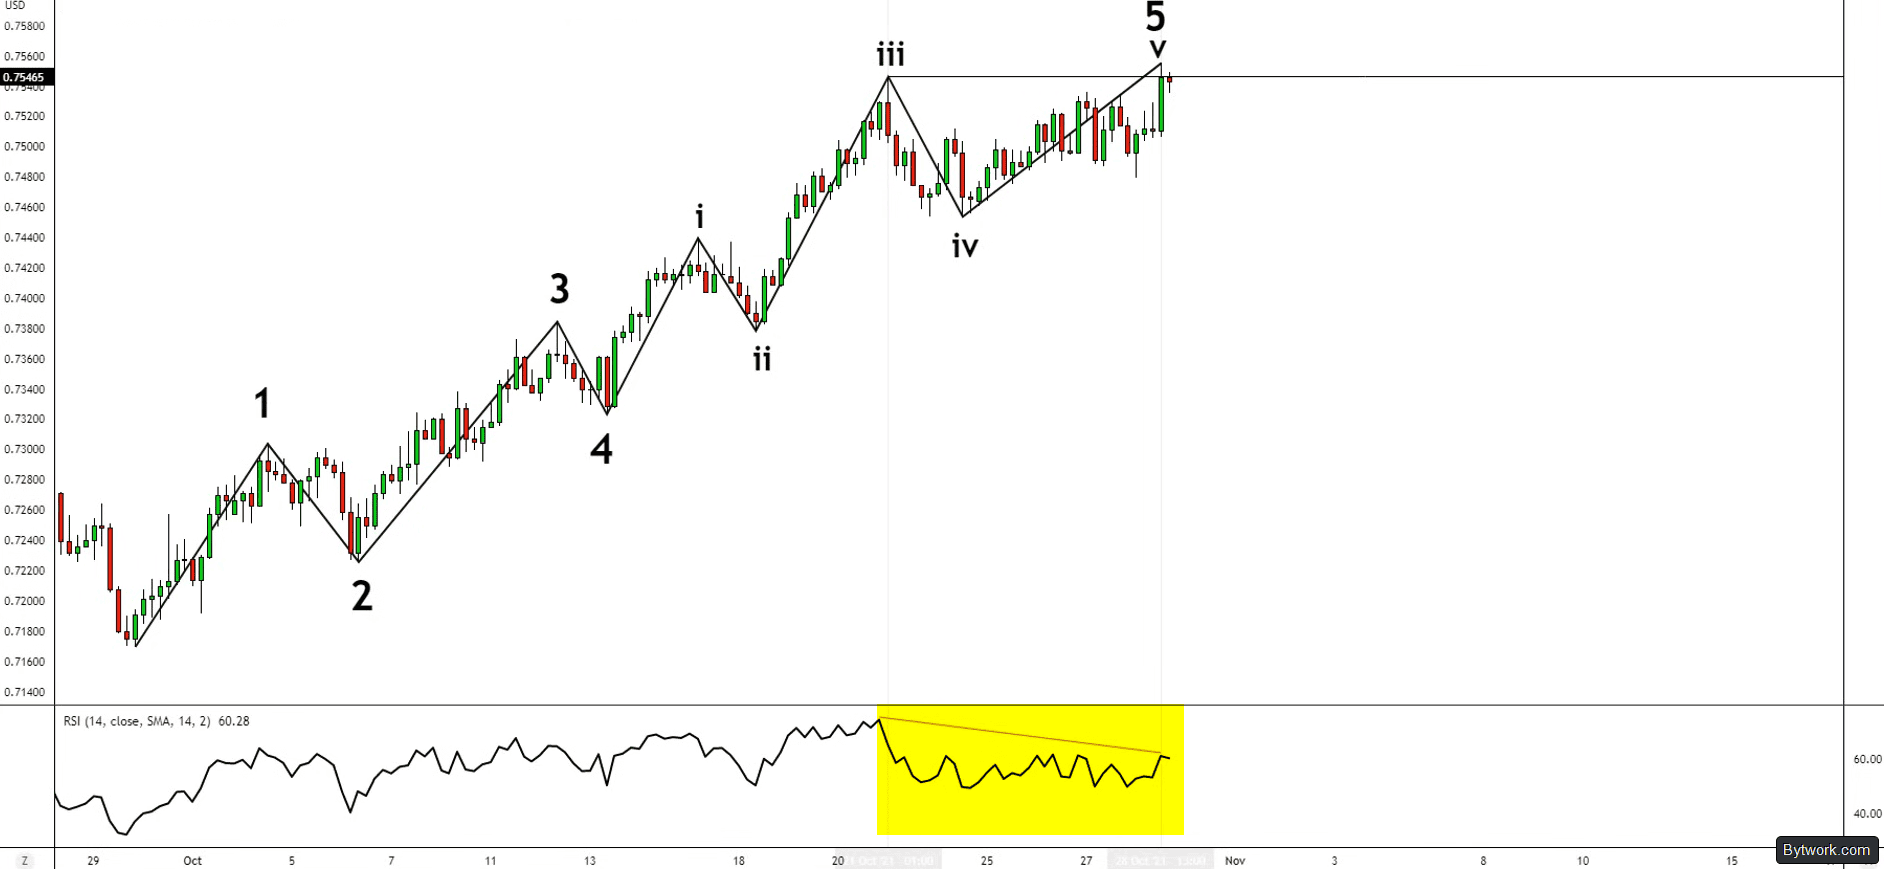
In the example shown, a correct count includes an extended wave 5, and according to the principle of equality, waves 1 and 3 have approximately the same length – even if wave 3 is slightly larger, it fully complies with the rules of the theory. According to this count, the market is preparing for a significant downward reversal.
Supporting the Hypothesis with Fibonacci Analysis
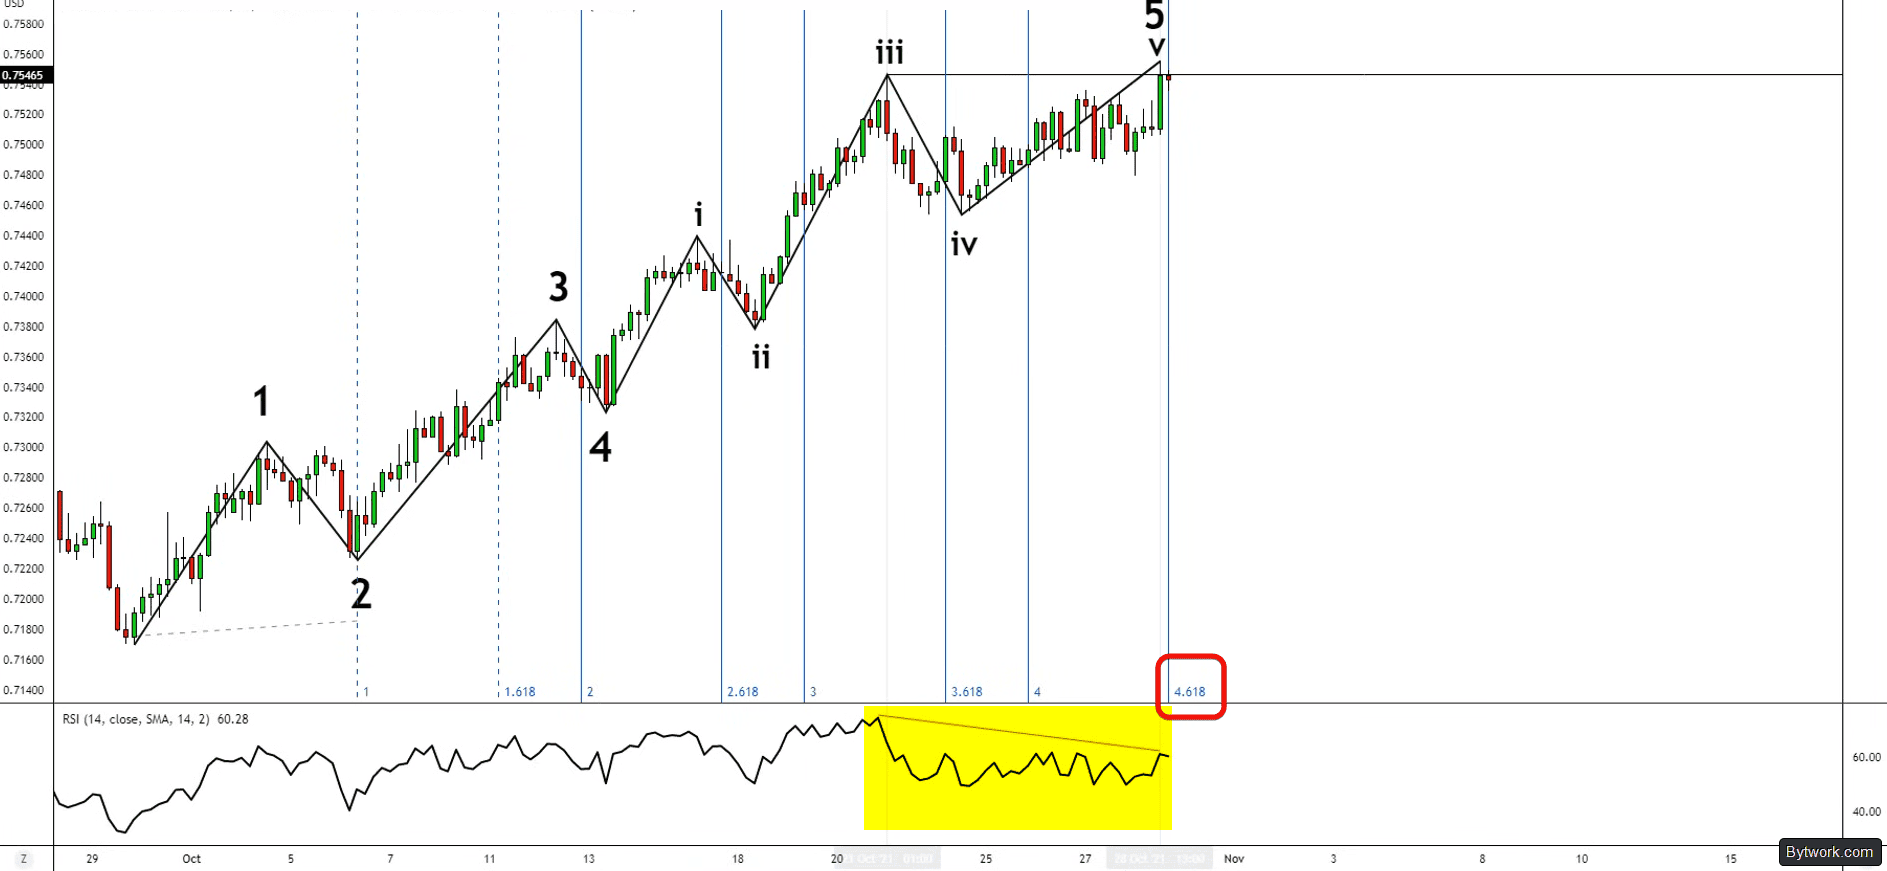
Before seeing the result, a quick Fibonacci analysis adds extra weight to this hypothesis. By plotting the time tool from the start of wave 1 to the end of wave 2, we see that the probable end of wave 5 intersects with the 461.8% level:
Another time measurement from the start of wave 1 to the end of wave 3 places the 200% level in the same probable reversal zone.
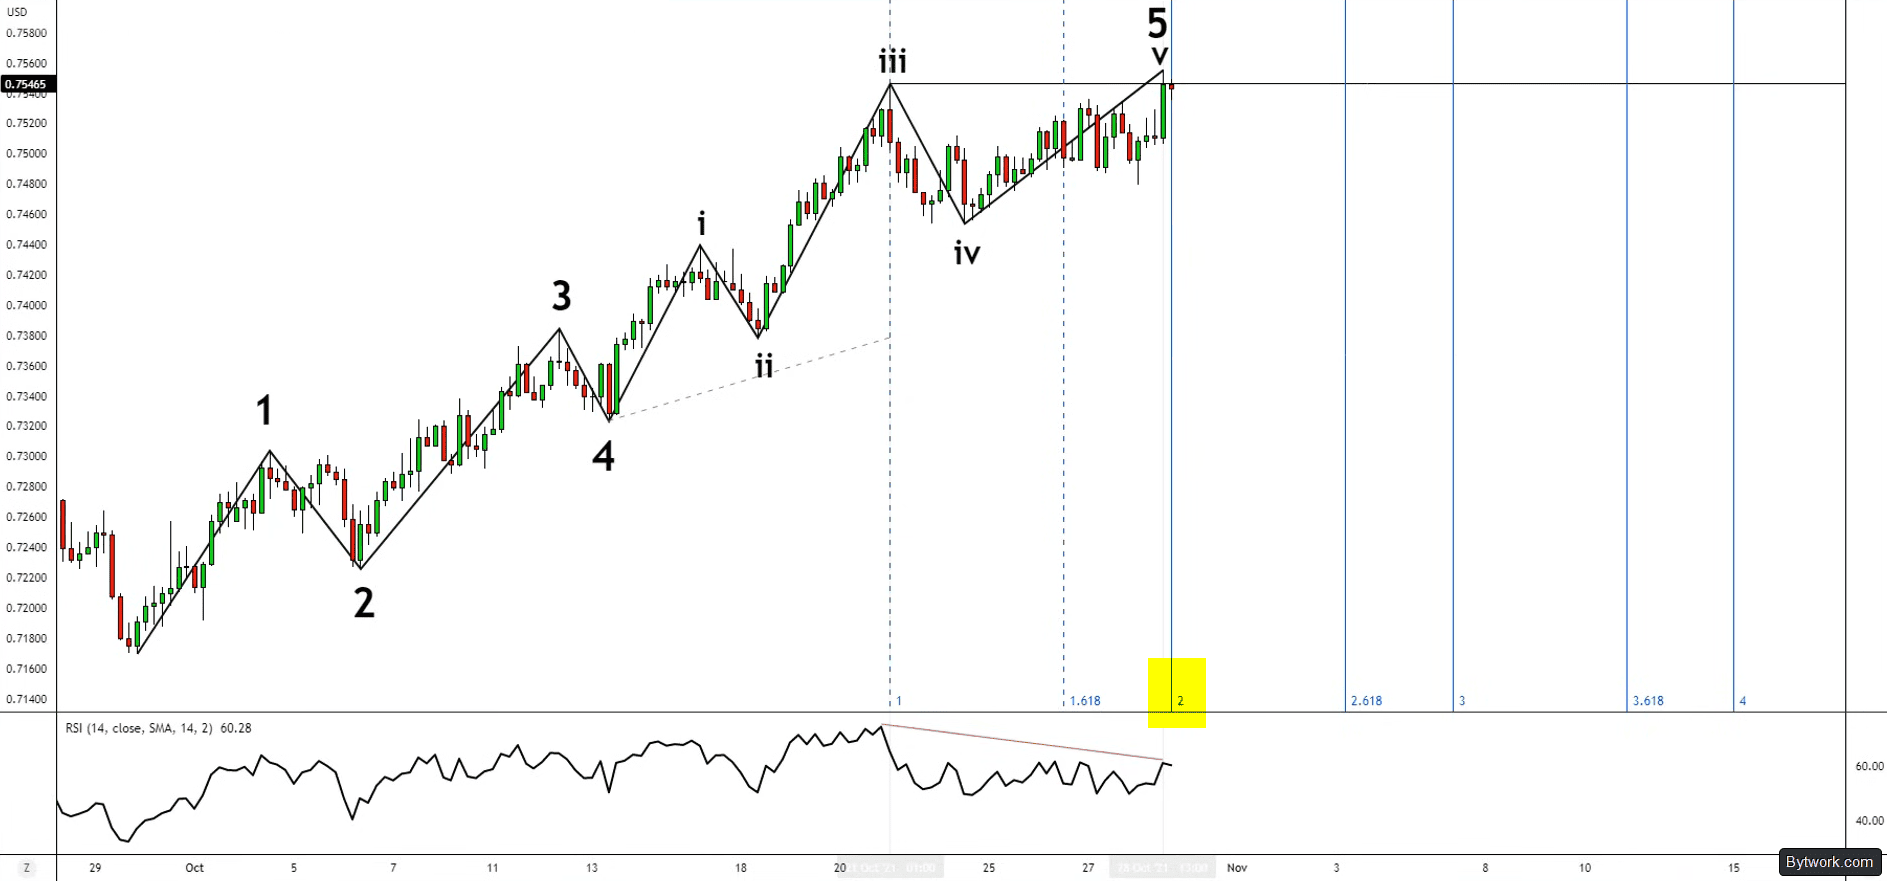
Thus, we have two time Fibonacci convergences in one area.
If we plot vertically, the ratio tool on wave 3 and on wave 1 shows that the 200% level lands almost exactly in our target zone, while the extension from the start of wave 1 to the end of wave 4 associates the area of interest with the 100% level.
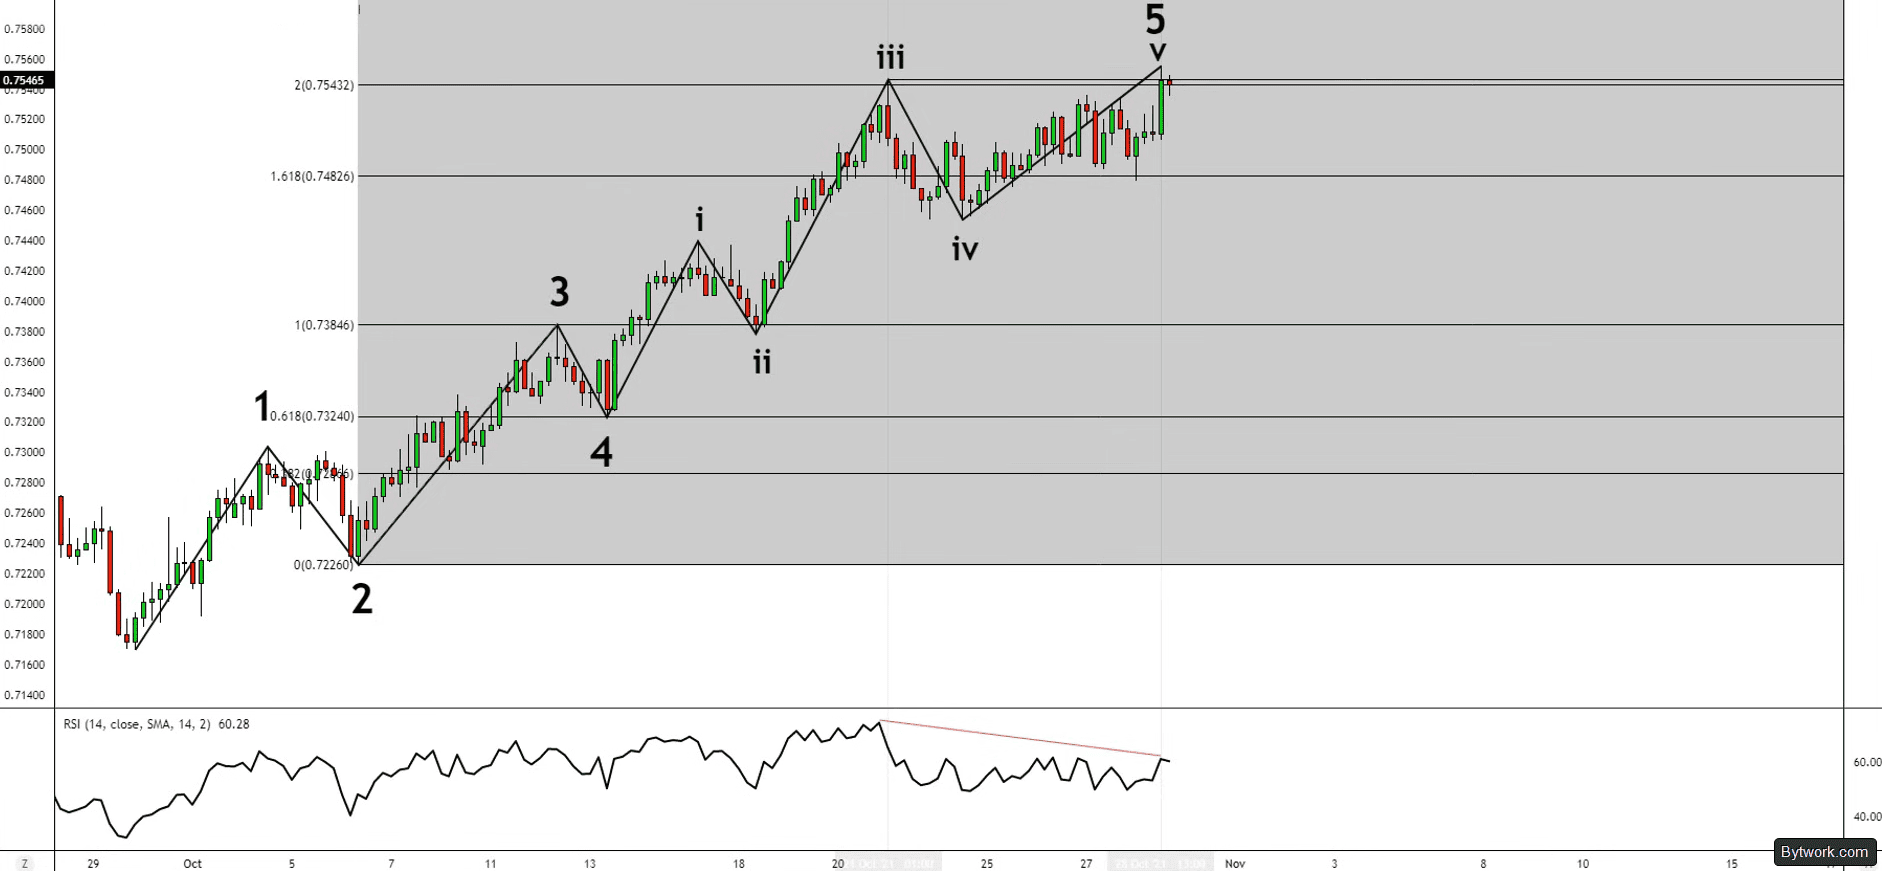
In addition, the current candle is an inside bar, signalling a temporary pause, which often precedes a reversal.
Trading Example Conclusion
Ultimately, the result confirmed that this zone indeed became a turning point.
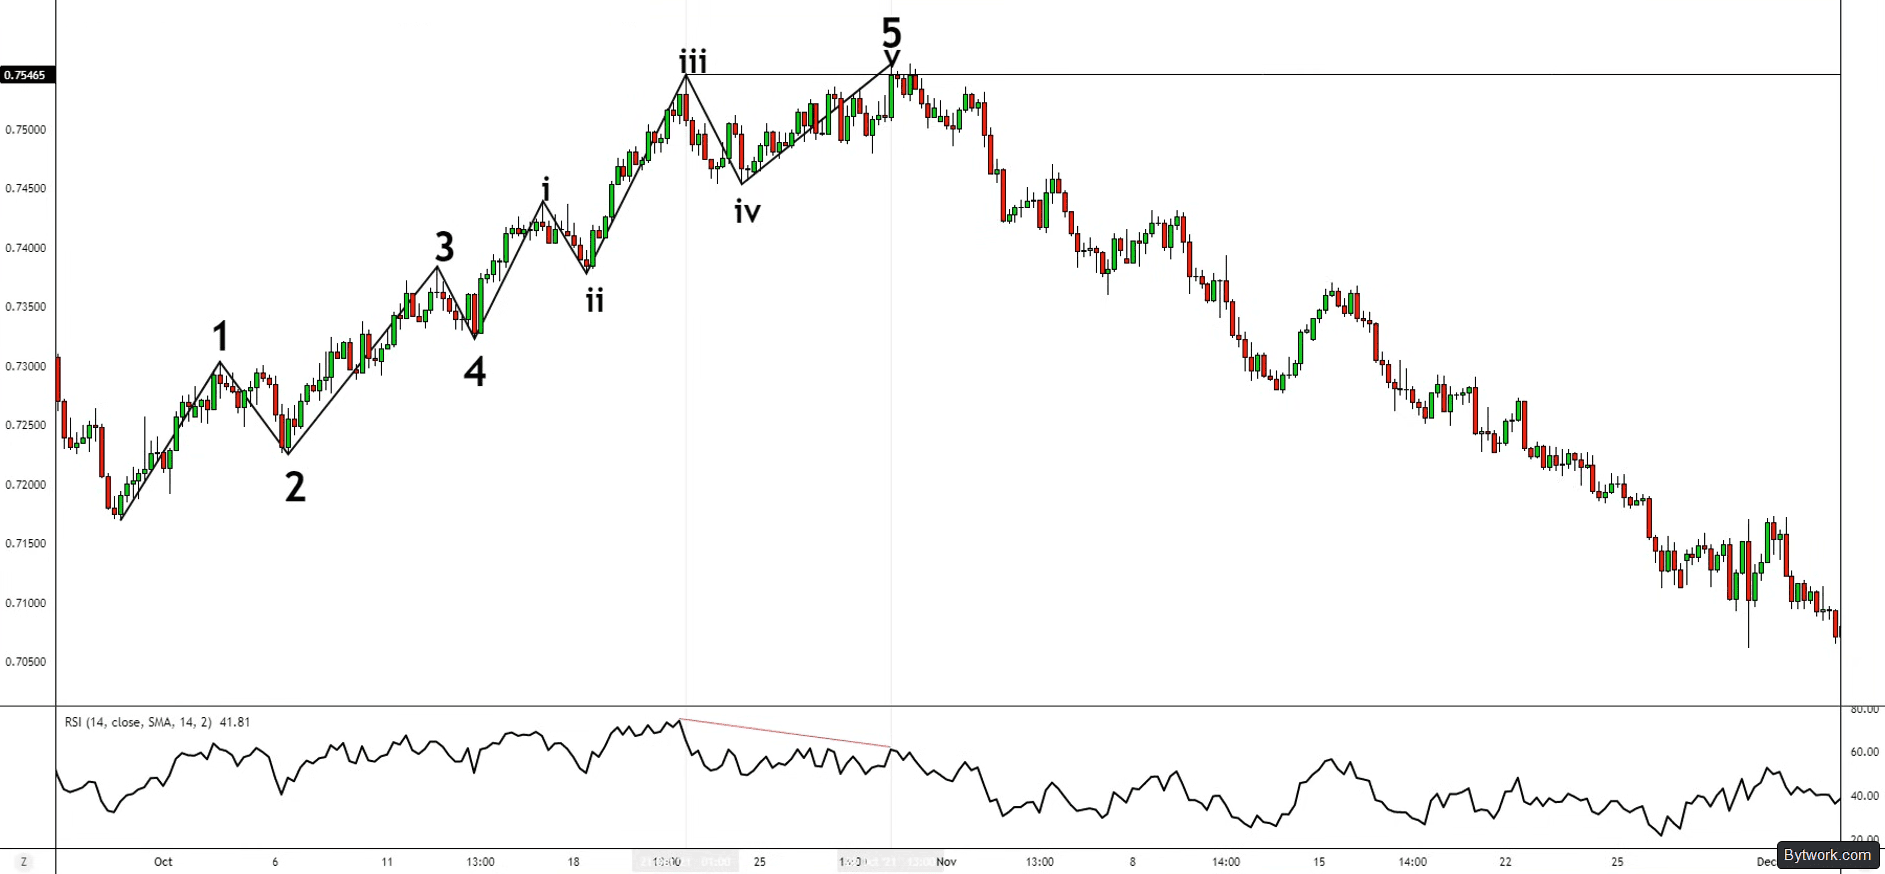
To summarise for beginners: use the rules and guidelines of Elliott Waves to build counts that support your trading ideas, and look for confluence between vertical and horizontal Fibonacci levels to strengthen your analysis.
Drawbacks and Advantages
Let us consider the pros and cons of wave theory.
Advantages:
- Provides a clear roadmap for assessing direction.
- Recognised by both retail and institutional traders.
The drawback lies in the mathematical construction of the indicator. Indeed, the vast majority of Elliott Wave indicators on TradingView (PineScript) are useless for a professional, because they simply slap labels on every swing. The bar‑by‑bar execution model of PineScript does not allow the code to retain many pivot points simultaneously and compute relationships between non‑addressable waves without complex custom‑type arrays.
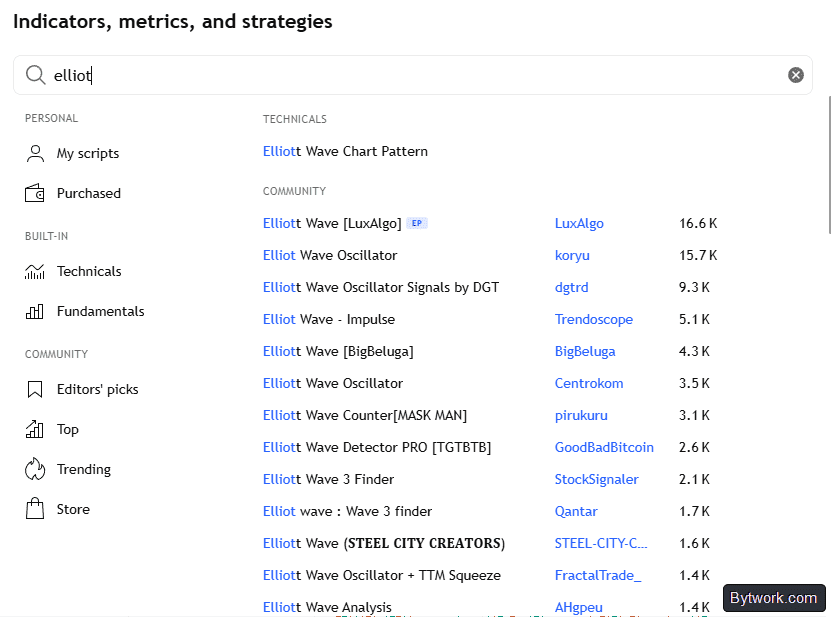
As a result, traders make decisions based on counts that mathematically violate the rules of the theory.
The drawbacks are summarised in the table below:
|
Aspect |
Explanation |
|
1. Subjectivity and lack of scientific basis |
• Two analysts can produce different, yet formally correct, counts. |
|
2. Hindsight bias |
• Works perfectly in hindsight, but is difficult in real time. |
|
3. Technical complexity |
• Hundreds of rules and guidelines lead to cognitive overload. |
|
4. Execution risks and manipulation |
• Market makers may paint patterns to trap liquidity. |
|
5. Psychological pitfalls |
• Overconfidence in the completion of a five‑wave pattern leads to ignoring stops. |
On wave 4, cross‑check your count with liquidity zones and liquidation maps to avoid traps and see where price is heading to hunt stops.
Without strict risk management (risk limit of 1‑2% per trade) and confirmation from other tools (Fibonacci, RSI, volume), attempting to trade solely based on wave counts will inevitably lead to capital loss!
Conclusion
Here is what we have learned after 5 years of studying and back‑testing wave theory. Elliott Waves must be used wisely. They may simply not work on certain assets. In Web3 assets with a high concentration of tokens in a small number of wallets (e.g., TON, where 95% of the supply is held by 100 addresses), charts do not reflect crowd psychology – they are drawn by market maker algorithms. Elliott Waves there become a tool for manipulation. Bots deliberately paint flags and wedges to trigger retail entries at highs and collect liquidity through stop hunts.
Calculating 5th‑wave targets using candlestick wicks on volatile markets often yields errors. The accuracy secret is switching to a line chart (based on closing prices). On clean lines without manipulative shadows, the structure becomes perfectly proportional, and Fibonacci extensions match point‑for‑point. Accuracy increases to 92%.
The key to successfully applying this method lies in correctly counting waves and identifying the current wave with the help of Fibonacci. That is the foundation.

Relying on AI algorithms is not advisable because they cannot interpret volume and context (variability) that the human eye sees. This realisation devalues 99% of trading bots that promise auto‑Elliott. However, that is how trading works.
Postscript: we have been trading since 2018 and have tested hundreds of strategies and indicators. The trading section will help you choose a trading system! Your editor – Pavel Grachev for bytwork.com.
This material is for informational purposes only and does not constitute financial advice.

Now reading


In DePin, people create networks themselves, share traffic or capacity, and receive rewards in tokens from these projects.





The Ellipal firmware update enhances security (fixes vulnerabilities), adds support for new cryptocurrencies and tokens, and optimizes the interface and operational stability.


