The Ultimate RSI Handbook - Separating Myths from Winning Strategies
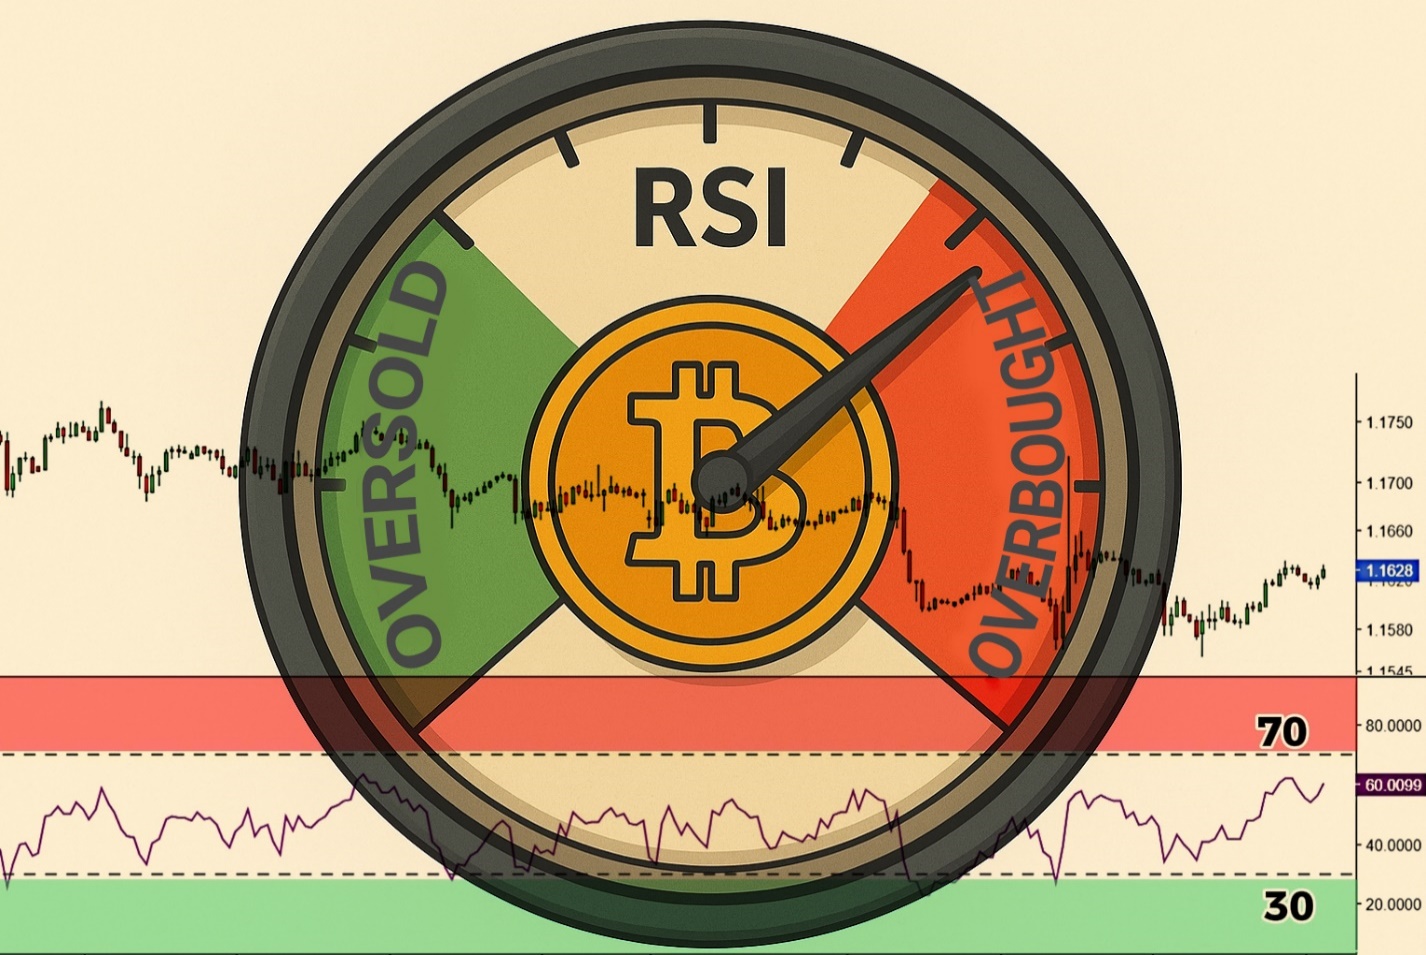
- The RSI is like a speedometer in a car, a momentum oscillator that measures the speed and magnitude of price changes. The speedometer shows who's pressing the gas—buyers or sellers. However, blindly following its red zone is a mistake; its value is only revealed when combined with divergence indicators, moving averages, and others.
- Correct use requires filtering signals by trend: in an uptrend, buy trades are considered when the indicator drops to 30, and in a downtrend, when the indicator rises to 70.
- The RSI serves as a confirmation tool, not a standalone trading strategy.
This indicator will help you identify the optimal time to buy or sell an asset by providing a measure of trend strength. It also issues warnings about potential reversals and helps filter out false signals.
However, 99% of people actually use this indicator completely wrong! If you rely only on the classic interpretation of overbought and oversold, you will face false signals and other inaccuracies.
It is important to understand that technical analysis does not guarantee profitability.
First, let's simply define what RSI is.
RSI, or the Relative Strength Index, is an indicator for measuring the strength of a trend that shows who currently dominates the market - buyers or sellers.
In other words, the RSI shows when price has moved up or down too far.
Use a simple analogy to remember it easily. RSI is like a speedometer in a car - a momentum oscillator that measures the speed and magnitude of price changes. The speedometer shows who is pressing the pedal - the buyers or the sellers.
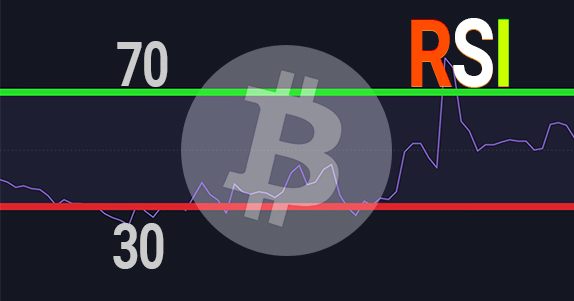
Accordingly, the chart below marks the overbought and oversold points. An asset is considered overbought when its price is too high, and oversold when its price is too low.
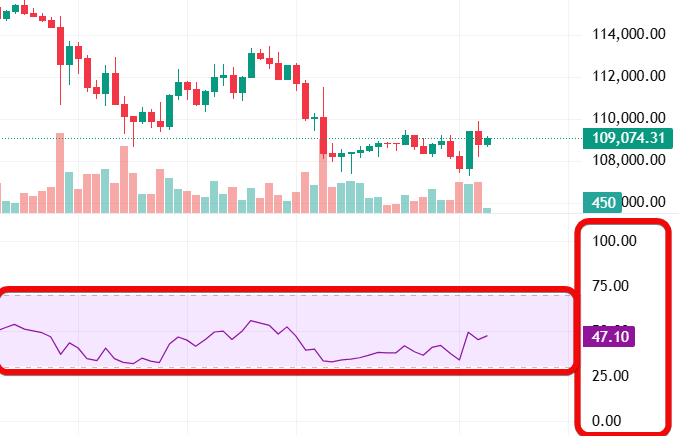
RSI lives in a small panel, usually below the price chart.
The indicator always displays a value ranging from 0 to 100.
- An RSI value above 50 indicates bullish bias - higher prices and an uptrend. In other words, traders are running out of buying strength.
- And a value below 50 indicates bearish bias - lower prices and a downtrend. In other words, there is no strength left in selling.
In the chart example we have 47.10 - a neutral range.
RSI compares average moves over the last 14 candles. Although this indicator can be adjusted to other periods.
On crypto markets RSI spends significantly more time above 70 than below 30.
We won't bore you with the complicated formula for the indicator. It's far more important to help you understand how to use the indicator profitably in your trading.
It's important to understand that not every RSI configuration is effective, so read on to learn about optimal settings.
How to use it
RSI is applied in four main ways:
- The classic use of overbought and oversold zones.
- Eliminating false signals. Done via settings adjustments.
- Combining RSI with additional indicators, e.g., a moving average or Bollinger Bands, to confirm signals.
- Using divergences as reversal signals.
Using only one method is fundamentally wrong!
Market context is king. All these tools together give you the context that a single RSI cannot. You're not looking at one indicator in isolation but at the whole picture, which dramatically increases your chances of a successful trade.
The classic overbought/oversold approach
First, take a look at the indicator itself below:
Add RSI to the chart, and draw two horizontal lines at levels 70 and 30. These levels separate the overbought and oversold zones.
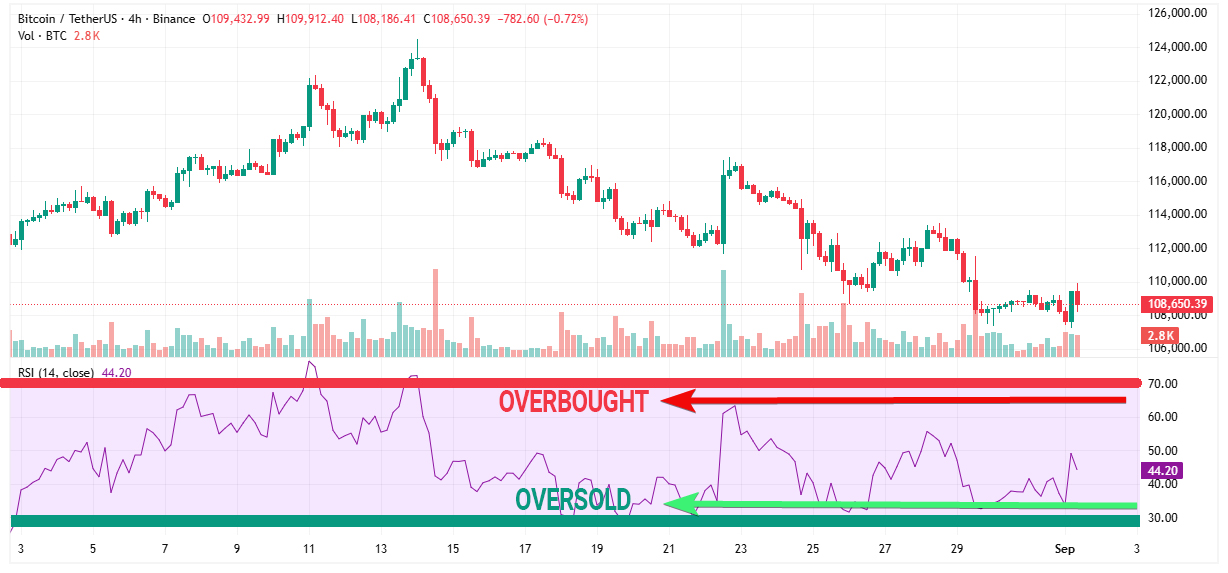
When RSI is above 70 a price drop is expected; when it's at 30 or below - a rise is expected. The examples on the chart confirm this rule:
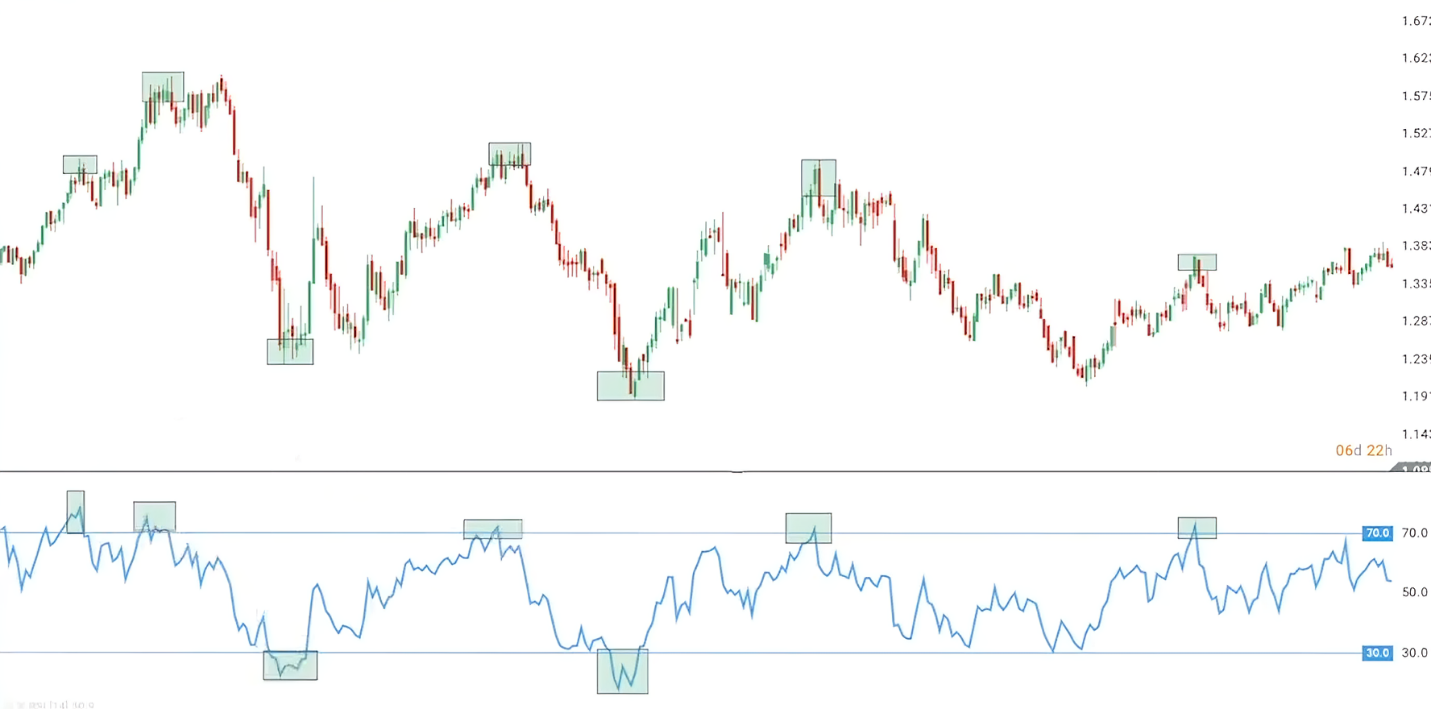
After RSI moved above 70, price did fall; after it dropped below 30, price rose.
The classic approach teaches: when RSI is above 70 - the market is overbought and you should sell. When it is below 30 - the market is oversold and you should buy. Sounds logical, right?
But let's be honest. If you've ever traded, you quickly realize that yes, sometimes it works, but in half of the cases it doesn't work at all. Price can enter the scary red zone and just stay there. It can keep rising and wipe out all stop-losses in its path. Why? Because using RSI in the classical way has shortcomings which we will refine.
Drawbacks of this approach
Overbought/oversold signals are unreliable:
- If something is oversold, that does not mean it cannot become even more oversold.
- False signals. For example, applying this logic to a chart can produce 5 signals and 4 of them may be losing ones.
- RSI cannot tell exactly how much the price will move up or down after a signal.
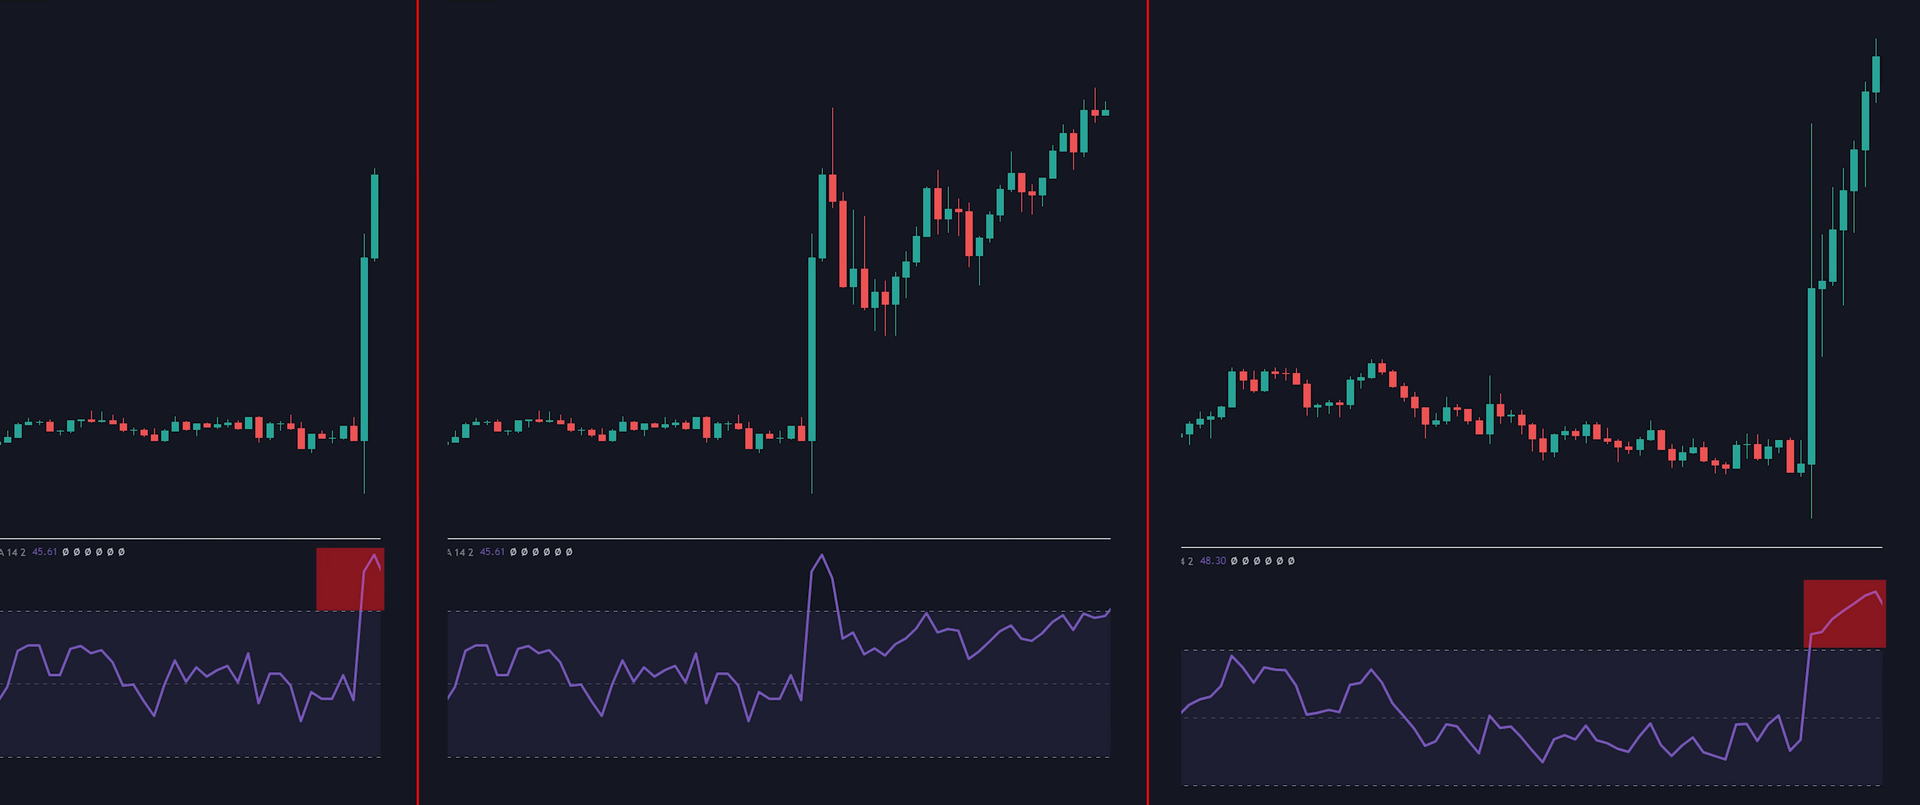
For example, with Bitcoin there were periods when RSI went above 70 and price kept rising for weeks, delivering up to 65% gains. Selling at the first touch of 70 would have cost you all that profit.
The chart below demonstrates that treating zones above 70 and below 30 as direct sell/buy signals is a major mistake.
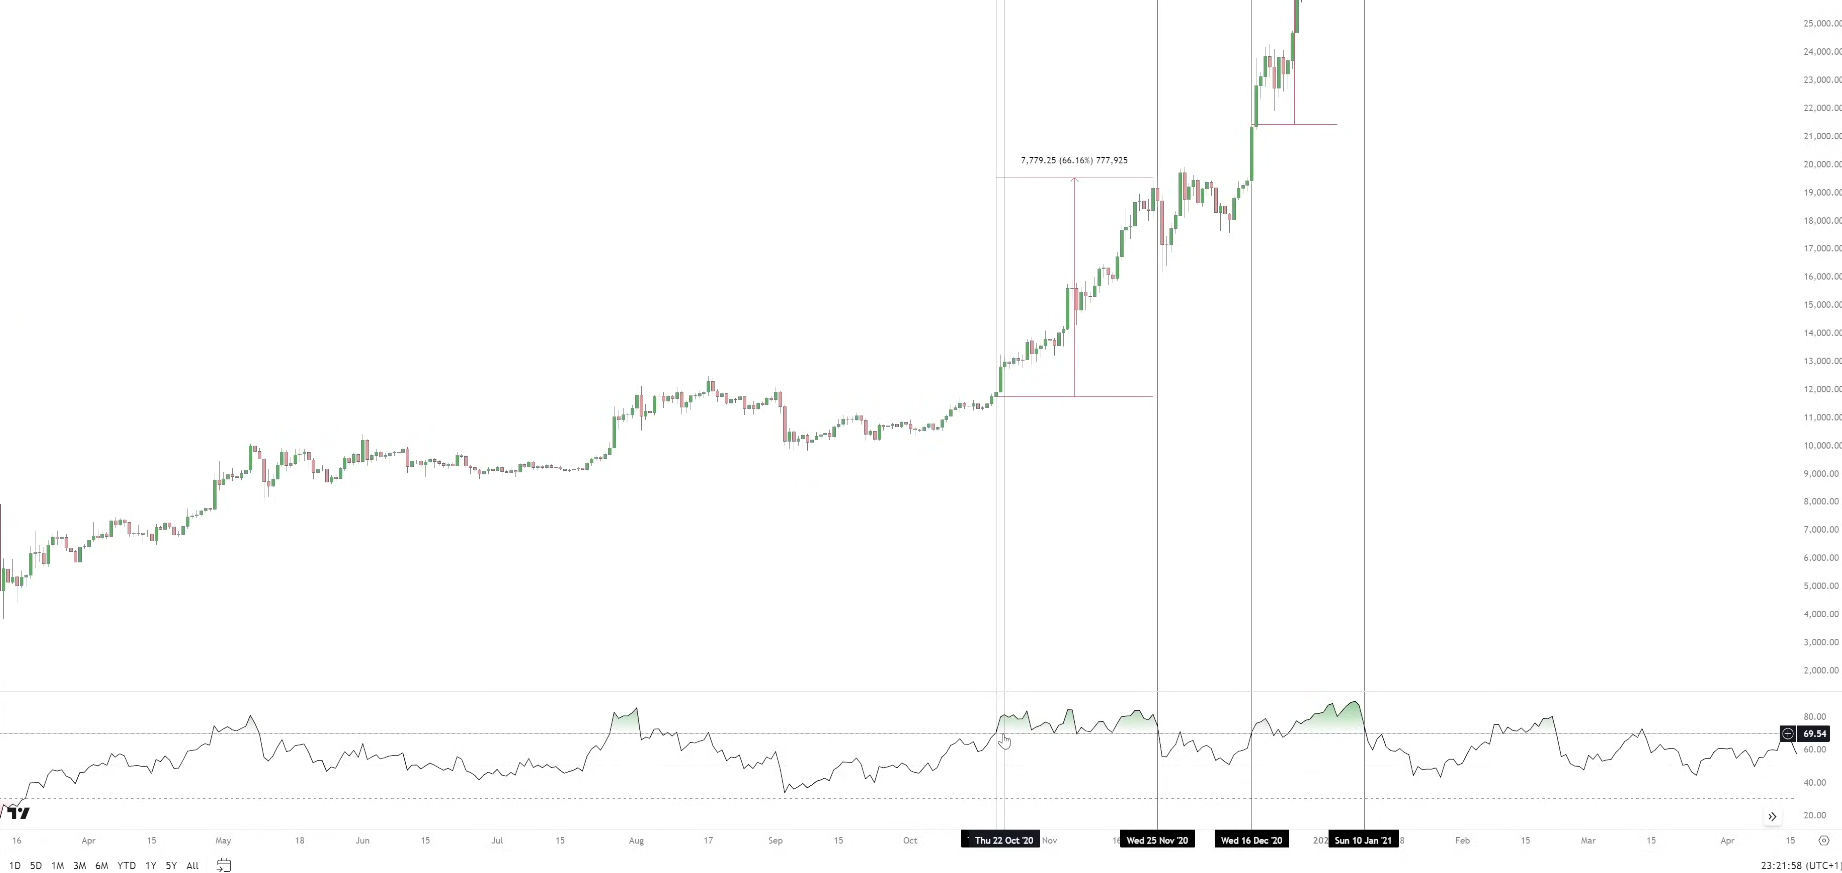
RSI acts more as a trend and momentum indicator, not necessarily a reversal indicator!
However, the classic approach isn't completely wrong - it just needs to be refined with other methods. One way to improve RSI is to change a couple of default settings.
RSI variant that reduces false signals
Every indicator gives false signals - that's how markets work. So the goal is to reduce false signals and increase the share of winning trades.
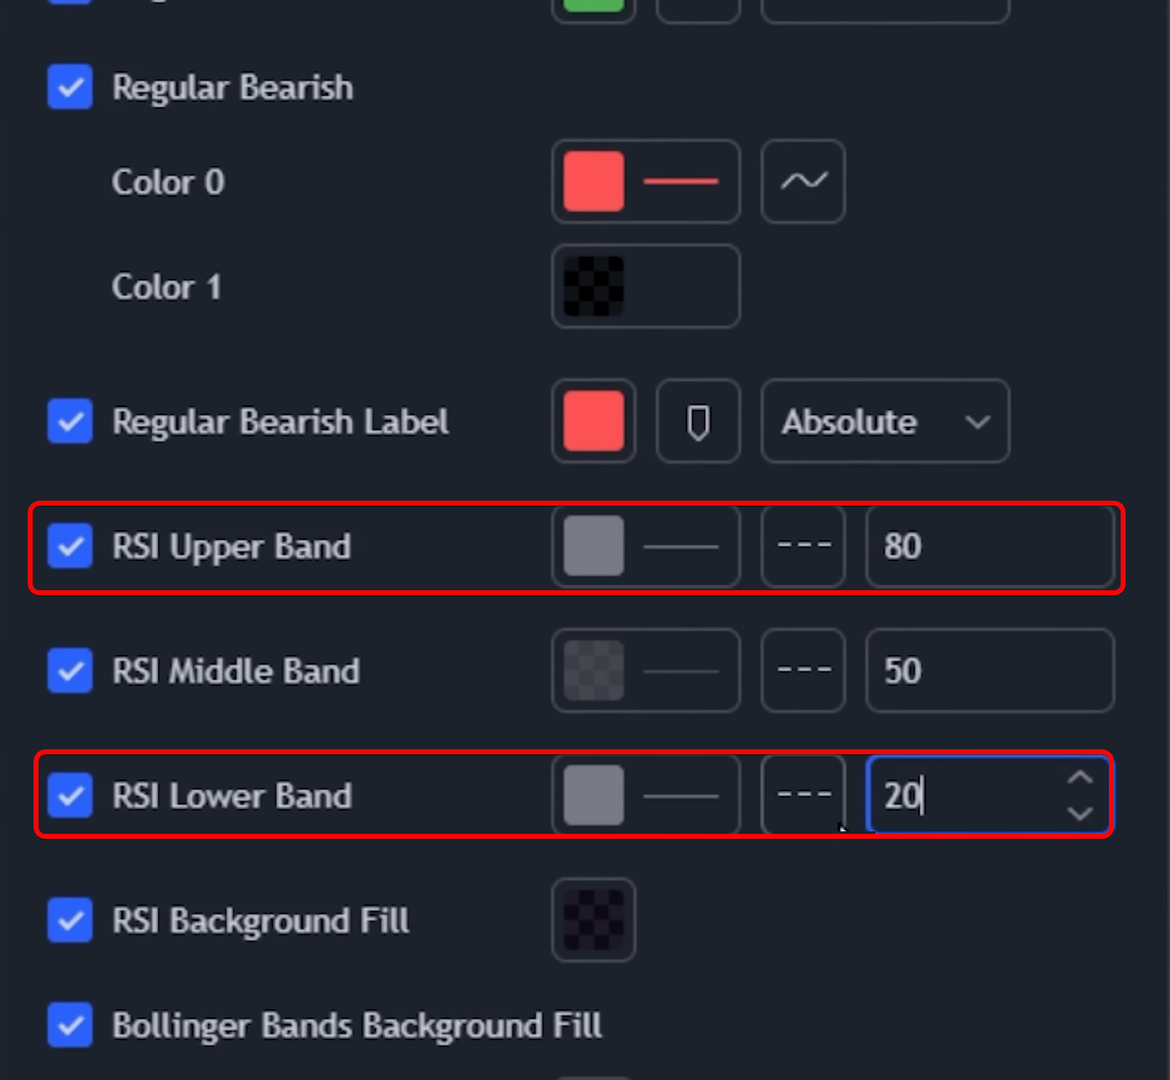
First, go into RSI settings where the standard overbought/oversold levels are 70 and 30. We prefer to set them to 80 and 20. This reduces the number of signals, but those that remain will be stronger and less likely to be wrong.
The second step is to confirm signals across multiple timeframes. For example, if two RSI signals appear on the 1-hour chart, check the RSI on the daily timeframe. If there's no signal on the daily, you should not enter - there's no confirmation from the higher timeframe.
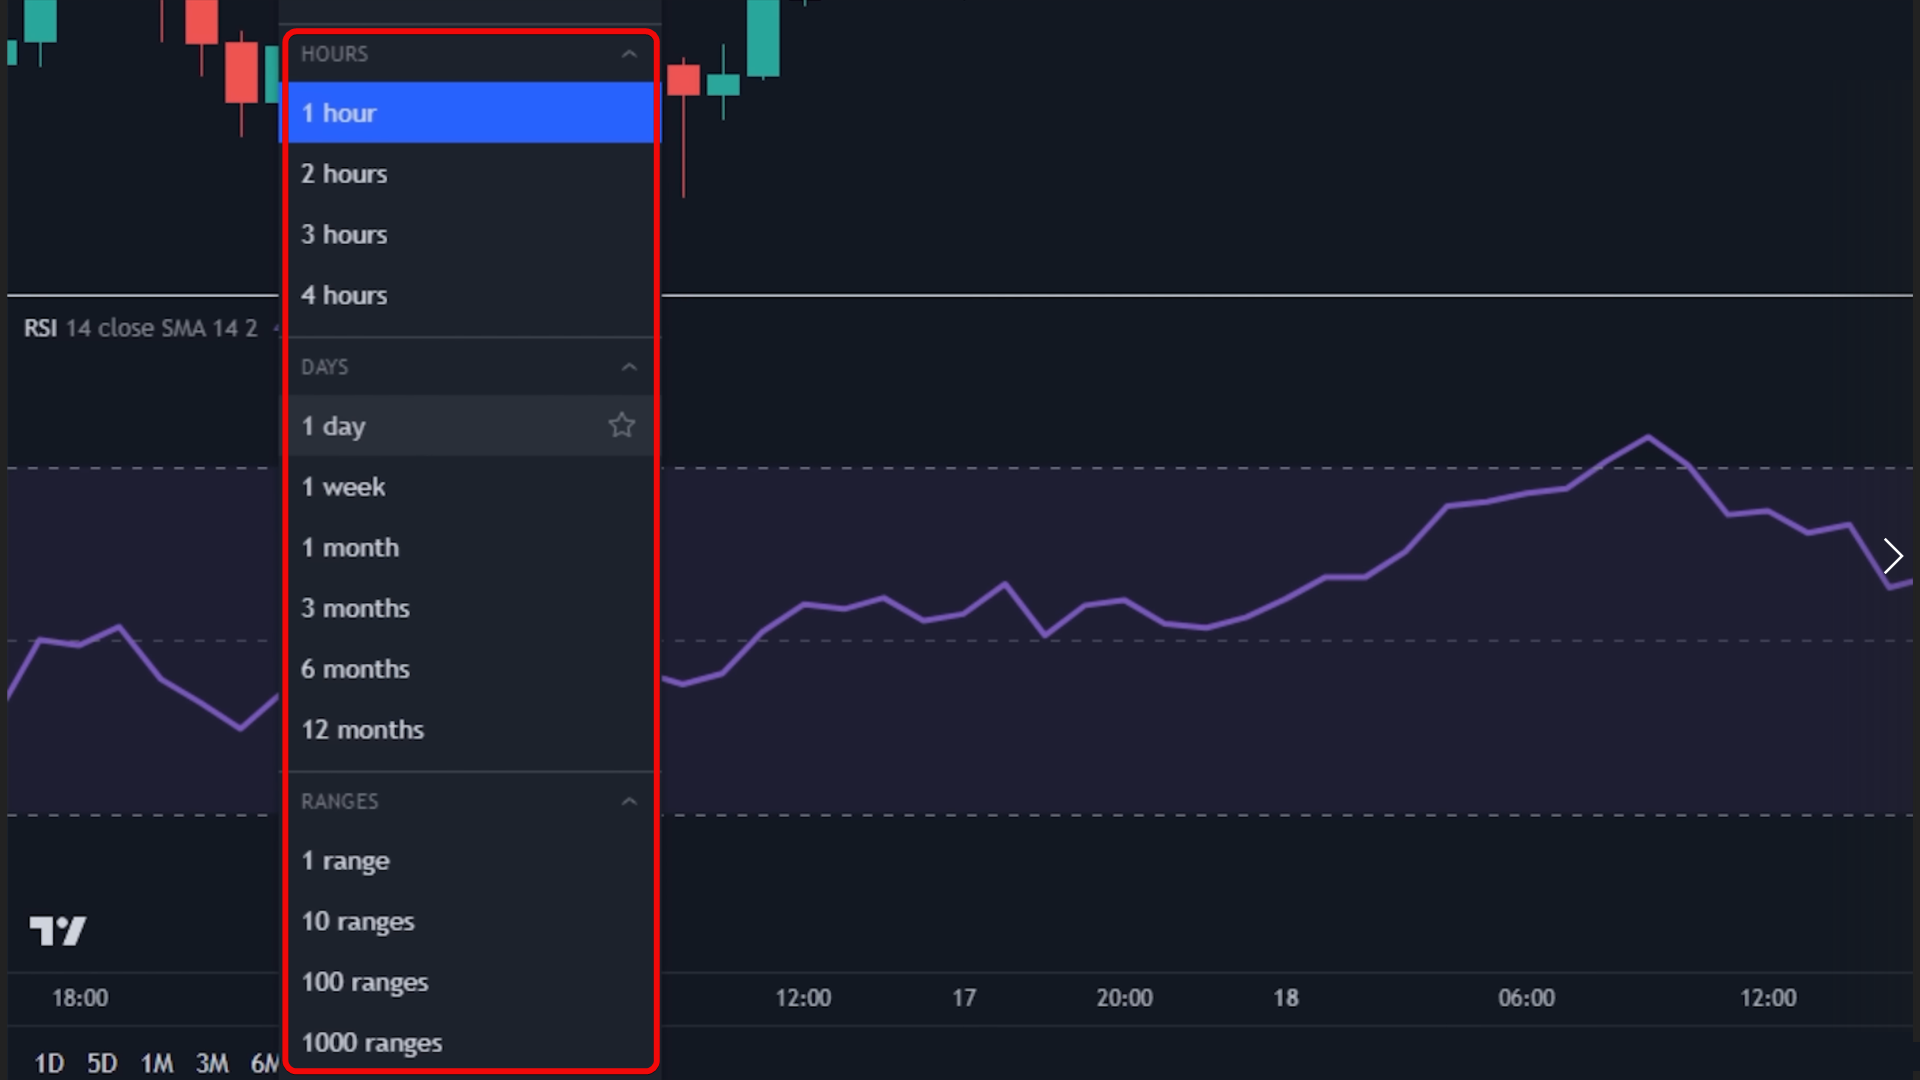
Experience has led to the rule: a signal on a lower timeframe (e.g., 1 hour) should be confirmed by a signal on a higher timeframe (e.g., 4 hours or daily). This filters out false entries.
Let's look at practical experience. Suppose we watch a 1-minute timeframe and price makes a parabolic move up, pushing RSI into the overbought zone. That's already a decent signal for a potential short, but we do not enter immediately!
First, move up to the next higher timeframe - the 5-minute chart. If RSI on that timeframe hasn't yet reached the overbought zone, we wait again.
Return to the 1-minute chart and if the price pulls back and then continues up - waiting was the right call.
Later, RSI on the 1-minute chart may re-enter the overbought zone and if at the same time the 5-minute RSI is also overbought and the 15-minute gives the same confirmation, this is a strong multi-timeframe signal for a short.
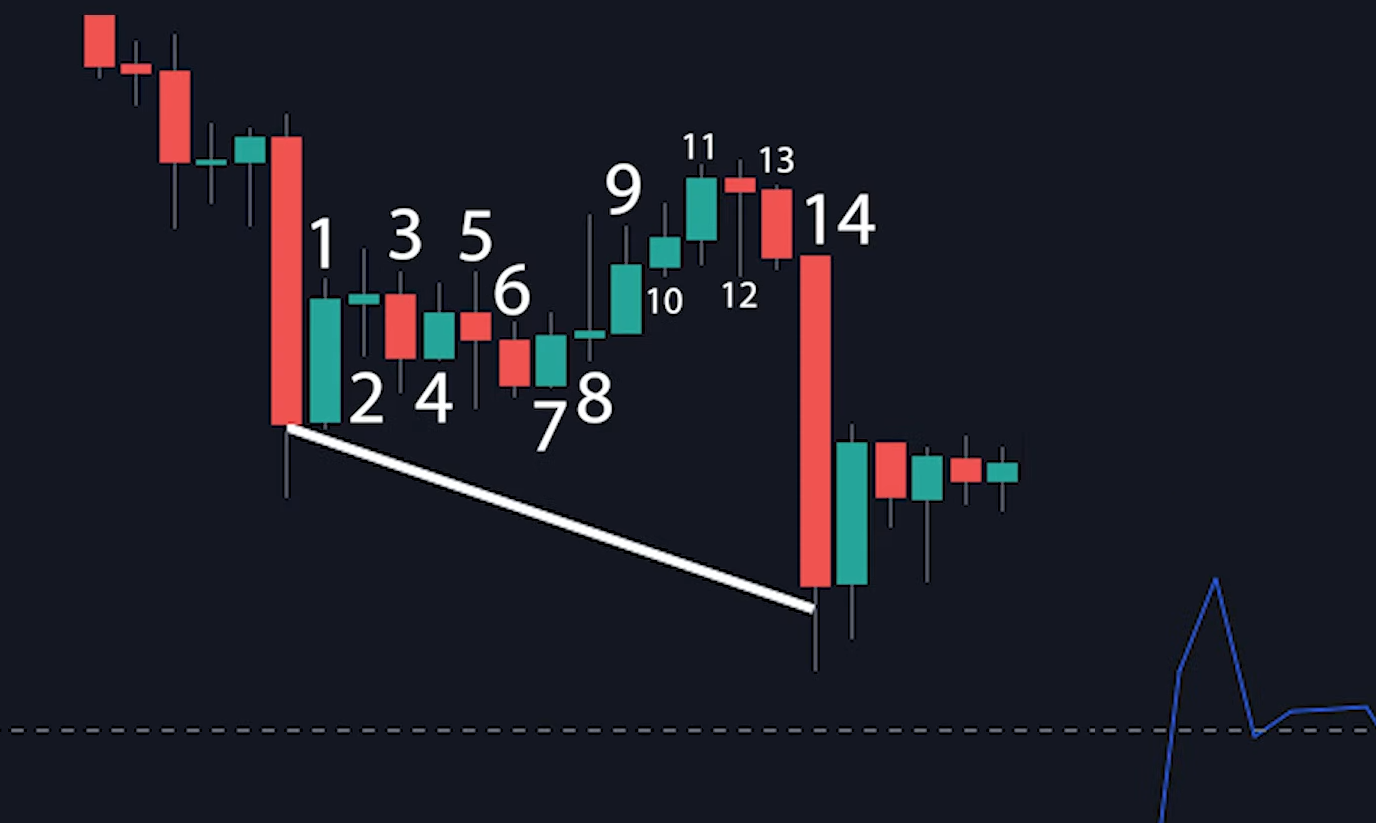
The third step is to wait for confirmation from price action (for example, a break of the two-candle low pattern).
Enter on the actual break of the low of those two candles (do not wait for the confirming candle to close) - that will be the moment to open the short.
Place a stop-loss just above the last local high / above the confirming candle.
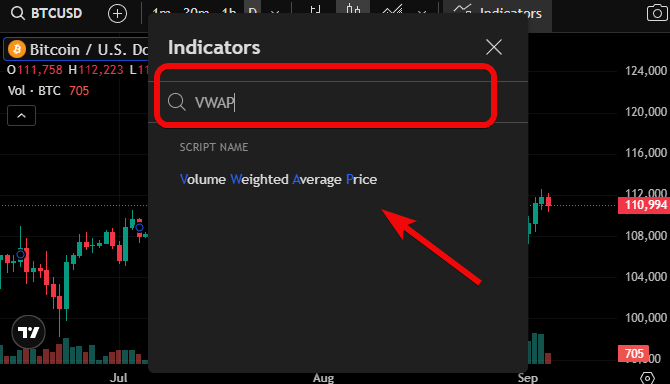
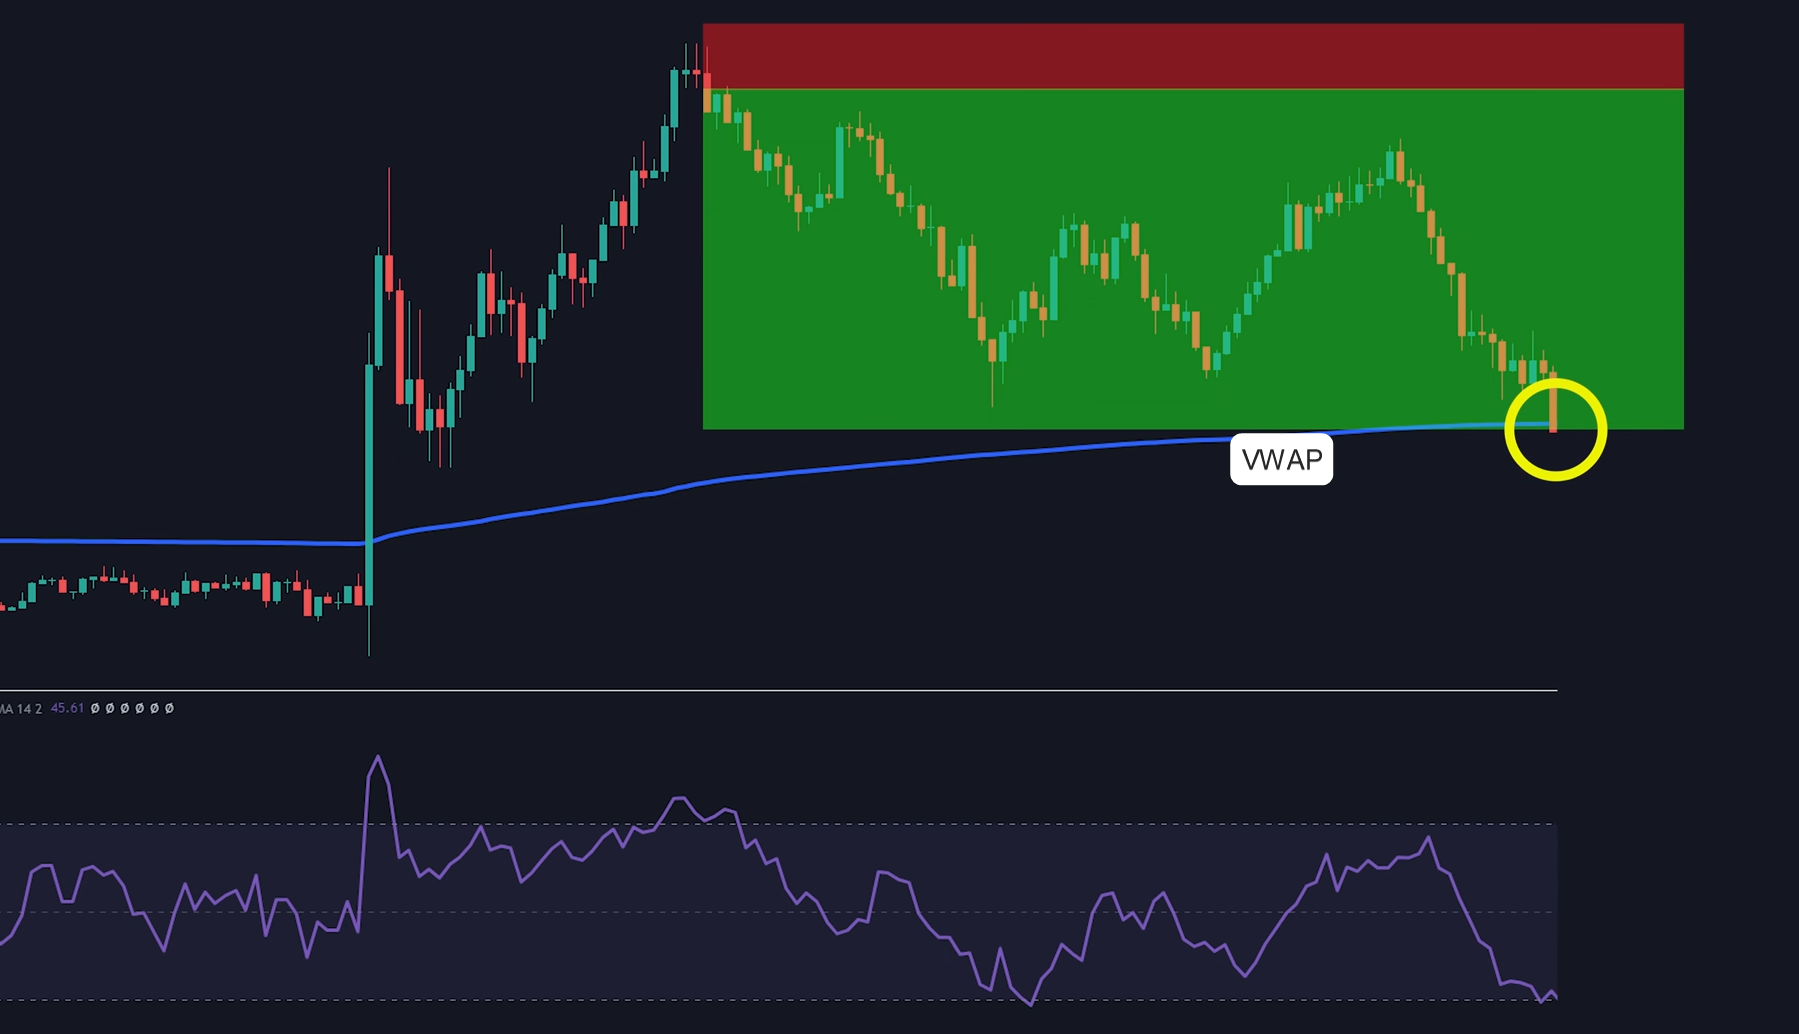
The fourth step is to add VWAP (the volume-weighted average price for the day) from the indicators list.
Then partially take profit (for example, 50%) when RSI returns to the middle. Take the remainder when price returns to the VWAP.
This way we significantly reduced false signals. But that's not all! Look at other variants as well.
RSI + MA variant - combining indicators correctly
Never use RSI in isolation, because it's not a magic money-printing machine.
Its real power only unfolds when combined with other tools to confirm your ideas.
Working combinations include:
- RSI + Moving Average (MA) - use MA as a trend filter. Price above the MA - look only for bullish RSI signals (e.g., bounces off the 50 level). Price below the MA - only bearish signals. This helps avoid trading against the trend.
- RSI + Volume / VWAP - RSI signals (like divergence, described below) are stronger if confirmed by a volume spike and a reversal candle. VWAP can be used to take profit - partly at the RSI midline, fully only when VWAP is tested.
- RSI + support and resistance levels - look for RSI reversal signals (like divergence) near key levels. Divergence at resistance is a sell signal; at support - a buy signal.
- RSI + MACD / other oscillators - use MACD to confirm RSI signals. For example, a MACD crossover combined with RSI crossing above/below 50 significantly increases signal reliability. MACD acts as an additional filter.
Let's consider which combinations yield better results.
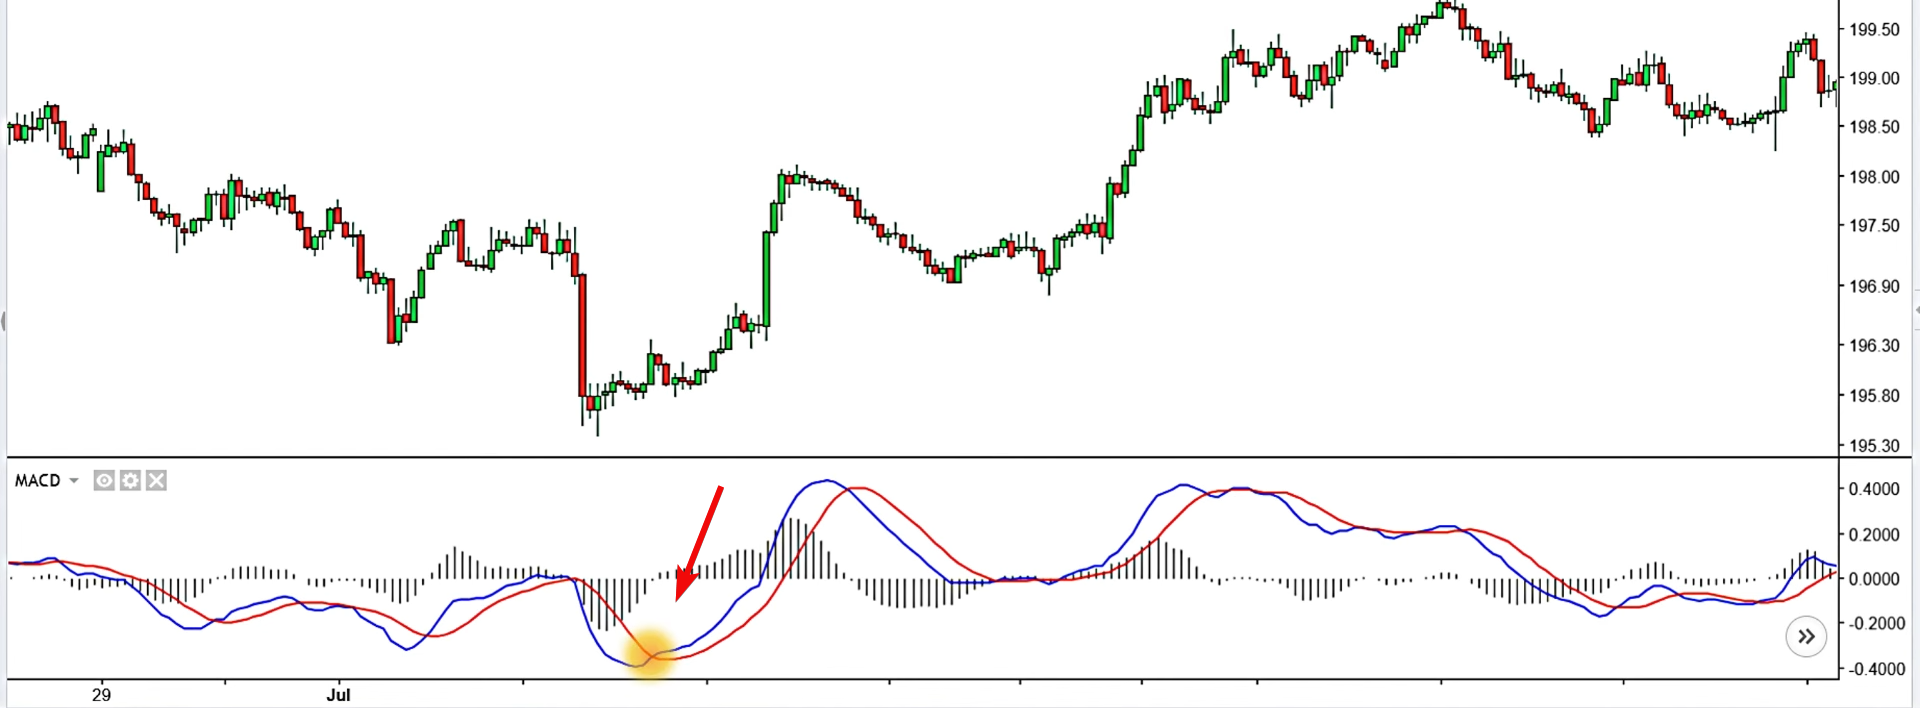
RSI + MACD
The pair of indicators significantly increases effectiveness. For example, RSI + MACD.
MACD - the moving average convergence/divergence - helps track trend direction and momentum strength.
The key signal is the MACD line crossing its signal line, which often points to a potential trend change.
Individually each of these indicators can sometimes give false signals. However, when used together they become more reliable.
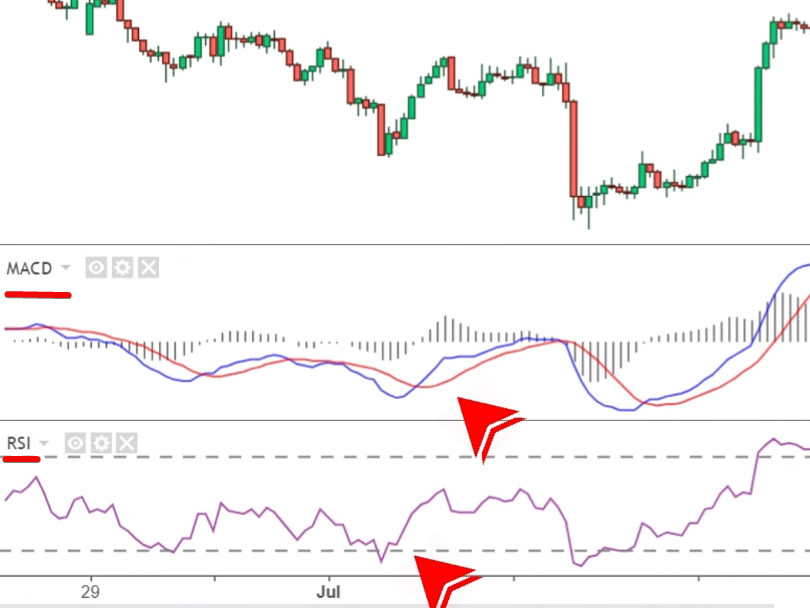
We'll show a step-by-step use of RSI + MACD. Don't worry - it's simple.
- First, stick to either the 15-minute or the 1-hour timeframe. Both are suitable for intraday trading.
- Then wait for the MACD line to cross its signal line from above to below. That's your first buy signal. But we don't rely on a single indicator!
- Now check the RSI. It should be rising from below 50, but should not yet be above 70. This is your momentum confirmation. Once both conditions are met, enter the trade at candle close.
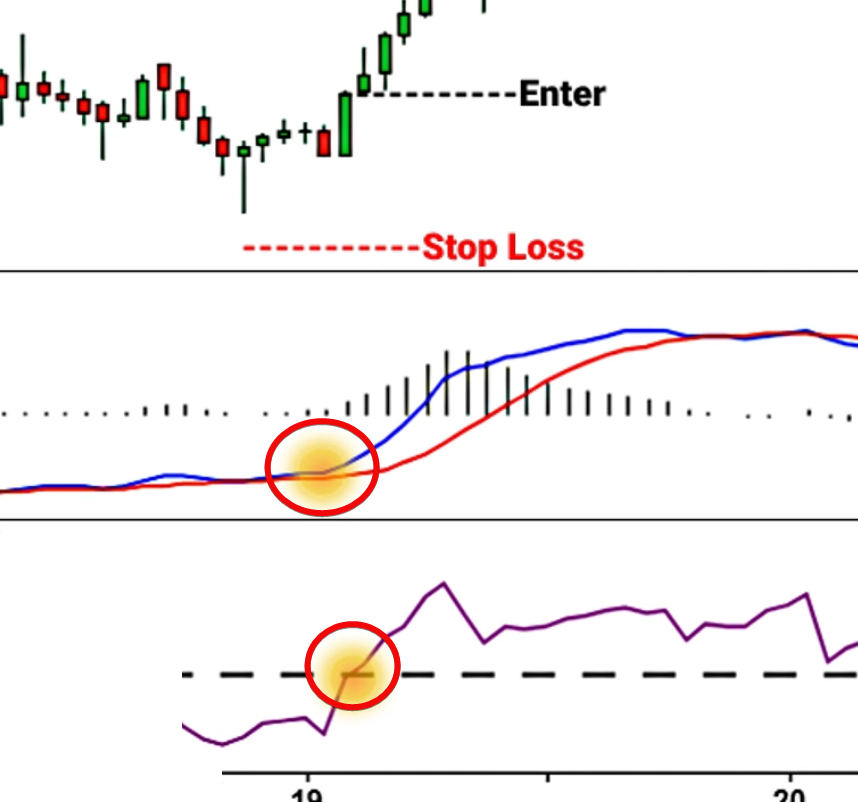
Place the stop-loss just below the nearest local low.
To exit a position, aim for a risk/reward ratio of 1:2. If RSI approaches 70, you can take profit early. This system lets you trade with the impulse rather than guessing, and that is its strength.
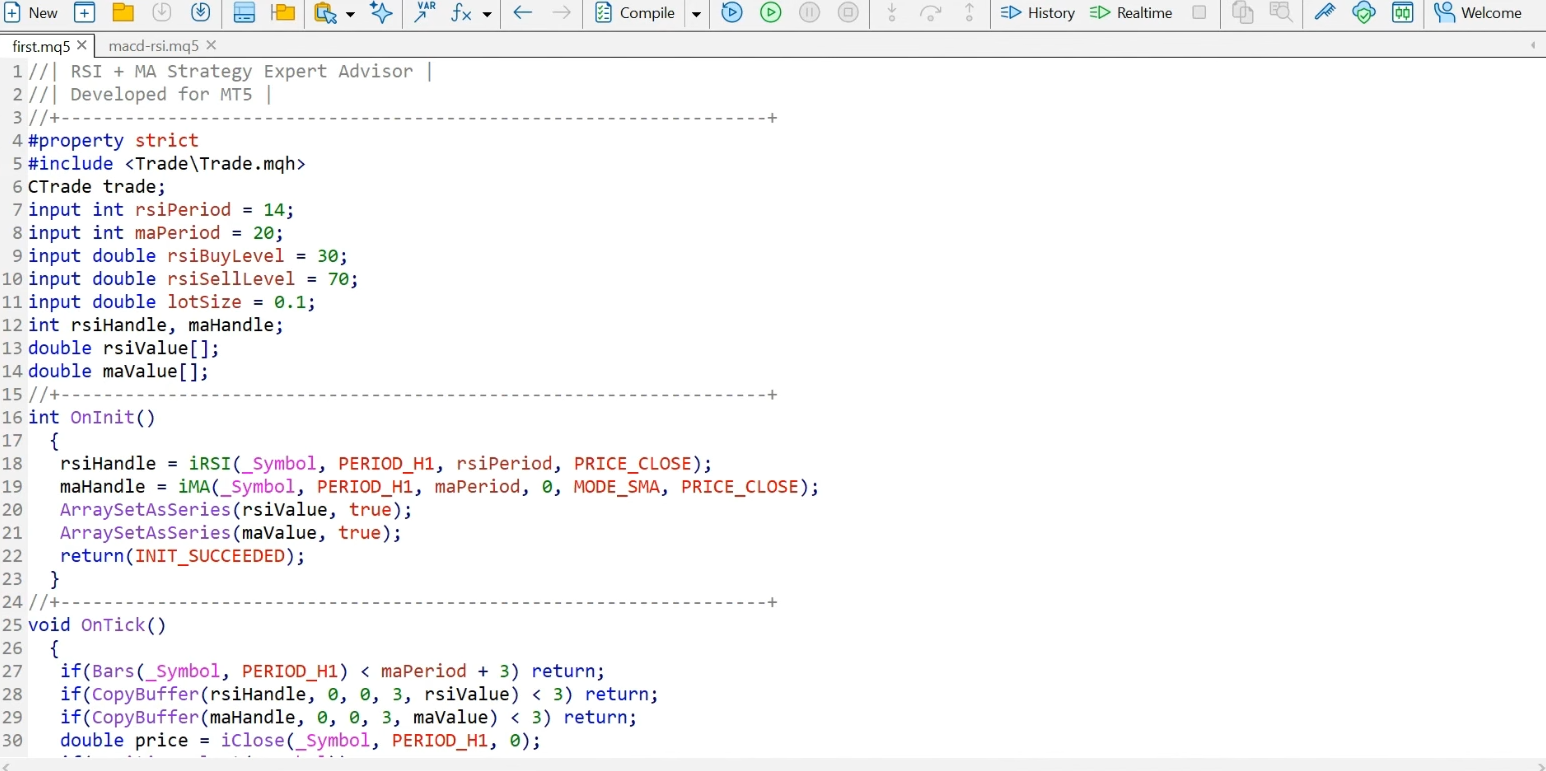
Backtesting RSI+MACD
We ran a backtest in MetaTrader in just a few minutes.
In future guides we'll show how to write such a script even with zero programming skills and how to run a backtest in MetaTrader 5. So bookmark us so you don't miss it!
And here are the final results:
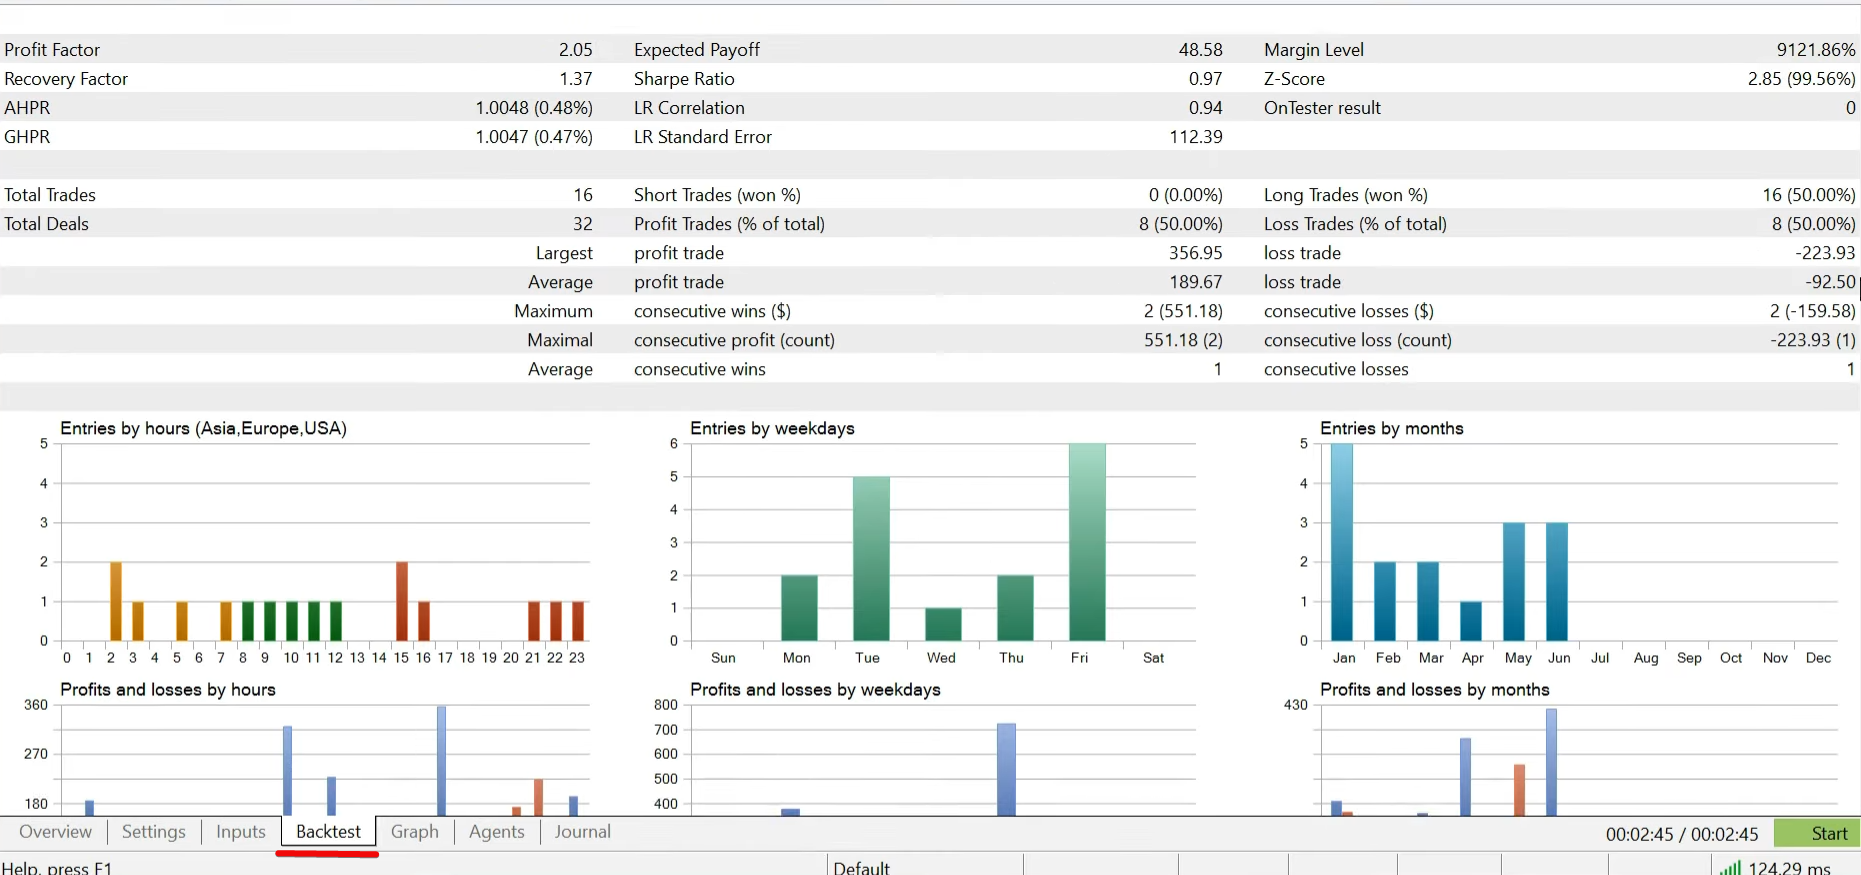
And here is the summary table from the backtest of the RSI+MACD strategy.
|
Metric |
Result |
Explanation |
|
Total number of trades |
16 |
Total number of executed trades |
|
Win rate |
50% (8 wins, 8 losses) |
Half the trades were profitable |
|
Net profit |
$777 |
Total net profit for the test period |
|
Starting balance |
$10,000 |
Initial account balance |
|
Growth |
7.70% |
Percentage account growth |
|
Largest profit |
$357 |
Largest profit on a single trade |
|
Largest loss |
$224 |
Largest loss on a single trade |
|
Profit factor |
2 |
Total profit was twice the total losses |
|
Maximum drawdown |
5% |
Maximum drawdown (peak-to-trough) |
|
Average winning trade |
$190 |
Average profit on winning trades |
|
Average losing trade |
$93 |
Average loss on losing trades |
As a result the strategy showed a 50% win rate, a return of about 7.7% on an initial $1,000 deposit, a profit factor of ~2, and a max drawdown of ~5%.
You need to test the approach yourself on other timeframes and assets.
RSI + Moving Average (MA)
This is one of the most effective and proven combinations, allowing you to filter out a huge number of false signals and trade strictly in the direction of the dominant trend.
The essence of the strategy is to use the moving average to determine the overall trend direction, and then use RSI to time entries within that trend.
It is enabled in the indicator settings under the Style tab.
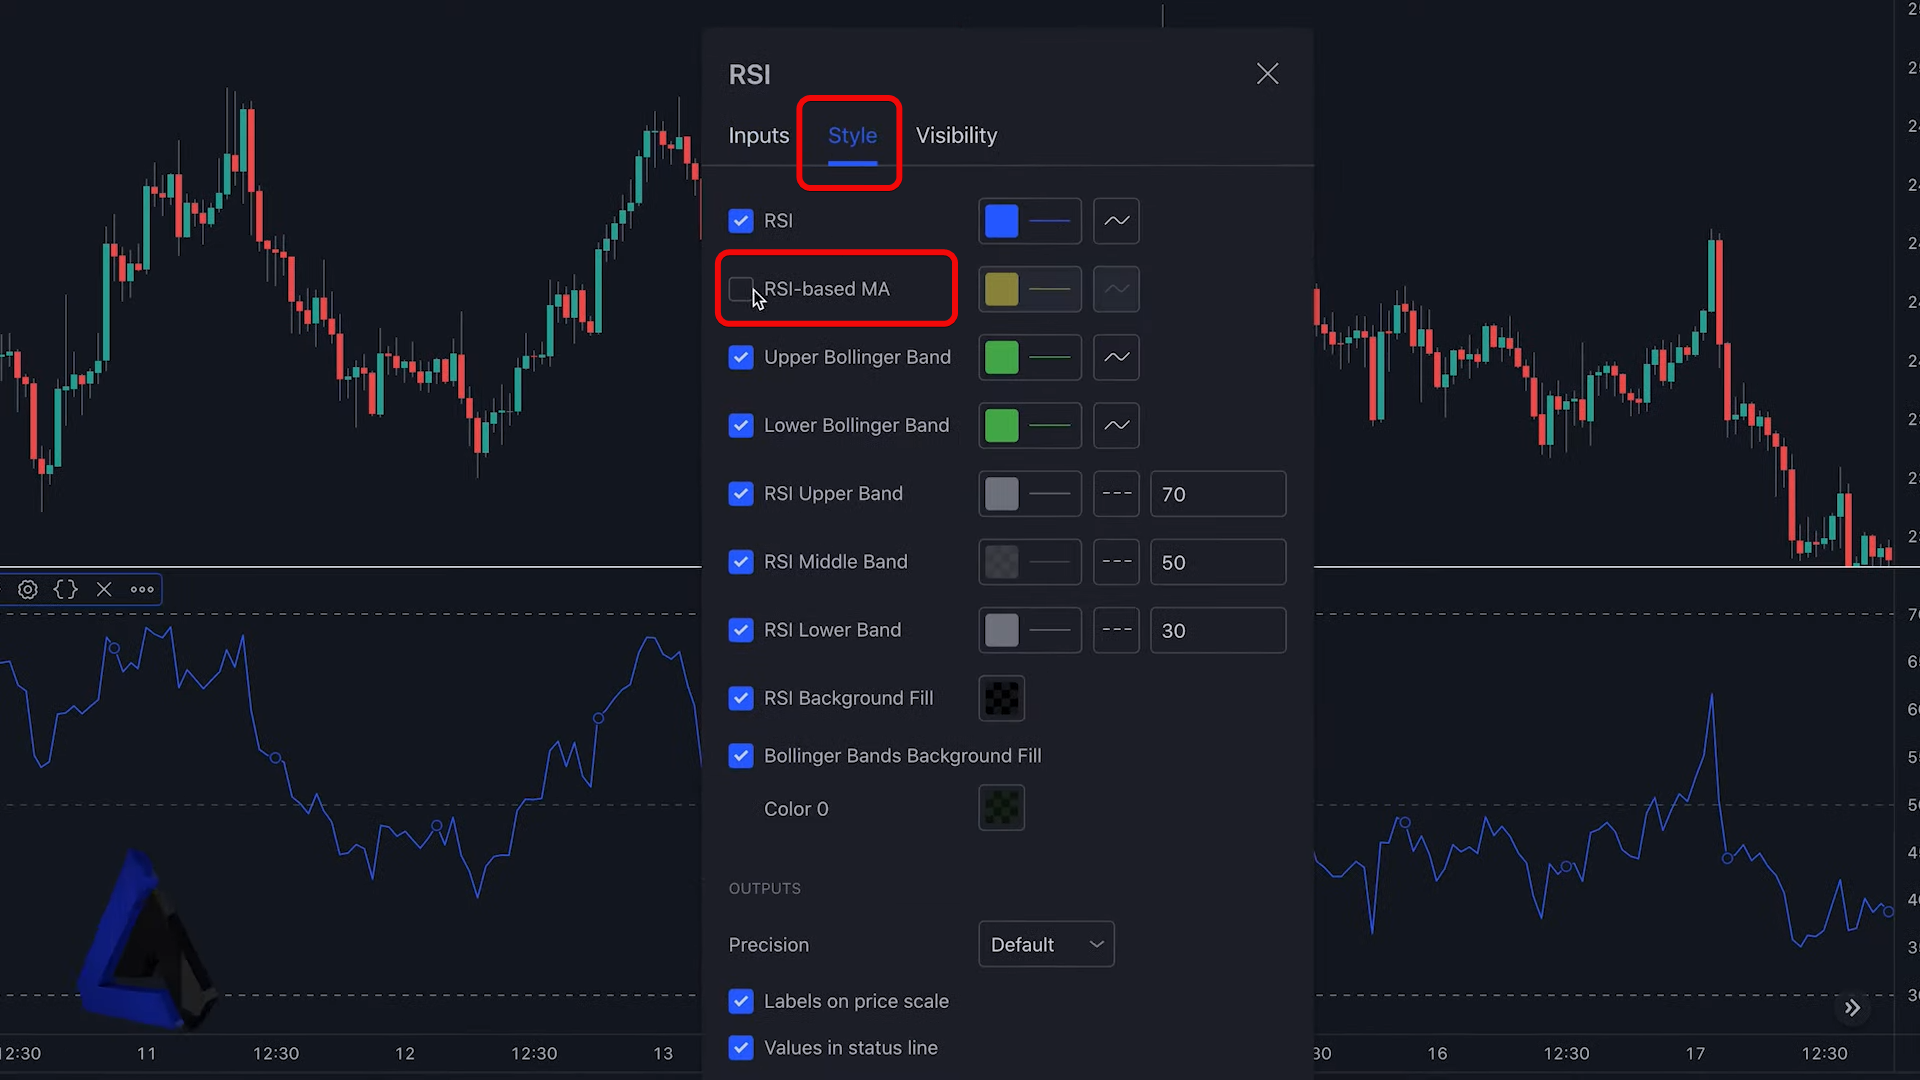
The strategy is simple. If price is above the moving average, look for buying opportunities; if below - look for selling opportunities. Therefore, even if RSI indicates oversold, but the trend remains bearish (price under the MA), you do not enter a long to avoid falling into a trap!
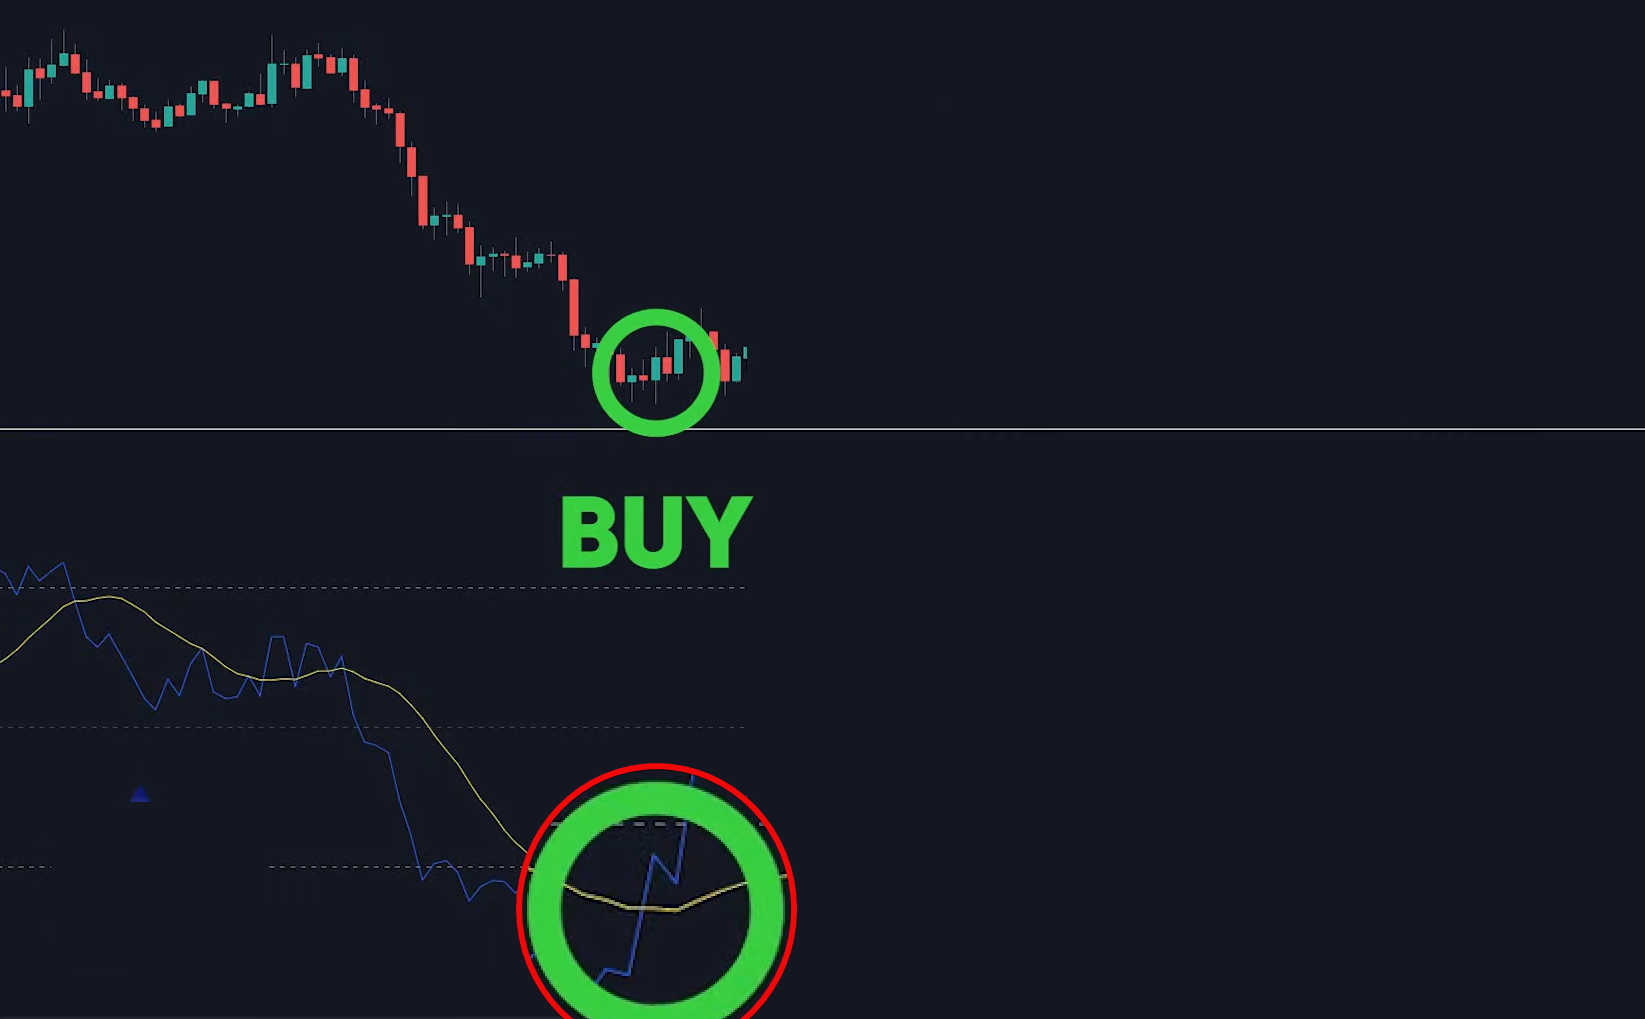
MA can be used as a signal line, for example when RSI crosses the moving average from top to bottom as a buy signal within a portion of the trading strategy. Or simply as a way to smooth RSI readings.
Divergence - the royal strategy
Divergence is, without exaggeration, the strongest signal RSI can give. It's the secret sauce that lets you look under the hood of the market and see that the current trend's strength is waning before it becomes obvious on price charts.
Simply put, divergence is a discrepancy between price movement and the RSI indicator.
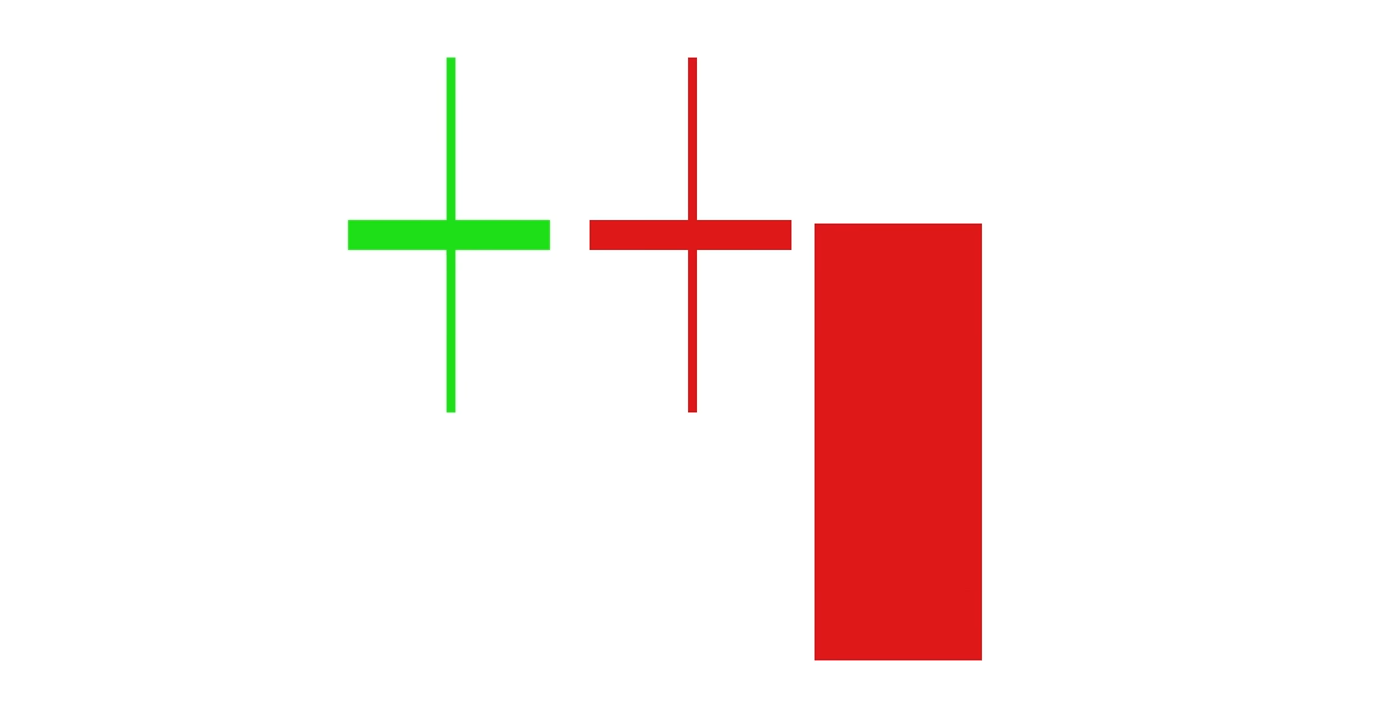
Divergence with RSI comes in two types:
- Bearish - price forms a new higher high while RSI forms a lower high. A signal for a possible reversal downward.
- Bullish - price forms a new lower low while RSI forms a higher low. A signal for a possible reversal upward.
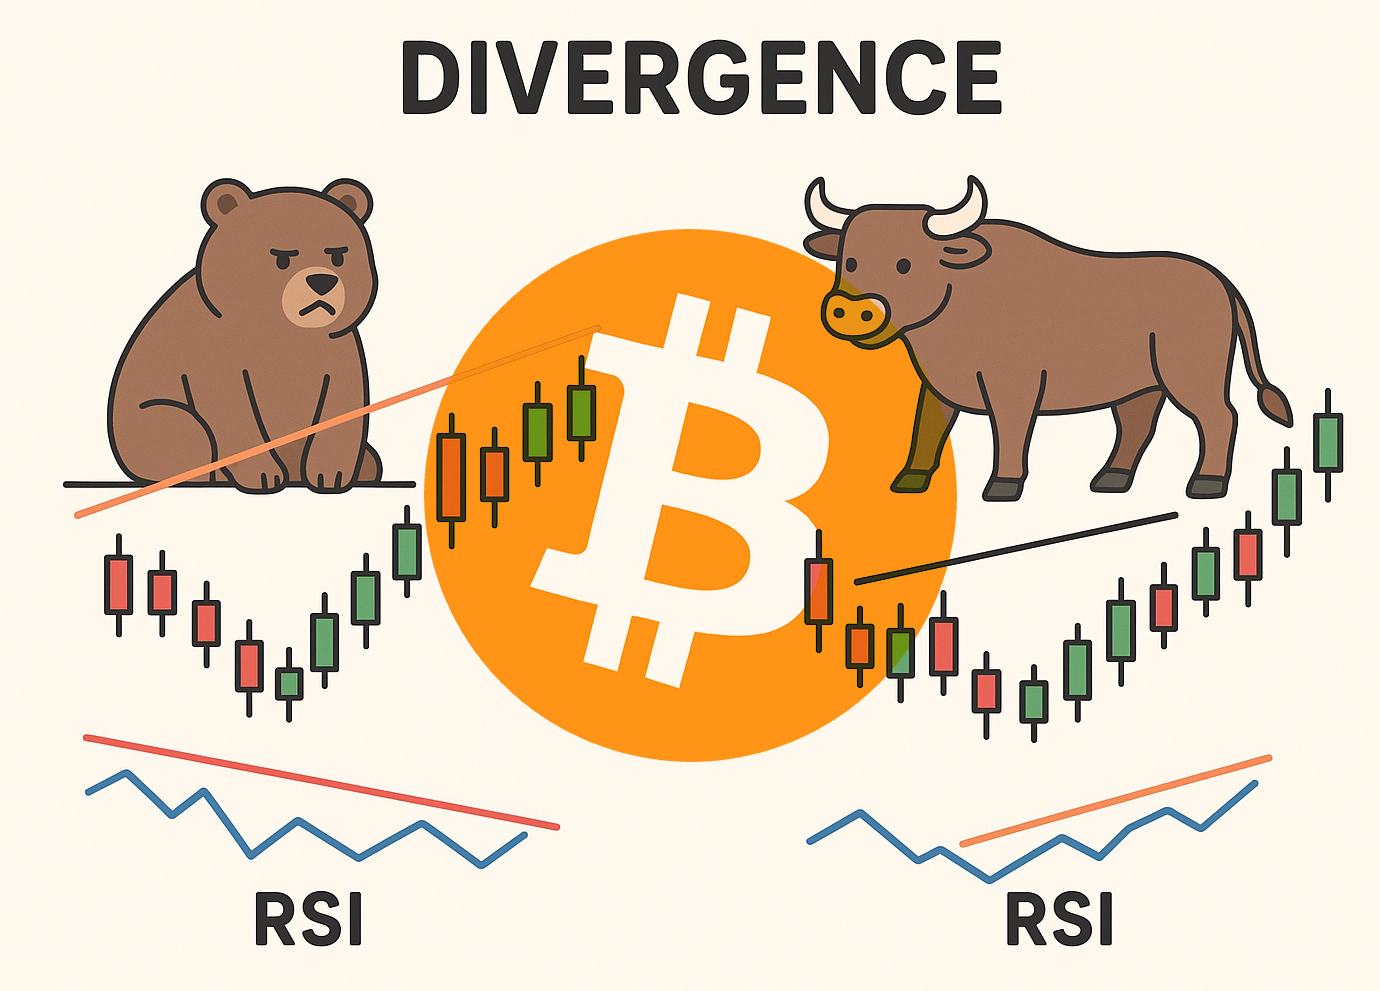
In bearish divergence price makes a new higher high while RSI makes a lower high. That's your warning to consider taking profits or even exiting!
In bullish divergence price makes a new lower low while RSI makes a higher low. Price is falling and shouting that things are getting worse. But RSI, our momentum gauge, says: wait! Selling pressure is actually easing!
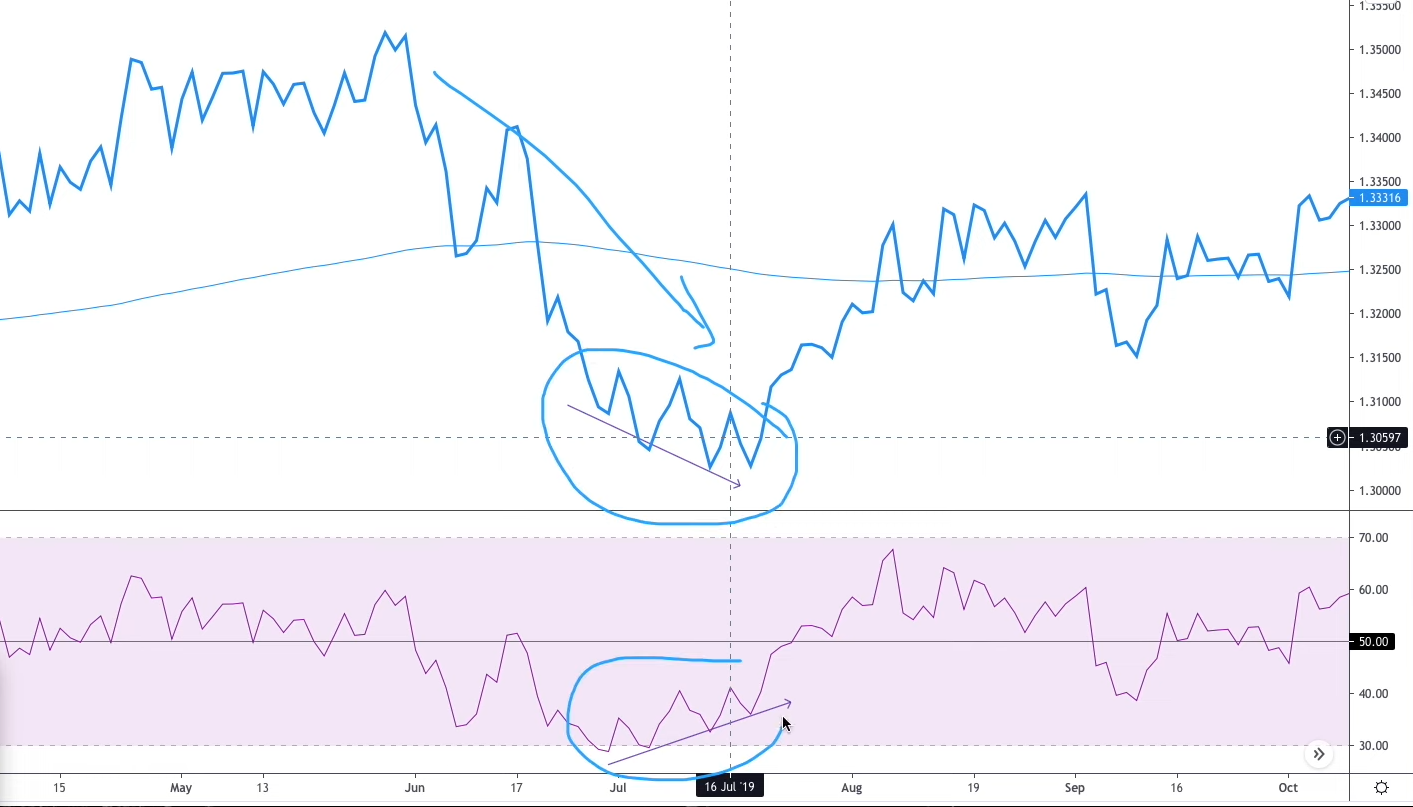
Practice shows divergences work best at extremes - i.e., when RSI is in an overbought zone (above 80) or an oversold zone (below 30). There they scream about a potential shift in momentum and a trend reversal.
Divergences can also be single or triple.
- Single divergence - the classic case where price makes a new high and RSI makes a lower high (bearish), or vice versa.
- Triple divergence - rarer but stronger, especially common in crypto. It occurs when price tries three times (or more) to update an extreme, while RSI successively makes lower peaks or higher troughs. This often signals trend exhaustion.
If you combine methods - for example, price is in an overbought zone, another indicator confirms it, and a bearish divergence appears - then open a short with a take-profit at the 50 RSI level. Such a composite approach increases the probability of a successful trade.
A common mistake is drawing a divergence before it is confirmed. You must wait for the price impulse to finish forming!
RSI Heatmap
An RSI heatmap is a tool that displays current RSI values for various coins or tokens in one place. Visually it is shown as a color scale from green (oversold) to red (overbought), allowing you to instantly assess the overall market situation.
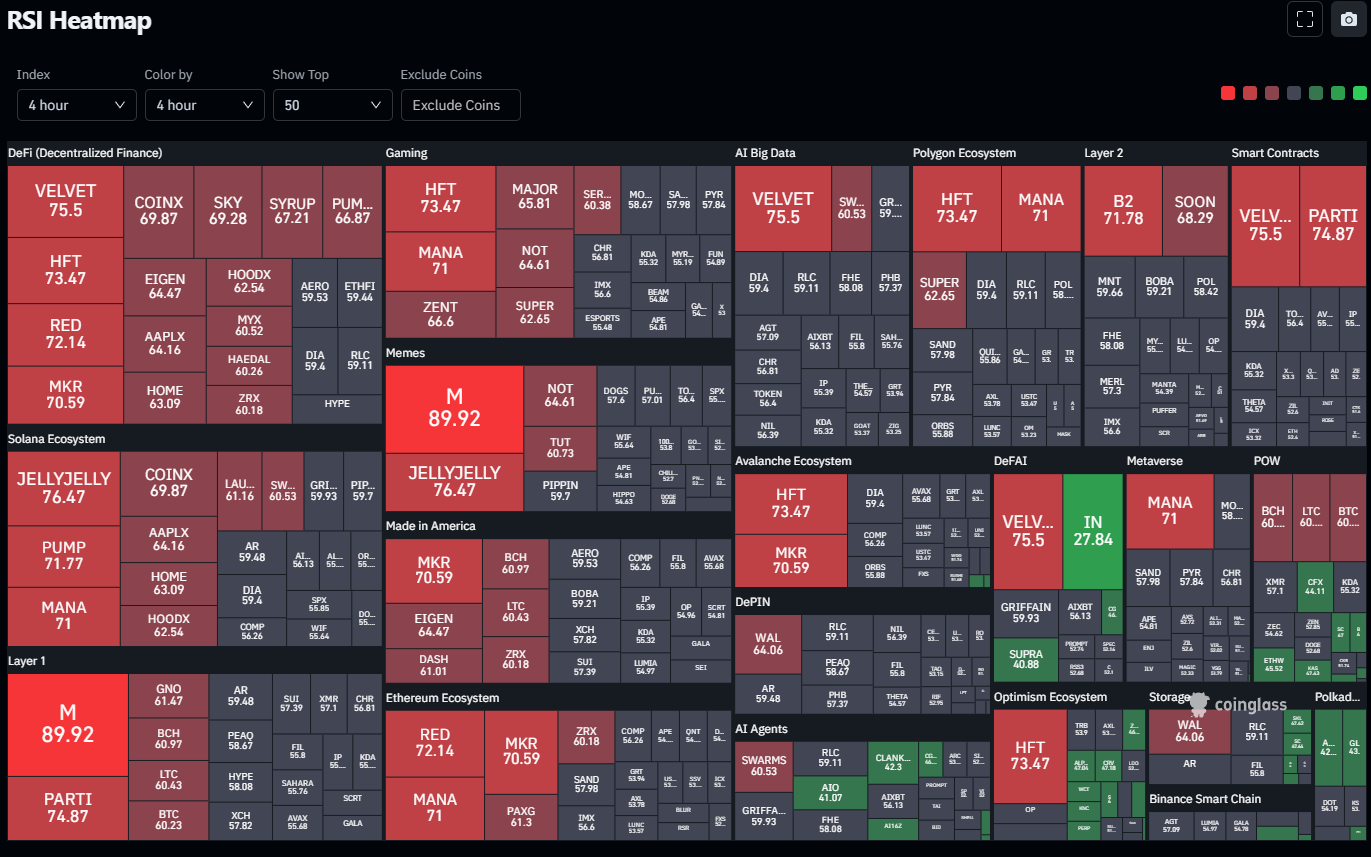
There are filters by ecosystems (Solana, Ethereum, AI, Meme, etc.) and you can view only the segment you need.
Below is a selection of convenient RSI maps:
- Coinglass – RSI map with categories
- Crypto Market RSI Heatmap – top 100 coins on a heatmap.
- Tradingdigits - top 50, L1, DEx, DeFi, Metaverse, AI, GameFi and memecoins.
Drawbacks
Things are not so smooth with this indicator. RSI doesn't account for the magnitude of moves. Small rises and sharp drops can look the same. Therefore RSI often lags and performs poorly in sideways markets. It is rarely used alone; trend indicators are usually added because of the large number of false signals.
Also, the indicator can constantly oscillate between levels 30 and 70, giving false buy and sell signals. As a result, a trader who follows every signal will constantly face drawdowns, taking loss after loss.
Other RSI drawbacks:
- It lags
- Gives false signals with default settings
- Ineffective in sideways markets
- Unreliable on low timeframes
- Poor when used alone without other indicators
- Does not provide precise timing of reversals.
Conclusions
This indicator can be used for both stocks and cryptocurrencies. It works best on higher timeframes (H4, daily). On lower timeframes (M15, M30, H1) it produces many false signals and is less effective.
The main misconception is that the overbought and oversold levels - 70 and 30 - supposedly signal a reversal. In practice this is almost always wrong! The indicator by itself does not predict actual highs and lows regardless of the overall trend.
The true purpose of RSI is to be a momentum indicator.
Divergences add another layer of edge. Bearish divergence forms when price updates higher highs while RSI shows lower highs, hinting at exhaustion of upward momentum and a likely correction.
What you can take away from this article:
- There is no holy grail. The same strategy can perform differently across markets (trending vs sideways).
- Use stop-losses, because no indicator gives 100% accurate signals.
- Combine RSI with other analysis methods (price levels, volume, moving averages).
- RSI is not about finding reversals at 70/30 - it's about assessing trend strength and finding quality entries with the trend (bounces off 50, divergences at extremes).
Write in the comments what else could be added.
Disclaimer: all information provided in this article should not be taken as financial advice! The article is for educational purposes only. Never invest more than you can afford to lose and consult only your personal financial advisor.

Now reading


In DePin, people create networks themselves, share traffic or capacity, and receive rewards in tokens from these projects.


The Ellipal firmware update enhances security (fixes vulnerabilities), adds support for new cryptocurrencies and tokens, and optimizes the interface and operational stability.


