Trend Strength Index (TSI): A Complete guide to crypto trends

You will learn about the Trend Strength Index (TSI) indicator – what it is for and how it helps in trading. As usual, we will also consider its drawbacks.
What is TSI?
The Trend Strength Index (Trend Strength Index, TSI) is a technical oscillator indicator designed to determine the direction of a trend and, more importantly, the intensity of its strength.
Unlike the True Strength Index version by William Blau, which is based on moving averages, this TSI variant is based on statistical analysis methods. More precisely, on the Pearson correlation coefficient.
Since the calculation is based on correlation, the amount of data (bars) critically affects the result:
- Short length (e.g., 5-14) – the indicator analyzes local dependency. It is incredibly sensitive and immediately reacts to the slightest changes in the price sequence.
- Long length (e.g., 50-100) – TSI looks for global linear dependency. It filters out market noise, showing only those trends that maintain long-term sustainability.

For example, if the price of Bitcoin rises, you will typically see TSI moving into positive territory, and vice versa. However, it is important to remember that no indicator is perfect.
TSI calculates its values based on historical data. Therefore, it can sometimes lag or be counterintuitive, reflecting past price movement rather than predicting the future!
Interpreting these signals is up to you, but understanding the basic values will help you see a clearer picture of the crypto market.
What are the fluctuation ranges of TSI?
The indicator oscillates in the range from -1 to +1, where the zero line is the central equilibrium point between bullish and bearish momentum. 0 is the base.
In some versions, the scale is also scaled to 100.

The TSI value directly reflects the strength of the movement. Here, +0.3 indicates a more powerful uptrend than +0.1.
In practice, most of the time the indicator is in a narrow corridor, often between -0.25 and +0.25. A breakout beyond these levels signals extremes:
- Overbought. High values (conditionally above
+0.25) – the rise was too fast. A downward correction is possible. - Oversold. Low values (below
-0.25) – sellers are exhausted. Time to look at a possible price bounce.
What is TSI for?
TSI can give you good entry and exit points for trades. TSI performs 5 tasks.
- Determines the trend direction. If values are above zero – bullish momentum. If below – bearish.
- Measures the trend strength. The further the line is from 0, the more intense the price movement.
- Identifies overbought and oversold zones. Extreme values (
+1and-1) show maximum trend strength.
- Generates trading signals. Provides faster entry or exit signals.
- Warns of reversals. Bearish divergence occurs when the price rises but TSI falls. This indicates momentum exhaustion and a high probability of a downward reversal.

The indicator shows the momentum of an asset relative to its volatility: if the price is rising, how strong is that trend? Is the price consolidating and is the trend weakening? This is exactly what we can use to determine entry and exit points.
Before practice, let's look at a few more important details – divergence and the lag mechanism.
Lag mechanism and divergence
TSI is a lagging indicator because it analyzes price movements that have ALREADY occurred. Therefore, it is better to use TSI not alone, but in combination with other tools, such as support/resistance levels or volume indicators.
Divergence is also an excellent additional clue that increases the probability of success, but it should not be used as the only signal for entry.
Divergence is a leading signal showing trend exhaustion before a reversal.

- Bullish divergence – the price reaches a new low, but TSI does not. This discrepancy warns that bearish momentum is waning and a reversal to the upside is possible.
- Bearish divergence – the price makes a new high, but TSI shows a lower peak. This signals a weakening of upward momentum.
What is the practical application?
You can use TSI to obtain specific trading signals:
- Crossing the zero line confirms a change in the long-term trend.
- Provides faster entry and exit points.
- If TSI oscillates near zero, this is a clear sign of a trendless market (sideways).
How to set up the TSI indicator?
On crypto exchanges, TradingView is commonly used. Here you can click on Indicators and enter Trend Strength Index in English.

After adding the indicator to the chart, it will appear at the bottom. You can remove it by clicking the delete button on the left.
On the right are the same settings – you can place the indicator at the top of the chart if you want.

On the left side, you can open the settings, starting with the Style tab.
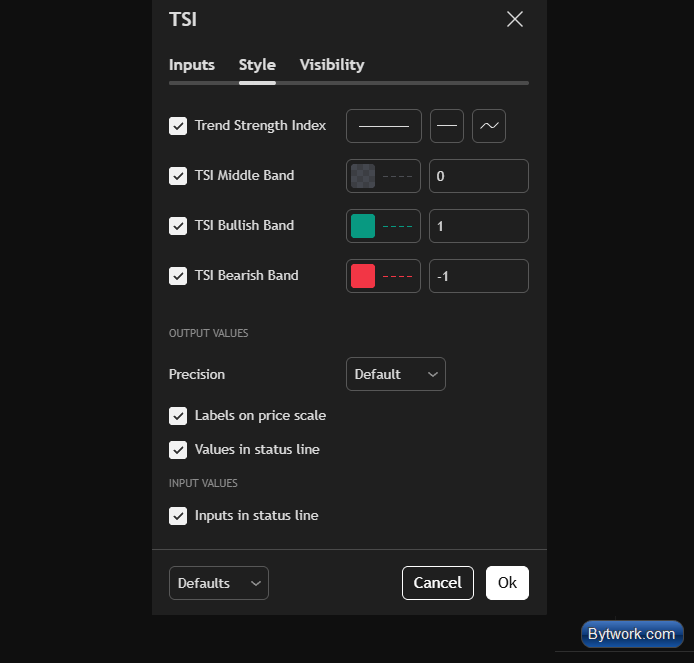
Here you can change the colors, but the most important thing is the levels: the middle line is at 0, the bullish level at +1, and the bearish level at –1. We recommend leaving them as they are, as this is standard for most oscillators showing bullish or bearish momentum.
What about timeframes?
Another important parameter is the indicator length, which is set to 14 by default. This means 14 periods: for example, on the weekly Bitcoin chart, the indicator will be calculated based on 14 weeks of price action, similar to a moving average or RSI.
Instead of analyzing a single price, the indicator takes into account the averaged movement over a certain period, and where the current price stands relative to this average determines bullish or bearish dynamics.
If the price is above the average, the oscillator moves towards the upper boundary; if below, momentum becomes bearish, and the indicator moves down.
The value 14 is quite suitable, but for longer-term analysis you can set 20, 30, or 50 periods.

For example, when changing to 20 periods, the indicator becomes smoother, and this allows you to better see the overall trend over a longer period of time.
We can also change the timeframe for calculating the indicator independently of the current chart.
By default, the chart timeframe is used: if we are on a weekly chart and the length is 14, then 14 weeks are calculated. If we switch to a daily chart, the calculation will be based on 14 days.
However, if we want to analyze long-term momentum to get signals on shorter timeframes, we can manually set a different period.
For example, leaving the length at 14 but selecting the weekly timeframe in the settings, we smooth out daily volatility, which makes signals clearer and more informative!

This is especially useful when daily fluctuations are too strong and interfere with analysis. Such settings help to better highlight weak and strong periods of the trend.

It is important to understand that this length is tied to the time interval of your chart. On a daily chart, length 5 means that TSI is calculated over the last 5 days. If you switch to a minute chart, the same length 5 will mean calculation over the last 5 minutes.
What are the trading strategies with TSI?
When trading with the Trend Strength Index, it is important to monitor the change in momentum, similar to working with other oscillators.
Traders try to determine the moment of momentum change and enter a trade in its direction. For example, a TSI crossover from bottom to top indicates a weakening of bearish momentum, after which the price may start to rise.
Entering at very low levels carries the risk that momentum may turn bearish again, while waiting too long risks missing the start of the trend!
You can use the crossing of the middle line or levels slightly below it – the choice depends on your strategy. The main thing is to wait for a momentum change and enter the trade at the beginning of the move.

What are the disadvantages of TSI?
TSI is not perfect: for example, sometimes after a short-term bearish momentum, there is a sharp rise, and waiting for the line crossover may lead to missing the trade.
Moreover, TSI does not determine the market type – for example, it will not show whether you are in a sideways trend or a strong downward movement. In a sideways market, momentum may temporarily increase due to price consolidation, and this could be mistakenly perceived as a reversal!

If you open a long position at such a moment, the price may not reach the upper boundary of the range and turn down again. Therefore, it is important to first determine your view of the market: do you think there is an uptrend or downtrend? In an uptrend, price weakness is often a good buying opportunity, and here TSI helps to wait for a momentum change to enter.
The indicator shows momentum, but not the market type or the future direction of the price – for that, other tools and macro analysis are needed.
It is also important to understand that TSI should not be used alone. For accuracy, combine it with other tools – support and resistance levels or volatility indicators like ATR.
What to combine TSI with?
To better catch trends, you can use TSI with a number of other indicators:
TSI + HHLL– this usesHigher High / Lower Lowlevels to confirm breakouts when TSI is strong.TSI vs RSI 2– TSI is very effective with the popular RSI strategy with a period of 2, where TSI shows better returns over time.- Using
Heikin Ashi– it is also useful to useHeikin Ashicandles together with RSI to achieve accuracy.

The combination with HA bars is effective because TSI compares two variables: closing prices and bar indices, which essentially represent time.
TSI calculates how strongly the price rise or fall coincides with the passage of time. If with each new bar the price closes higher than the previous one, the correlation becomes positive and tends to the maximum.
In trading strategies, TSI and RSI are often used together: for example, RSI can show trend strength, while TSI can confirm its direction or filter out false signals.
Summary
In summary, the Trend Strength Index is an indicator that calculates the correlation of price movements based on historical closing prices. If the price shows a tendency to close higher, TSI will generally also move up. Conversely, if prices start to reverse, the indicator will follow them. This creates a close relationship between the indicator's readings and the price.
The task of the trader is to determine for themselves the best way to use this indicator in their trading, always remembering that, like any other indicator, it can lag and may work better for some assets or timeframes than for others.
Whether to use TSI or explore other indicators in the Trading section, where we have posted more than 50 materials – the choice, as always, is yours. Happy trading! Your editor - Maxim Anisimov for the site bytwork.com.
Disclaimer: all information provided in this article should not be taken as financial advice! The article was created for educational purposes. Never invest more than you can afford to lose, and seek advice only from your personal financial advisor.

Now reading


In DePin, people create networks themselves, share traffic or capacity, and receive rewards in tokens from these projects.


The Ellipal firmware update enhances security (fixes vulnerabilities), adds support for new cryptocurrencies and tokens, and optimizes the interface and operational stability.


