VWAP Strategy: Filtering out 80% of fakeouts using volume analysis
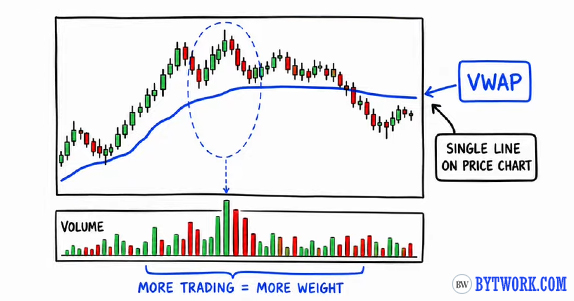
VWAP will reveal itself to you through:
- 3 market regimes,
- timeframe hierarchy,
- specific setups with numbers,
- and a checklist that cuts out 80% of false entries.
This is not another guide on how to trade with VWAP – it is a map of applicability. We will show you where the indicator works, where it lies, and how to avoid being among the traders who use it on the wrong market at the wrong time.
By the end of this article, you will be able to integrate VWAP into your trading system, taking into account trend, range, higher timeframes, and volume profile.
What is VWAP and why is it important?
VWAP shows the average transaction price for the day, weighted by volume, highlighting the logic of market makers. Large funds and institutions use it as a trigger for executing huge orders. That is why VWAP completely loses its effectiveness if there is no fuel in the market – institutional players.
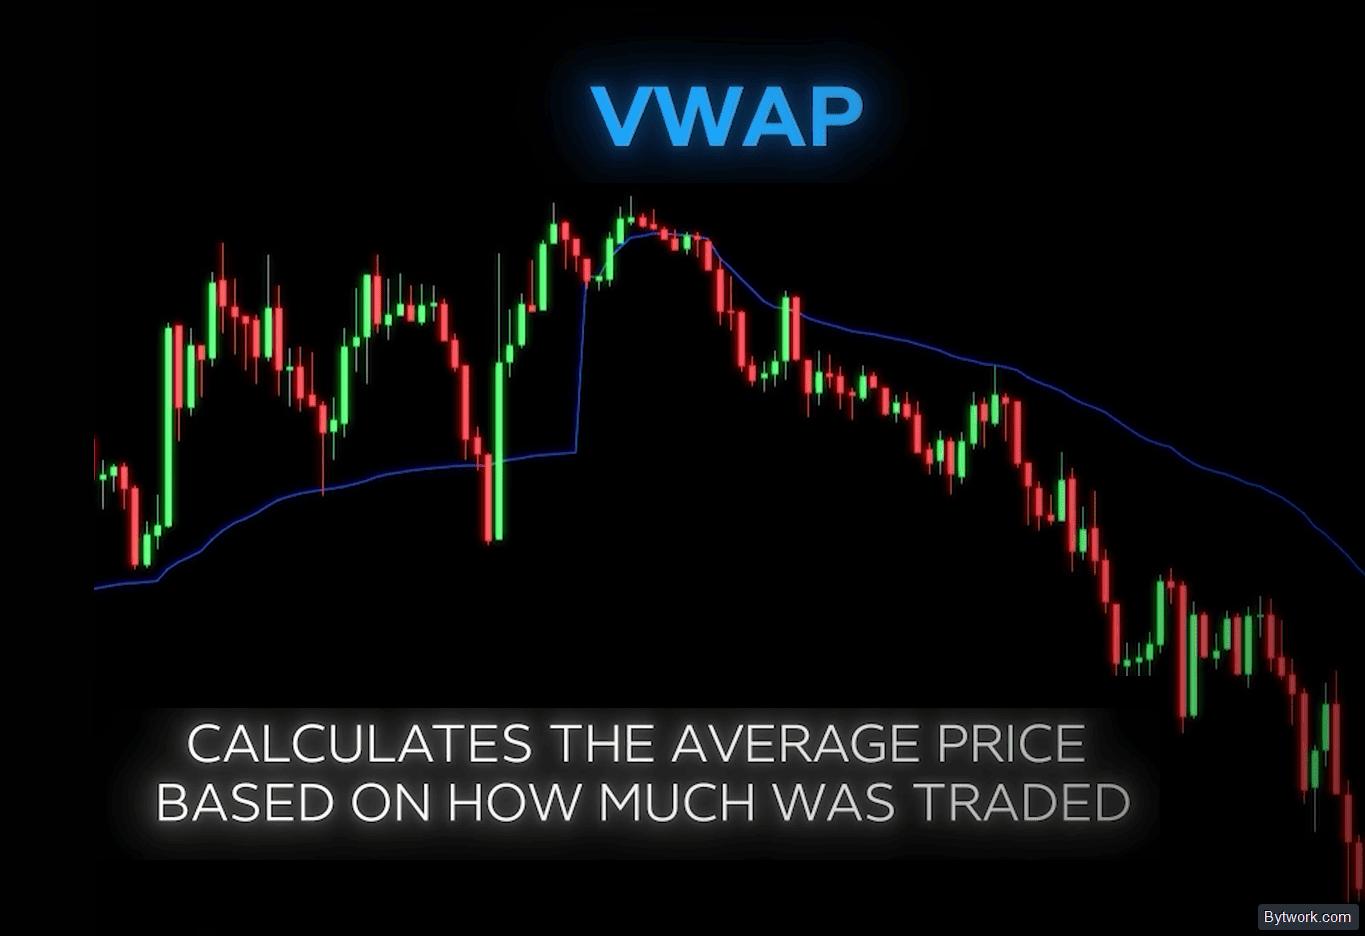
Algorithms gradually build positions (e.g., BTC positions or 1 million shares of Apple) throughout the session. They aim for an average closing price as close to VWAP as possible to avoid slippage and extra costs. This creates a strong magnetic pull on the market, which we will exploit.
VWAP works in stocks, crypto, and forex, but there are nuances. In the stock market, the metric achieves ideal accuracy based on NYSE/NASDAQ transactions. In crypto, you must manually select a specific exchange like Binance or Bybit. In forex, the indicator is replaced by Anchored VWAP on CME futures.
3 Types of VWAP
The foundation of the strategy rests on 3 types of VWAP, each controlling price within its own time horizon.
- Daily VWAP resets every session and highlights intraday activity of large capital.
- Weekly VWAP captures positioning at medium-term reversals.
- Monthly VWAP reveals global movement and serves as an anchor for long-term players.

We see that there are timings:
- Daily VWAP resets every 24h and gains strength 1–2 hours after the technical reset at 00:00 UTC, a new token listing, or a sharp volume spike.
- Weekly VWAP requires volume accumulation over the full 24h period.
- Monthly VWAP defines the global trend after skipping the first 10 days of the month.
Filtering False Entries
A key insight that changes the way you read VWAP is combining it with the volume profile to create convergence zones. This is overlooked by 90% of traders.
Volume Signals and Slope of the Line
Combining VWAP with the volume profile allows you to find liquidity confluence zones. When the indicator crosses a high‑volume node, a reliable anchor is formed, pointing to a cluster of large limit orders.
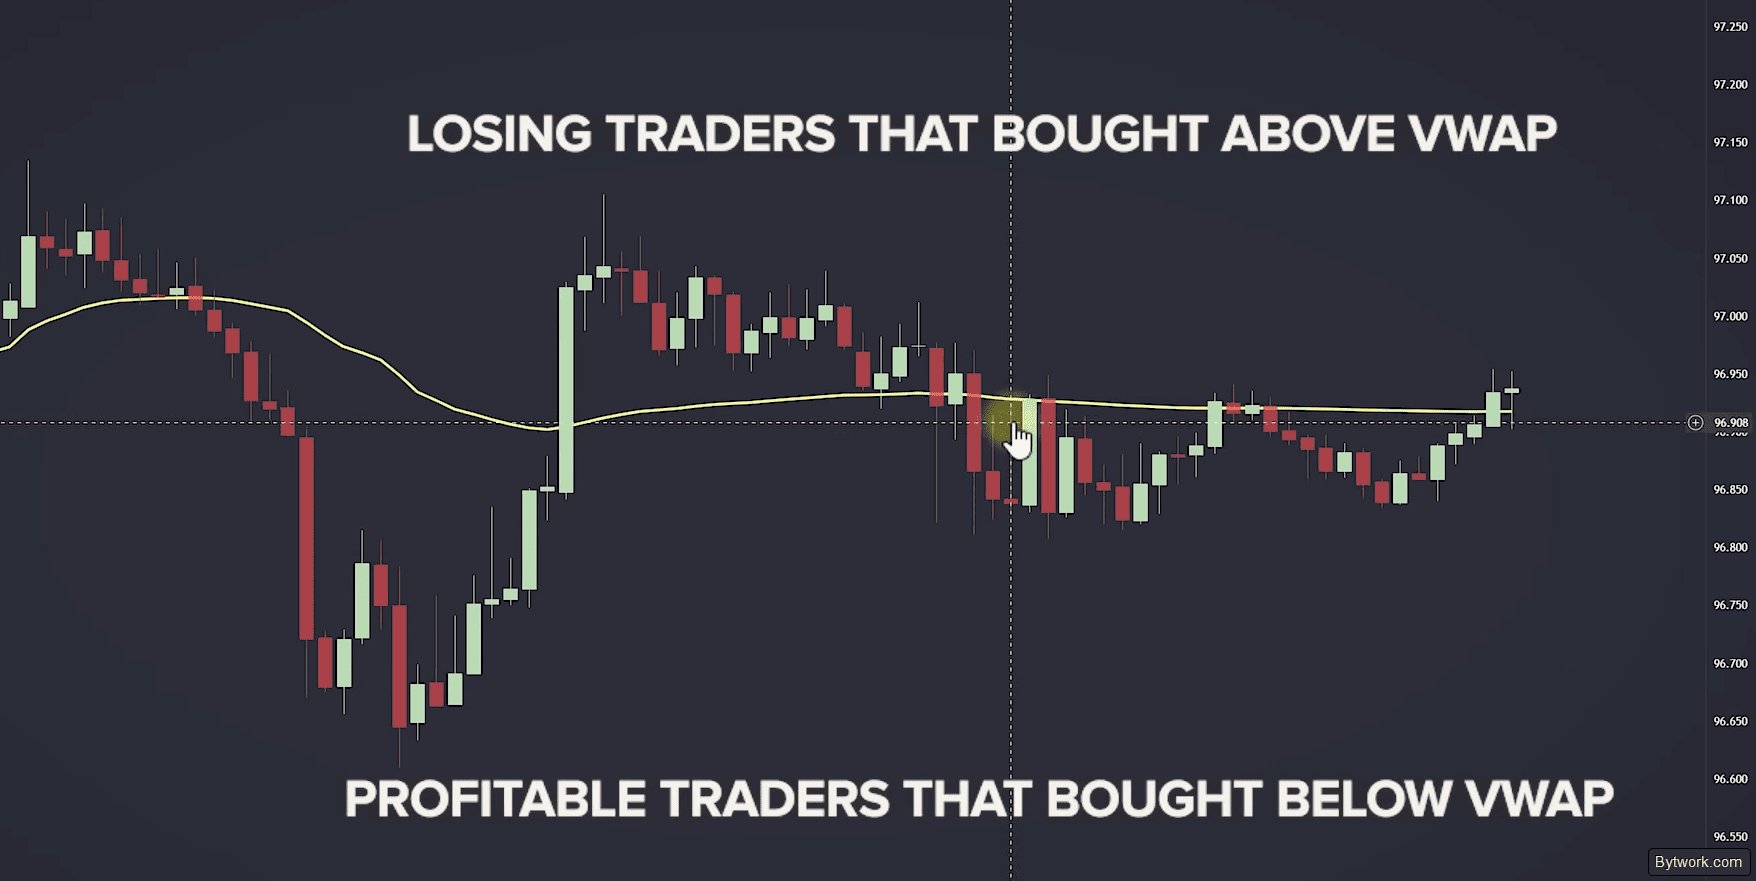
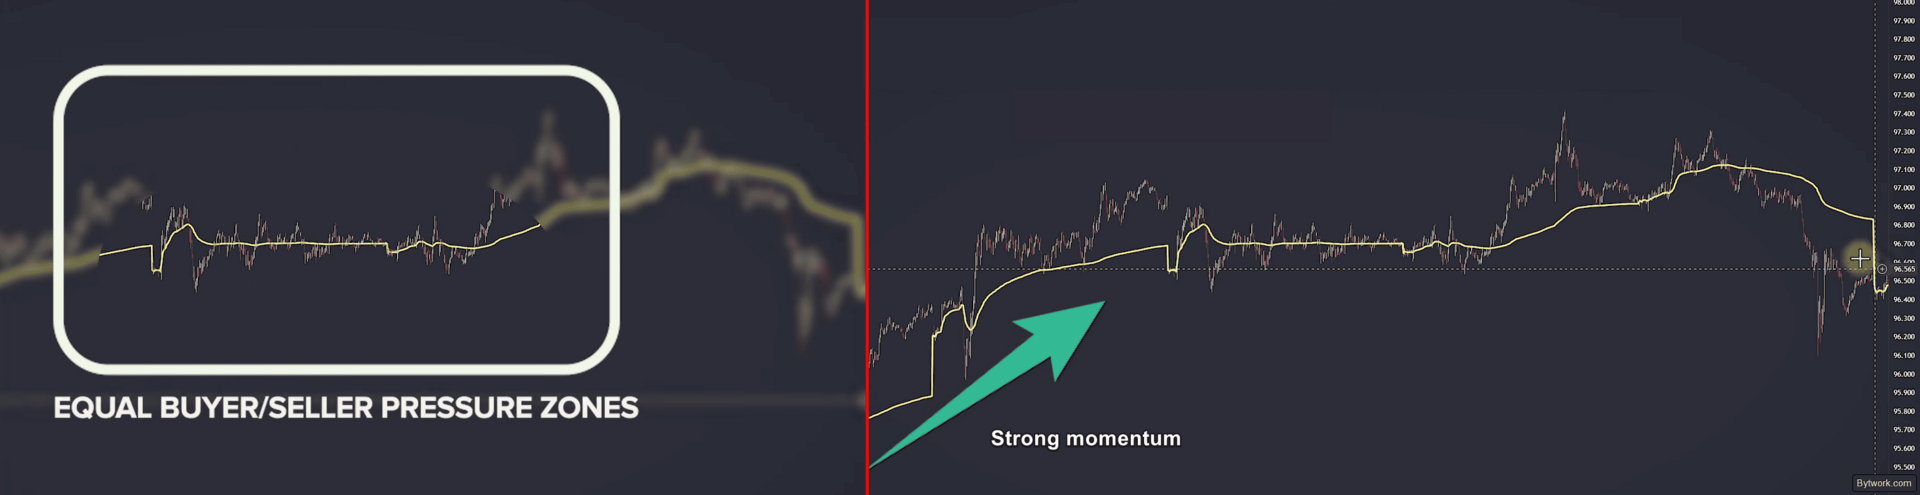
At the same time, the slope of the line reflects the balance of power in the market – a gentle slope signals a range, while a steep slope indicates a strong impulse from market makers.
Syncing chart periods helps uncover the intentions of smart money for strong moves. A prime example is a bullish stack, where daily VWAP is above weekly, weekly above monthly, and price firmly holds above all 3 levels.
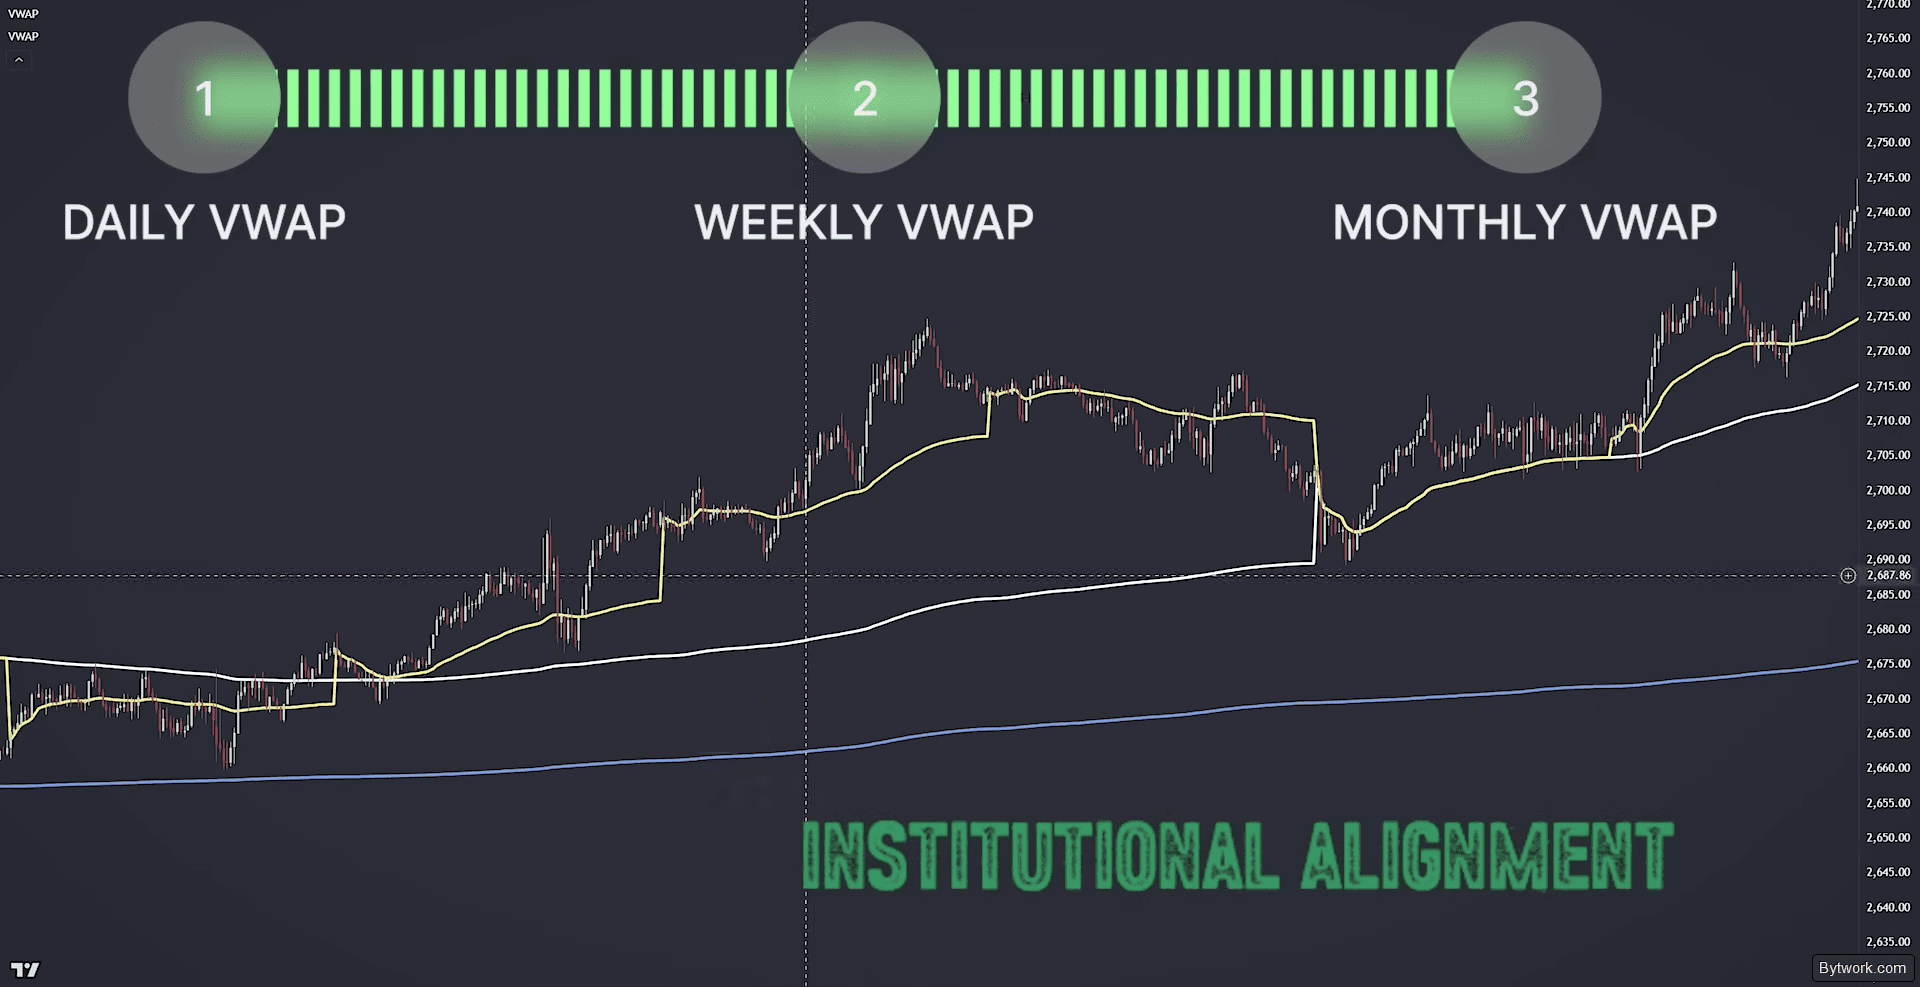
This is institutional consensus. The reverse structure signals a downtrend.

Moves in the consensus phase typically travel 3 times farther than standard impulses because algorithms across all periods activate simultaneously.
Event Anchors for VWAP
Whales often anchor VWAP to earnings reports, FOMC meetings, project presentations, or exchange listings. Such starting points reflect the positioning of large players around major news and create the strongest zones.

For example, after news of a major fraud investigation on huge volume, VWAP anchored to that candle becomes a key support for longs for several weeks.
To choose the right starting point, you need to select fundamentally important events with massive volume and strong price impulse.

For instance, news about large ETF purchases or sales would be significant.
Standard Deviation Bands and Patterns
Advanced analysis also includes standard deviation bands around VWAP, which show probabilistic boundaries in real time. Most traders miss this.
The +1 and –1 bands contain about 68% of price movements – this is a normal trading range.
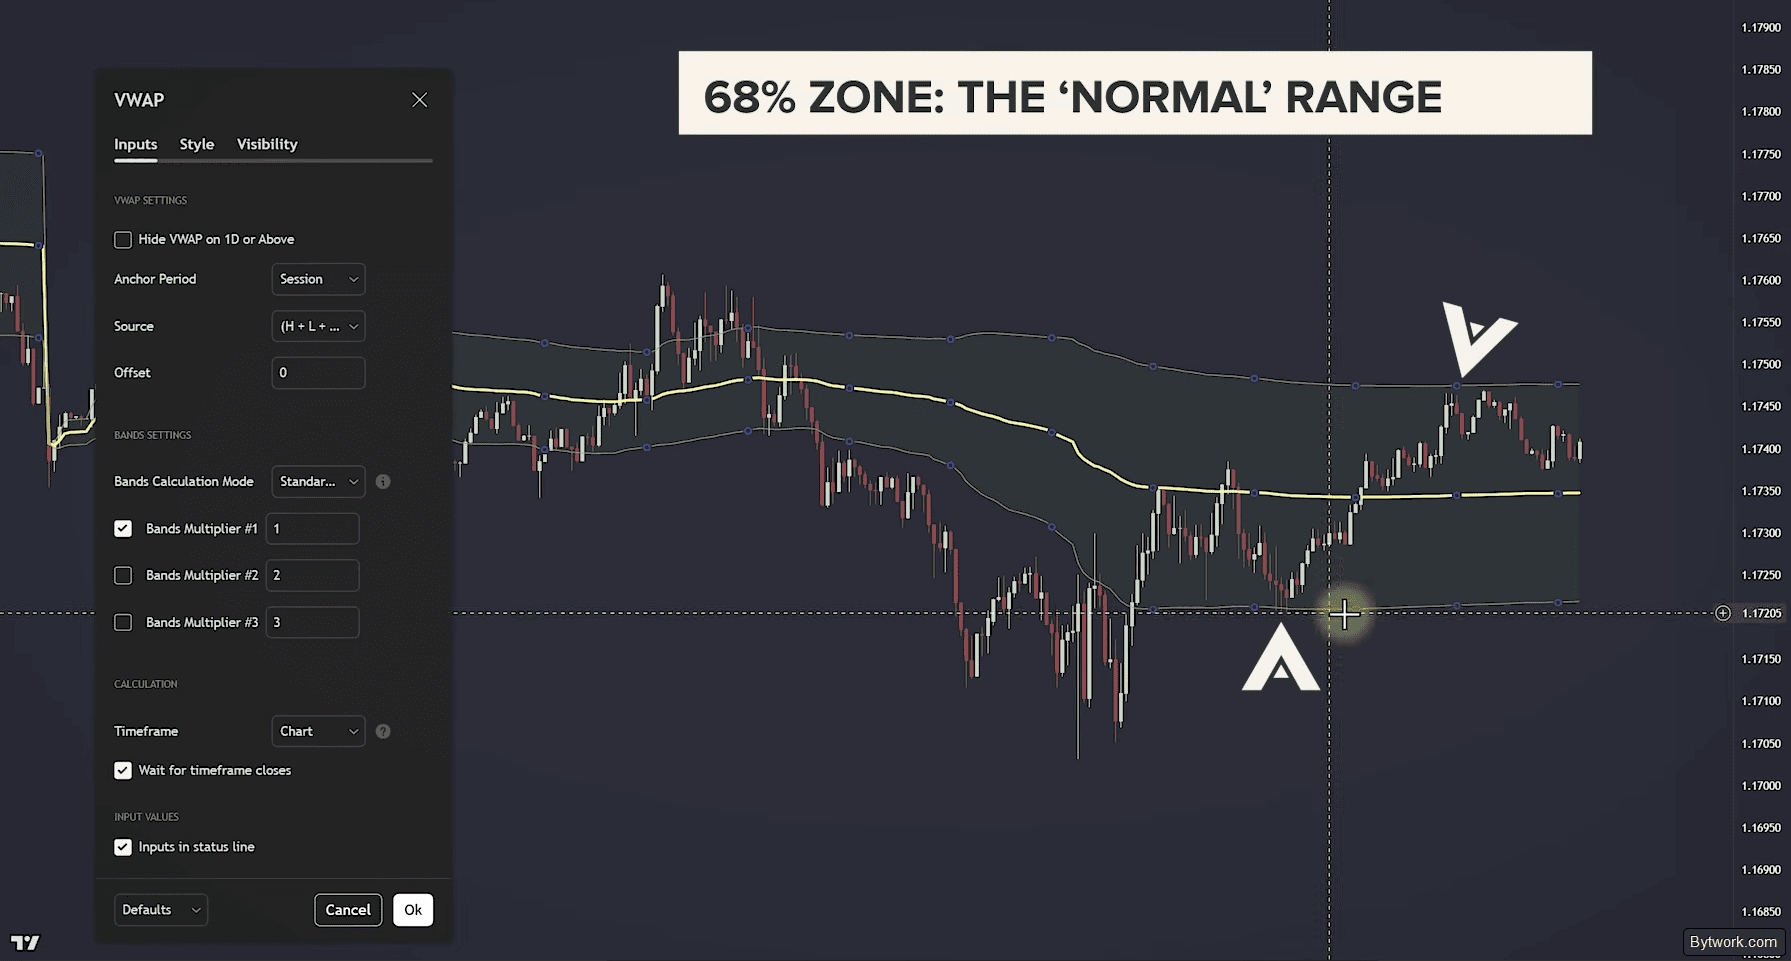
The +2 and –2 bands cover 95% and give strong mean‑reversion signals on touch.

The +3 and –3 bands are extreme. They cover more than 99.7% of all data, and the probability of price breaking out of these limits is only 0.3%.
The bands signal either a true breakout or a sharp reversal. When price approaches the extreme bands of VWAP, we apply RSI.
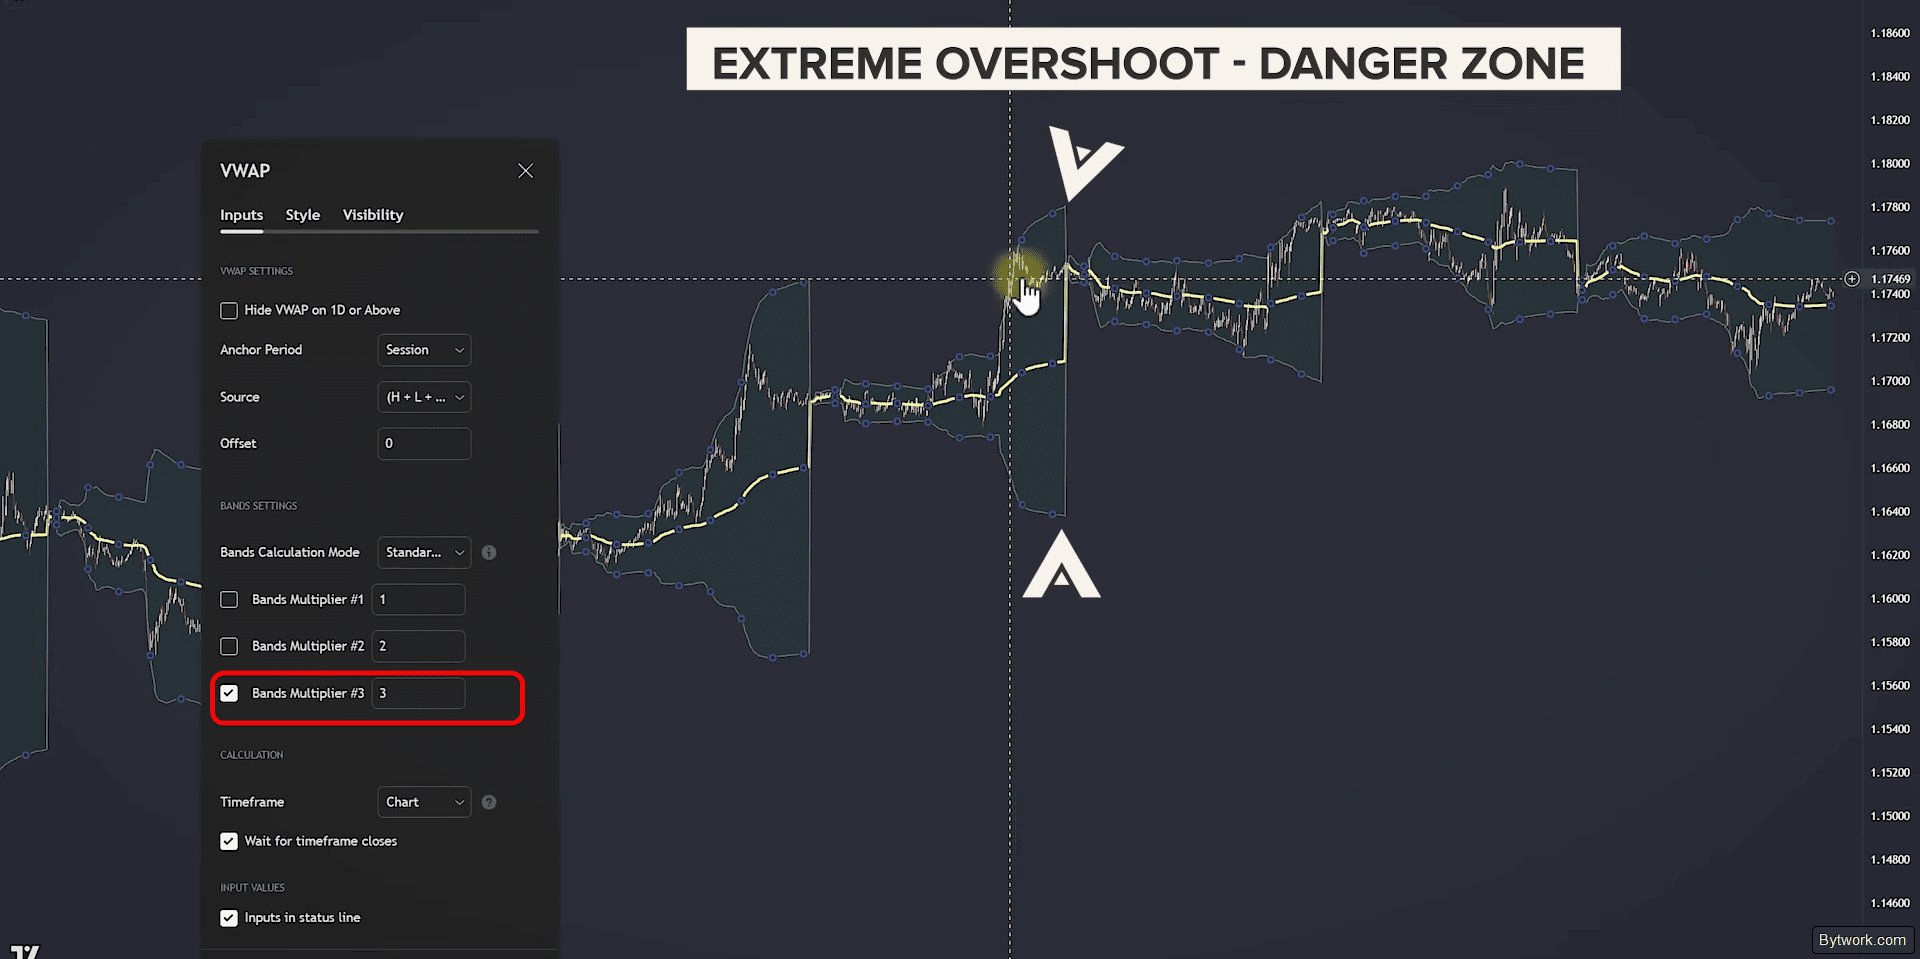
When the bands contract, volatility narrows, which almost always precedes explosive moves, and the strength of the contraction determines the scale of the subsequent expansion. This is clearly seen below:
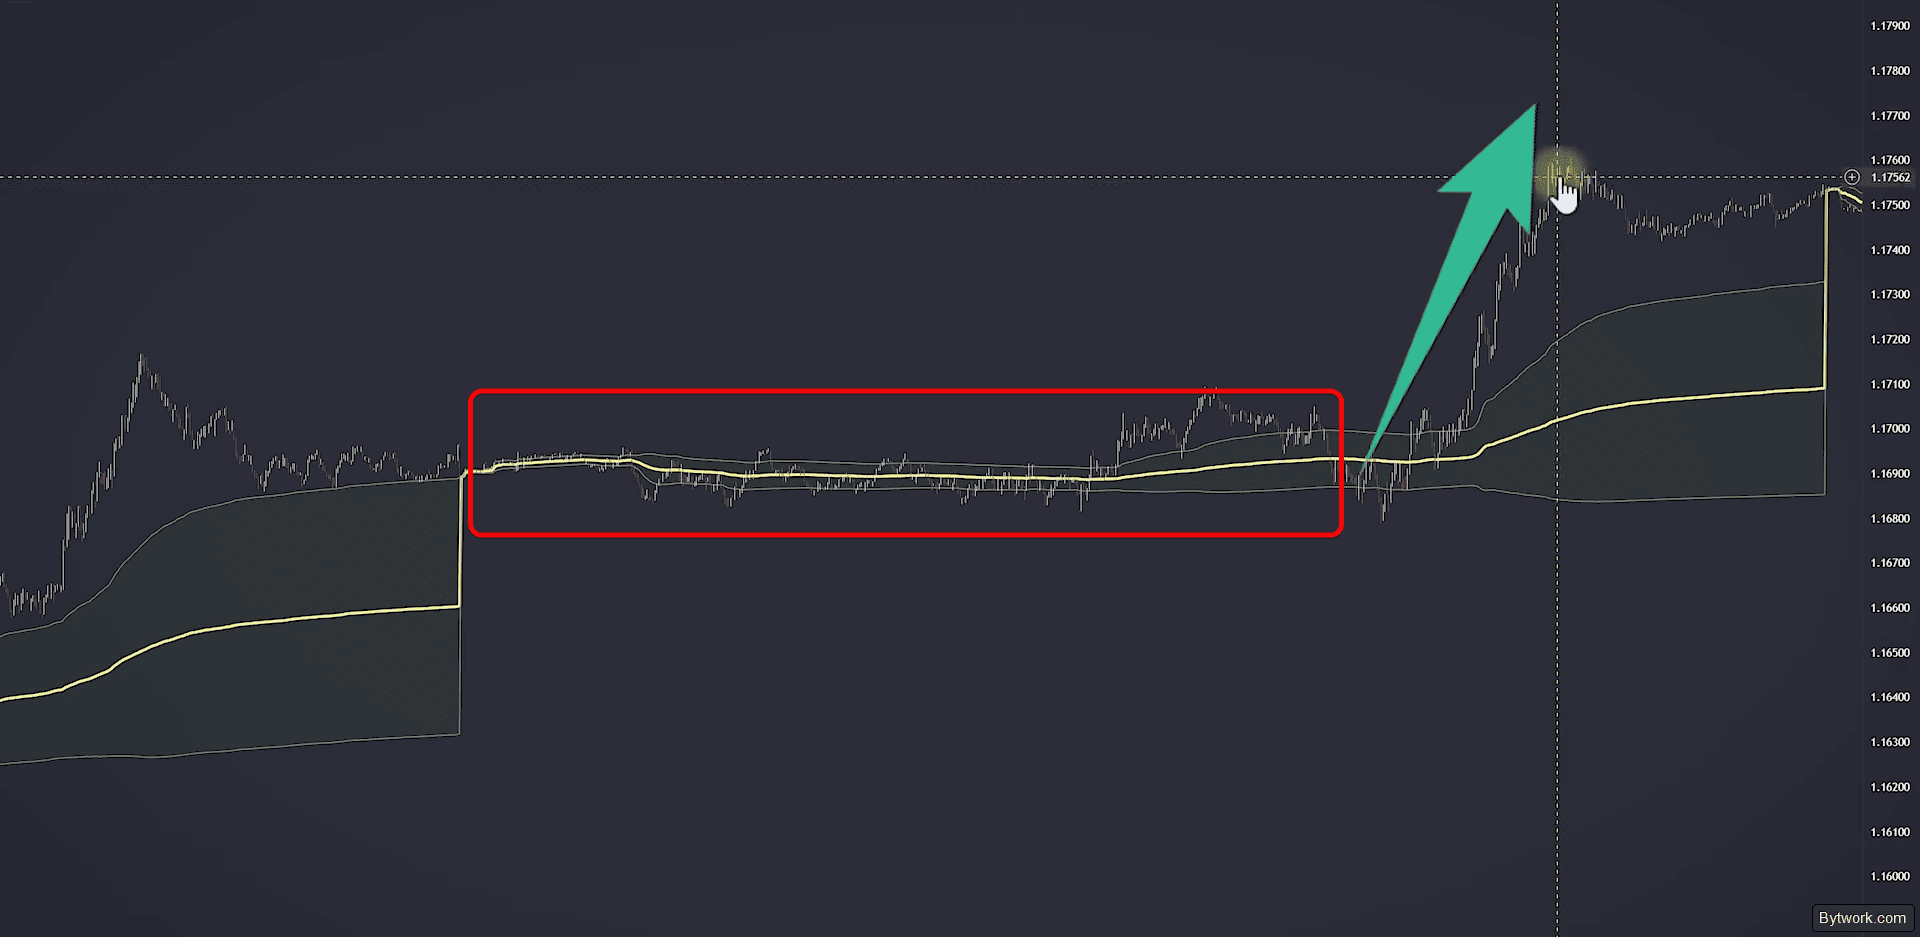
Moreover, in strong trends, price does not return to VWAP but “walks” along the 1st or 2nd band. This is called a “band walk”, where the band acts as dynamic support in an uptrend or resistance in a downtrend.

If you try to counter‑trend “fade” (trade against the move) the band on a trend day, the probability of hitting a stop‑loss skyrockets to 70‑80%.
If price quickly returns to VWAP after touching the band, trade the mean reversion. If it walks along the band, trade the trend continuation.
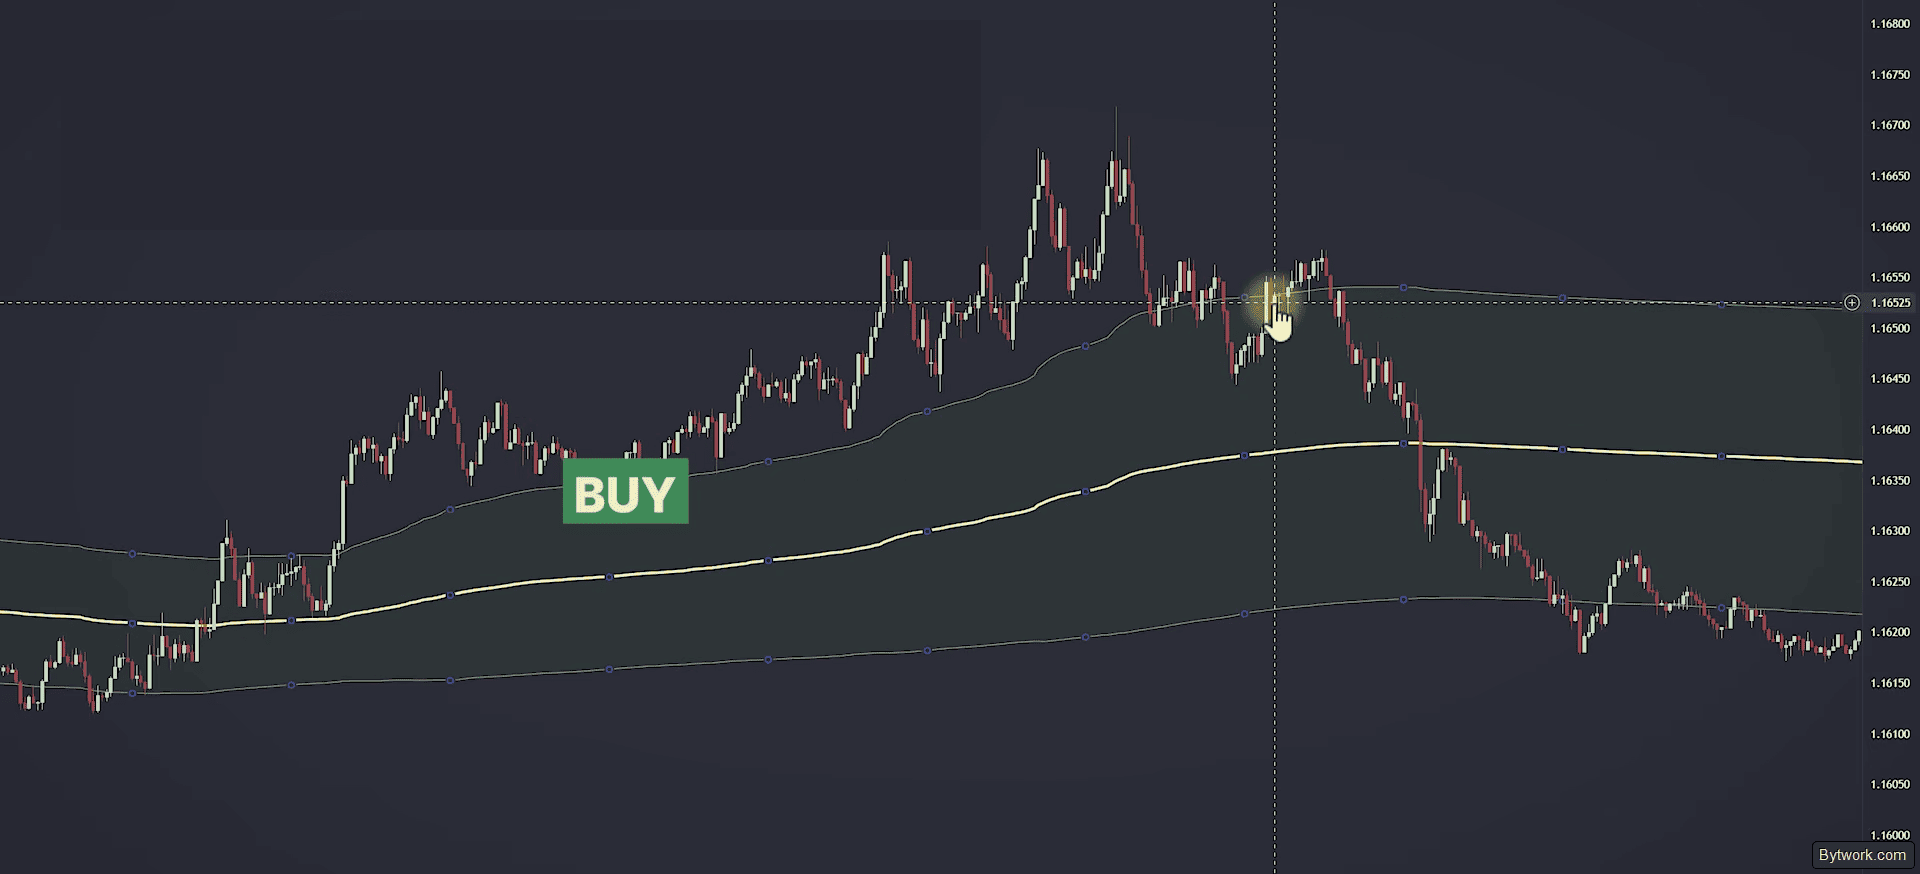
- In classic (day trading) we use multipliers of
1.0,2.0and3.0standard deviations. - In aggressive trading (scalping on 1‑5 min) we use narrower bands of
0.5,1.0and1.5to catch more entry points during micro‑fluctuations.
Reading Candles and Volume at VWAP
A bounce off VWAP does not guarantee the asset will rise. Entering a long immediately on touch often leads to stops being triggered.
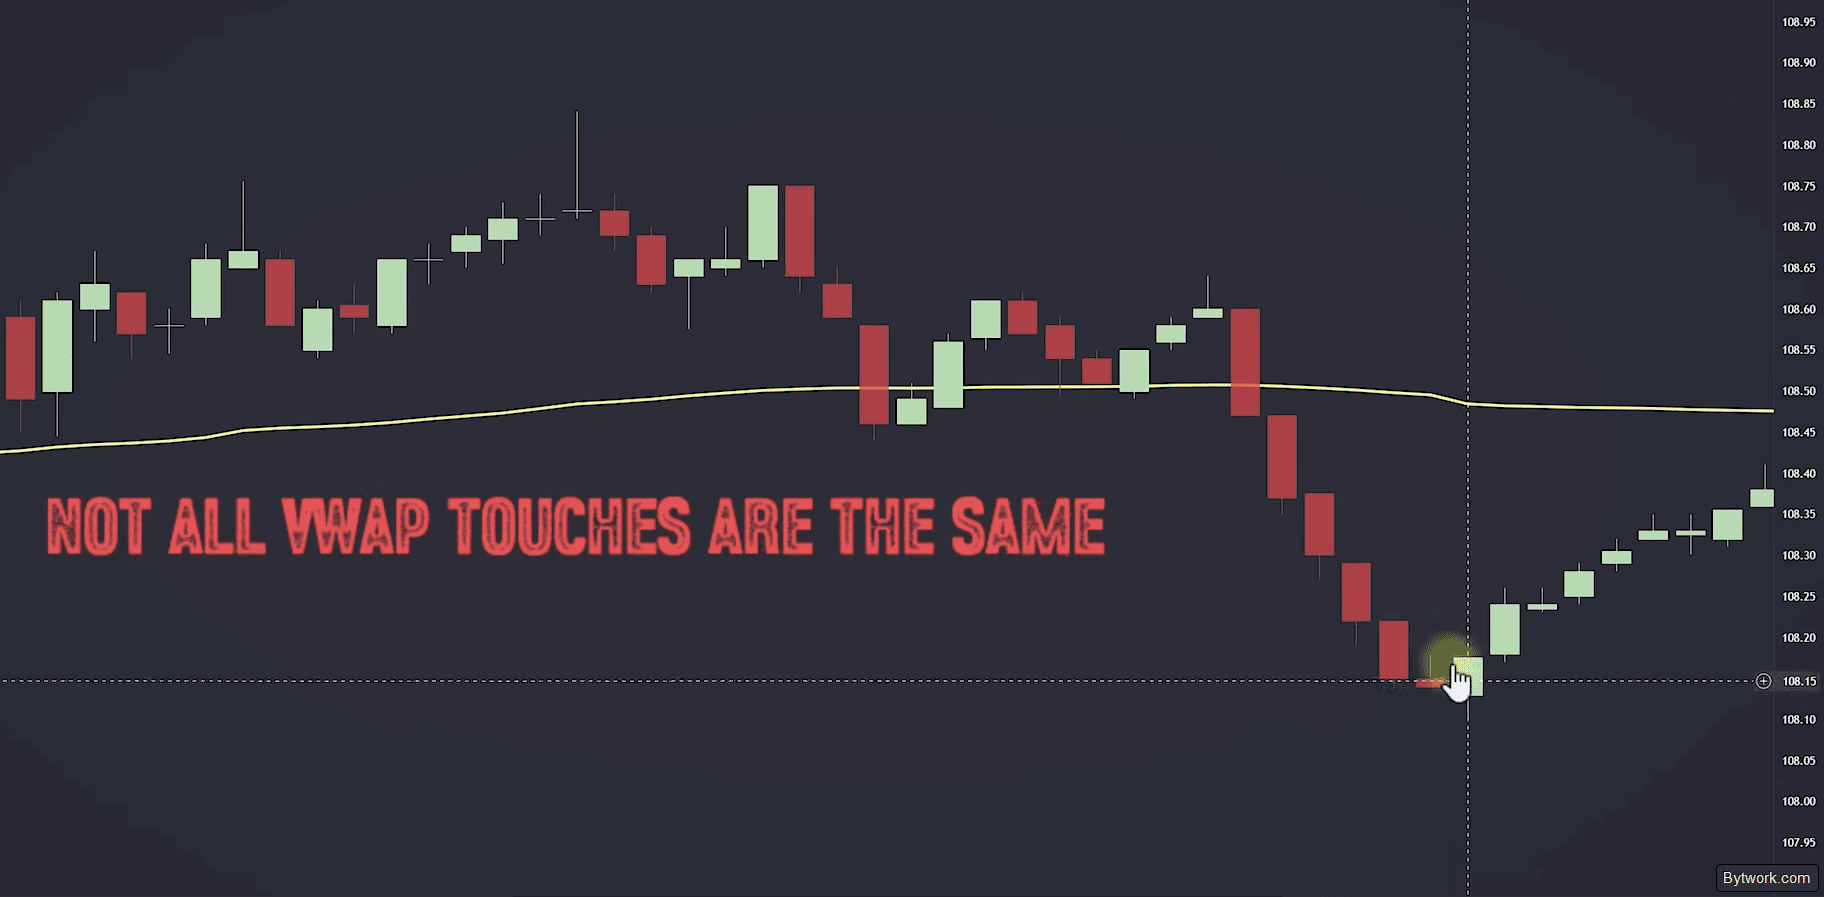
Every interaction is unique and requires skill in reading candlestick patterns. We have observed that:
- A long wick with rejection means the level is defended by large capital.
- A weak doji signals market indecision.
- A strong close above VWAP on high volume indicates a short squeeze.
- Volume confirms accumulation or distribution by market makers.

High volume at the line means active whale participation – they are either accumulating or distributing.
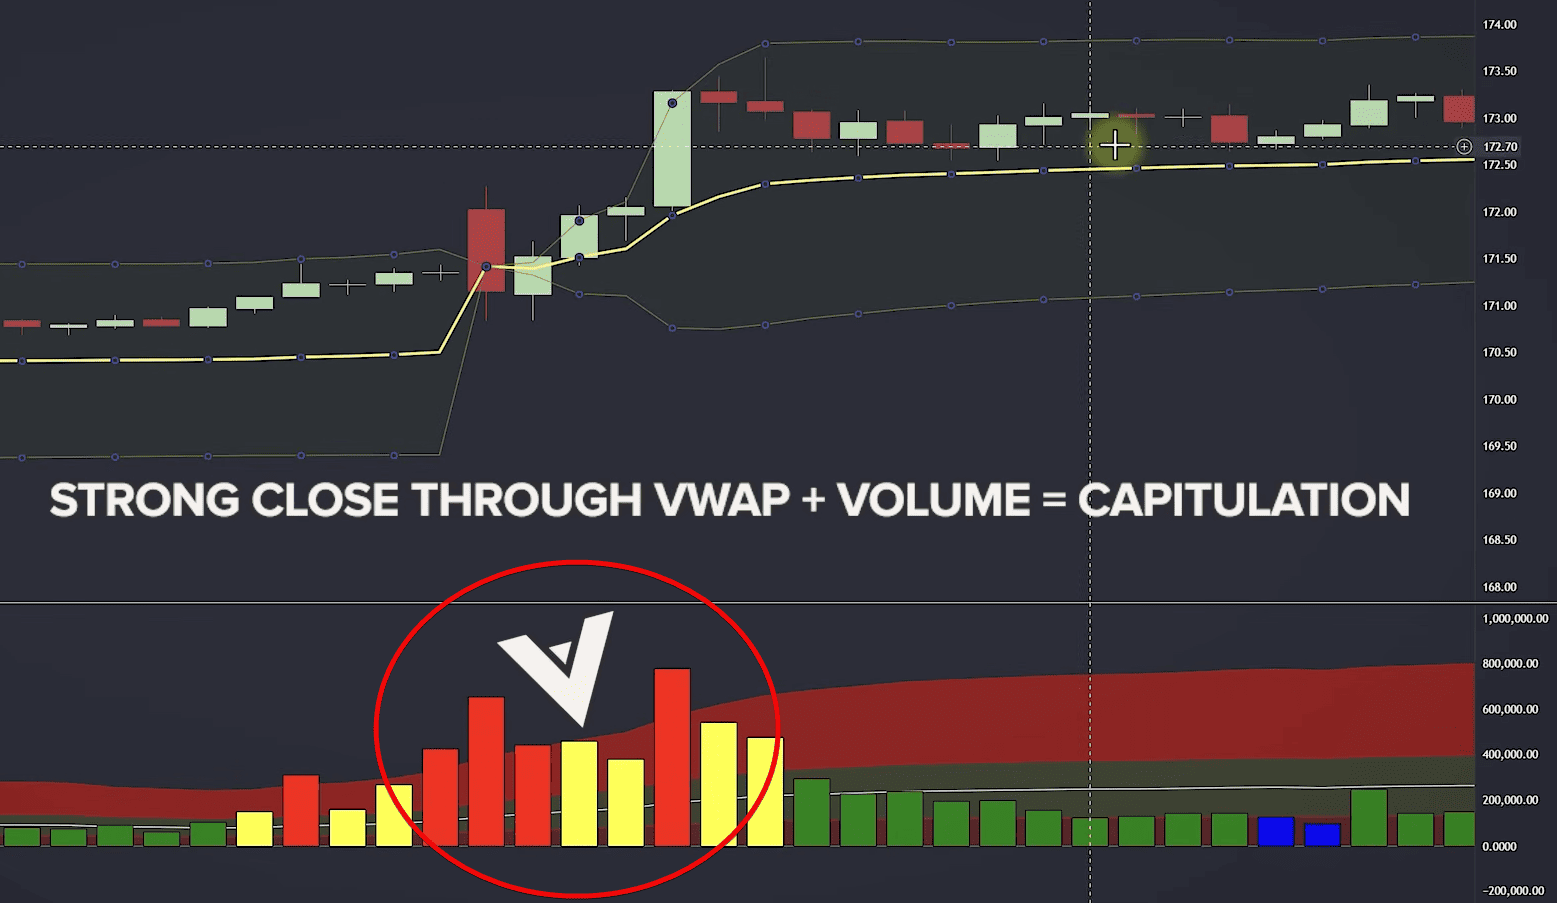
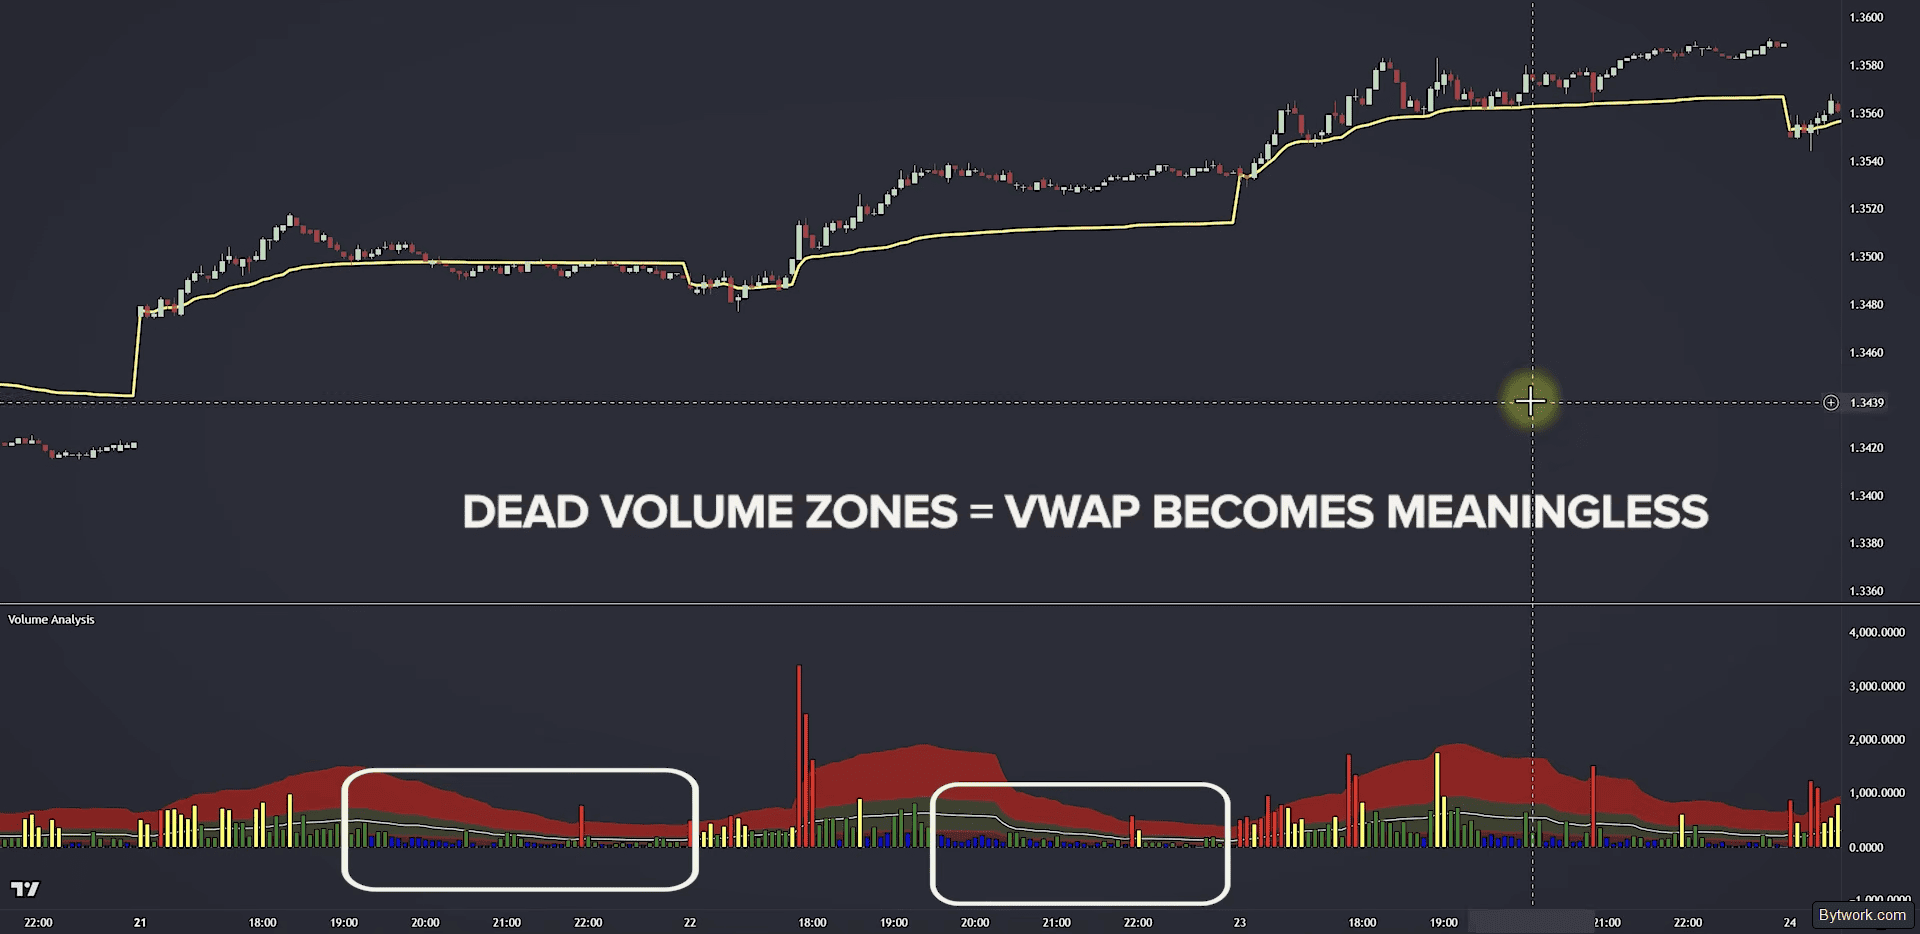
If trading volume drops below 30% of the average, the VWAP indicator becomes invalid!
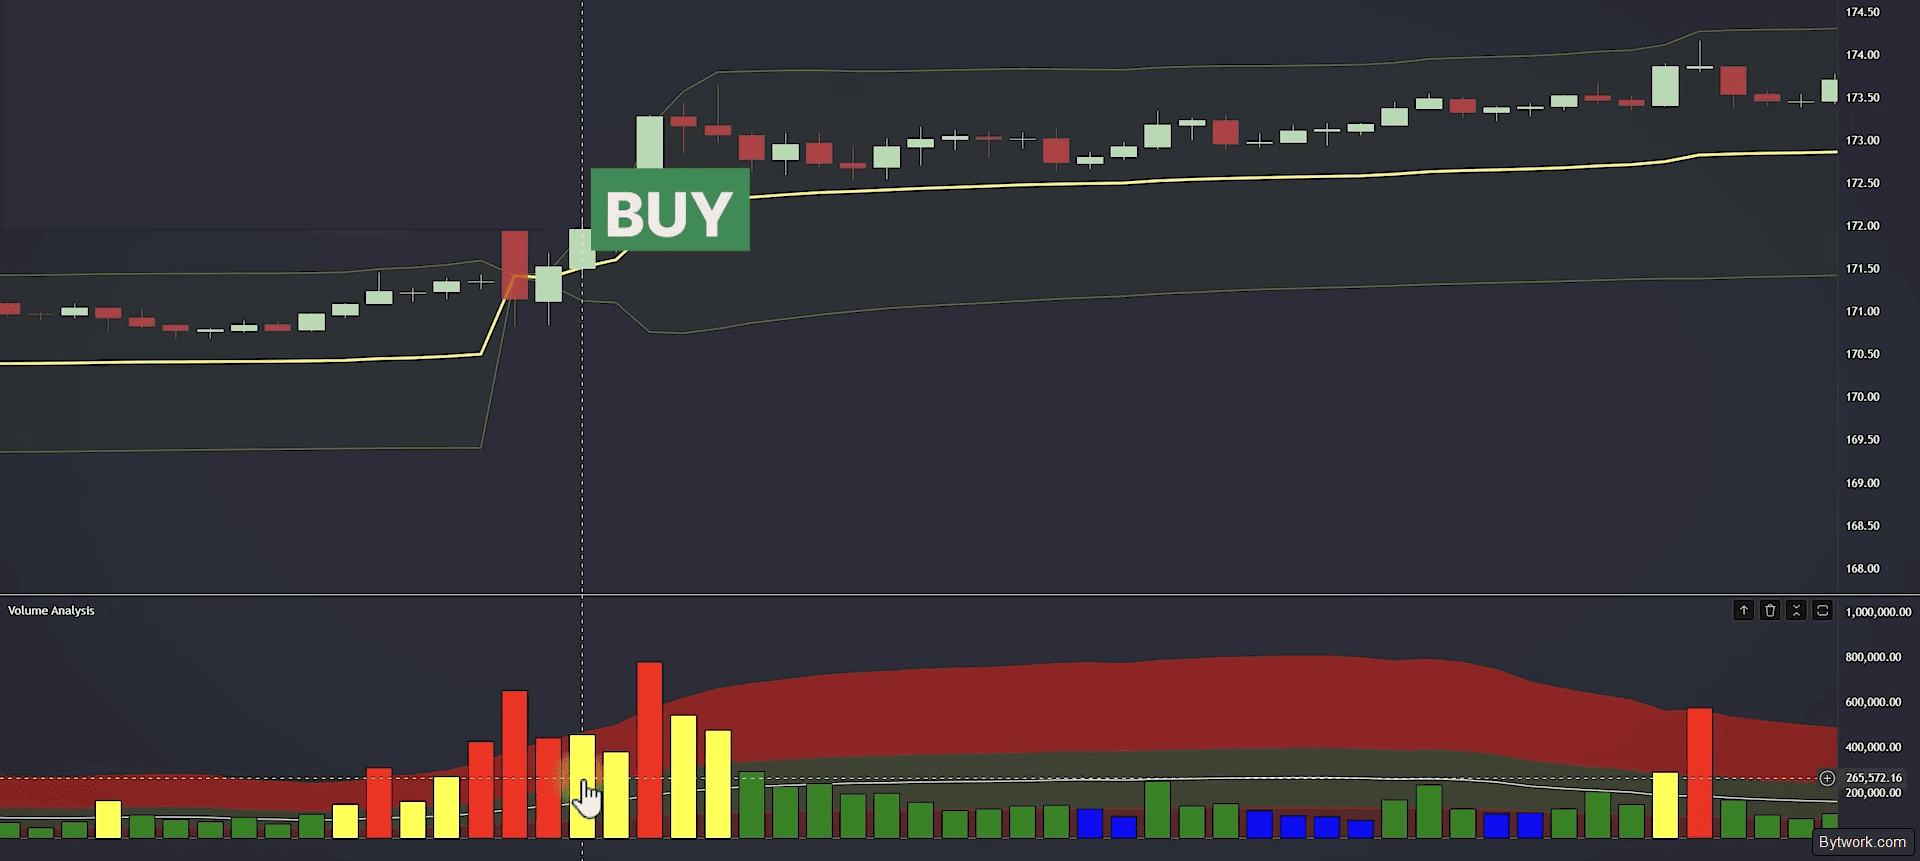
A buy trade is considered successful (alpha) if the average execution price is below the current VWAP (discount).
The False Breakout Trap and Time Filter
There is a classic false breakout trap. Price moves below VWAP for several candles, triggering stop‑losses, then instantly returns above. This is not random noise – it is a deliberate move by whales to collect liquidity before the real move.
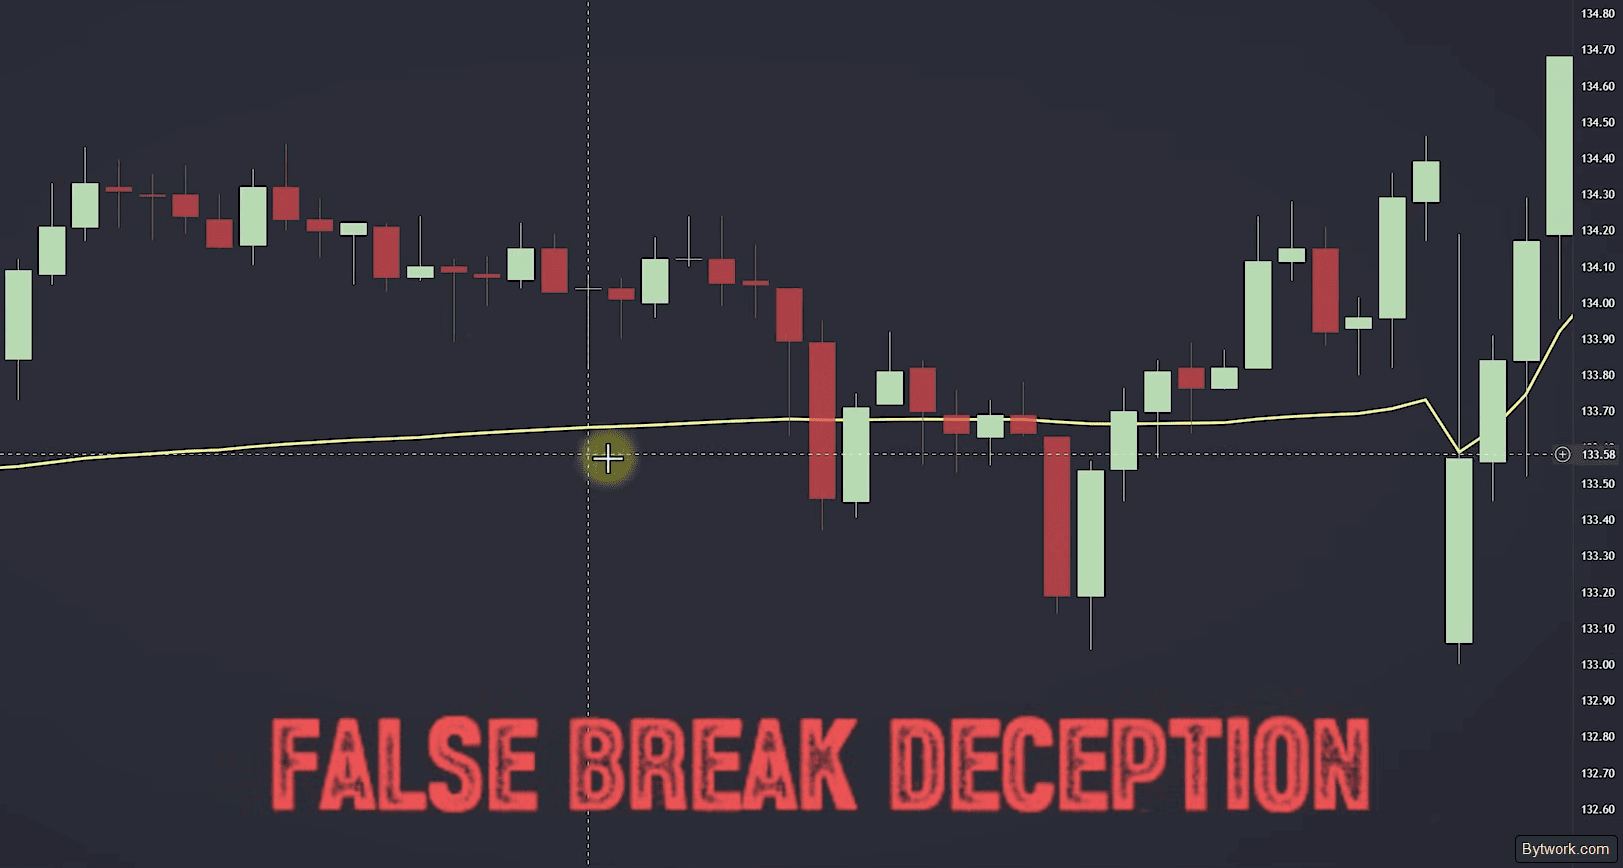
To avoid this trap, distinguish between acceptance and rejection of the level by time.
- If price breaks VWAP and stays below for more than 3 candles, the level is considered accepted.
- If it returns immediately – it is rejection.

Apply these rules and they will cut out up to 80% of false signals.
Adapting VWAP to Market Conditions
A common myth is that VWAP works identically under all market conditions. This is completely false! We see that VWAP behaviour differs radically in trending, ranging, and volatile markets.

- In a trend, VWAP acts as a sloped dynamic support or resistance for price bounces.
- In a range, VWAP serves as a centre of gravity with price oscillating around the line – mean reversion trades.
- In a range, above VWAP you look for shorts, below – longs, aiming for a return to the line.
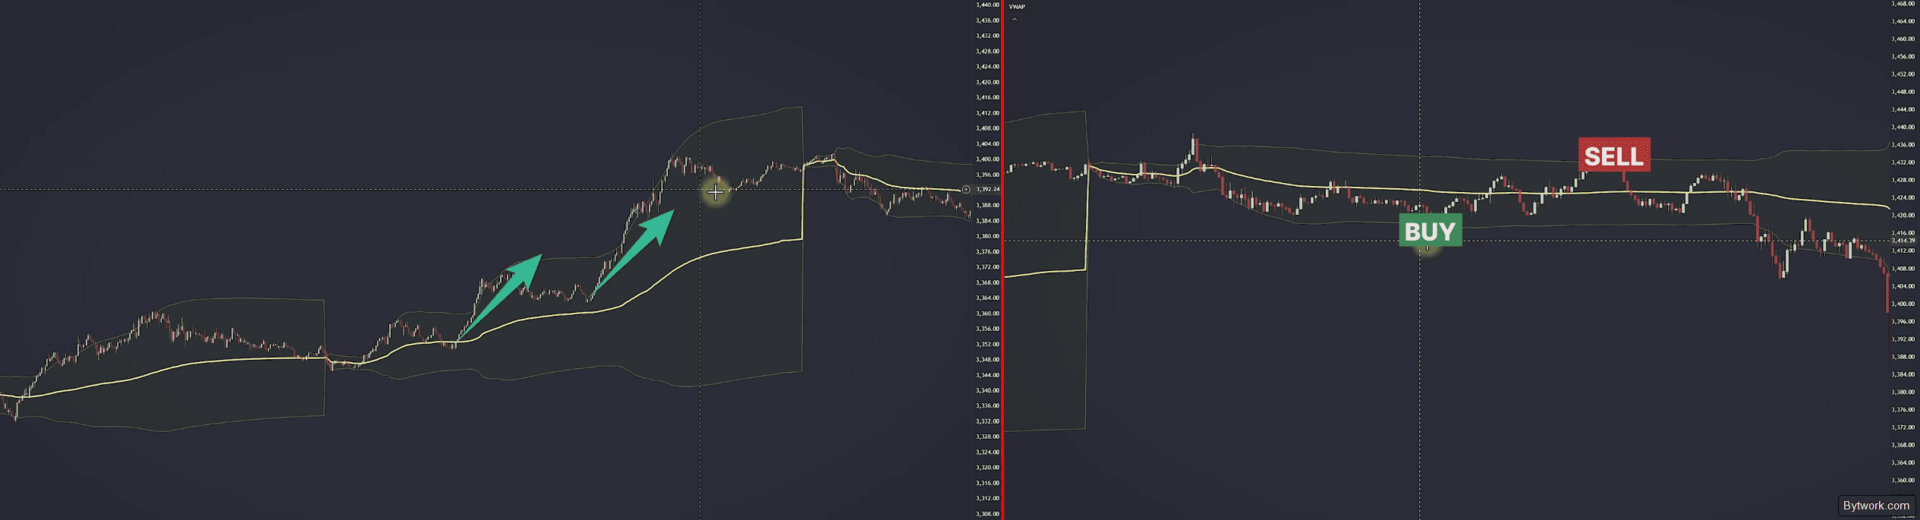
Smart money adapts their tactics to the current market state rather than fighting it.
Impact of Volatility, News, and Low Volume
Volatility directly affects the expansion of deviation bands and the viability of mean‑reversion strategies. In a range, the probability of price returning to VWAP after touching the 2nd band is 70‑80%. On a trending day, that chance drops to 20‑30% because price begins to walk the bands, using them as dynamic support.
In volatile markets, VWAP bands widen significantly and require flexible take‑profits and stops with different probability thresholds.
During low volume, without large capital, the indicator starts to give false signals, so it is better to change strategy or “sit on the fence”.
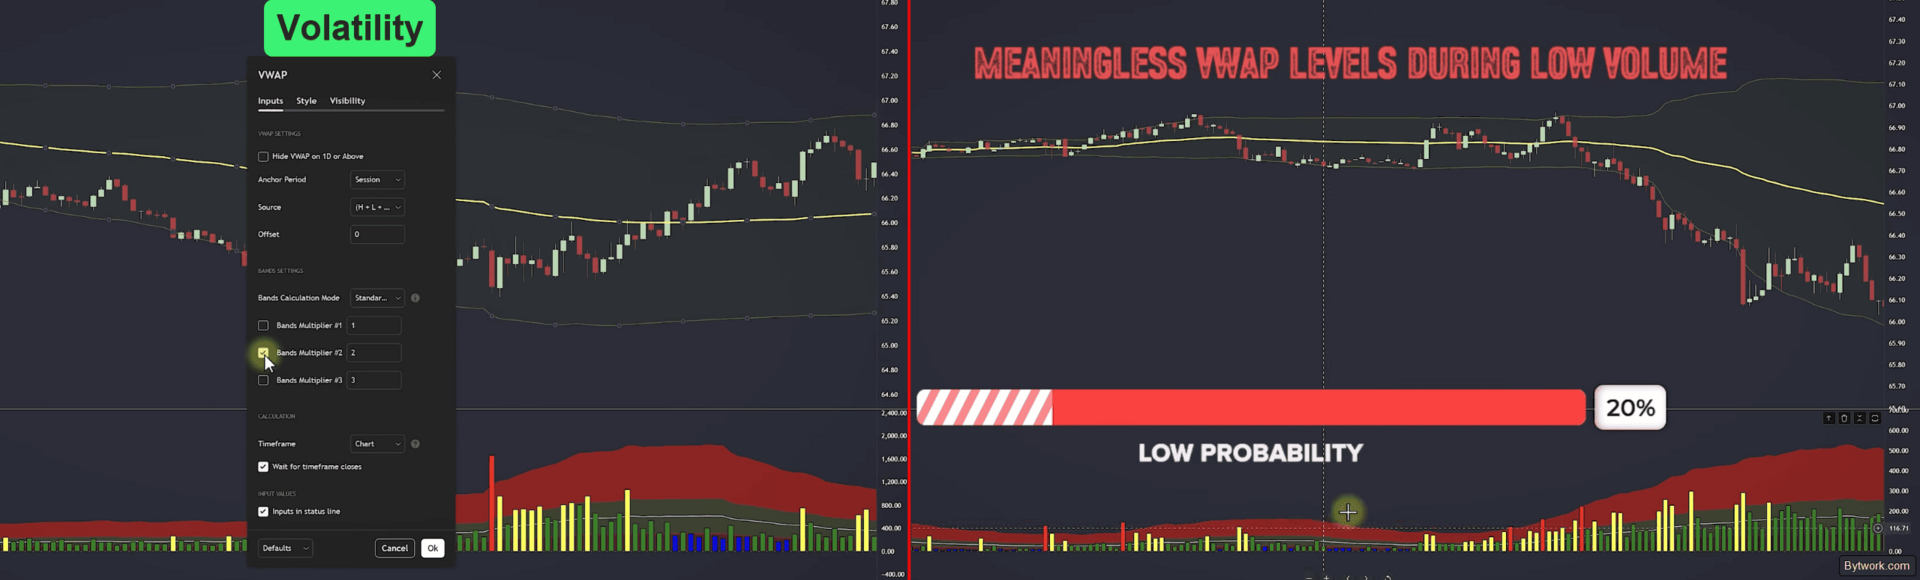
News events such as earnings reports, FOMC statements, and major macroeconomic data can completely reset VWAP dynamics, making the previous session level obsolete and forcing you to seek new anchor points.
It is dangerous to trade VWAP within 30 minutes before and 30 minutes after major news. The volatility spike renders lines and bands useless.
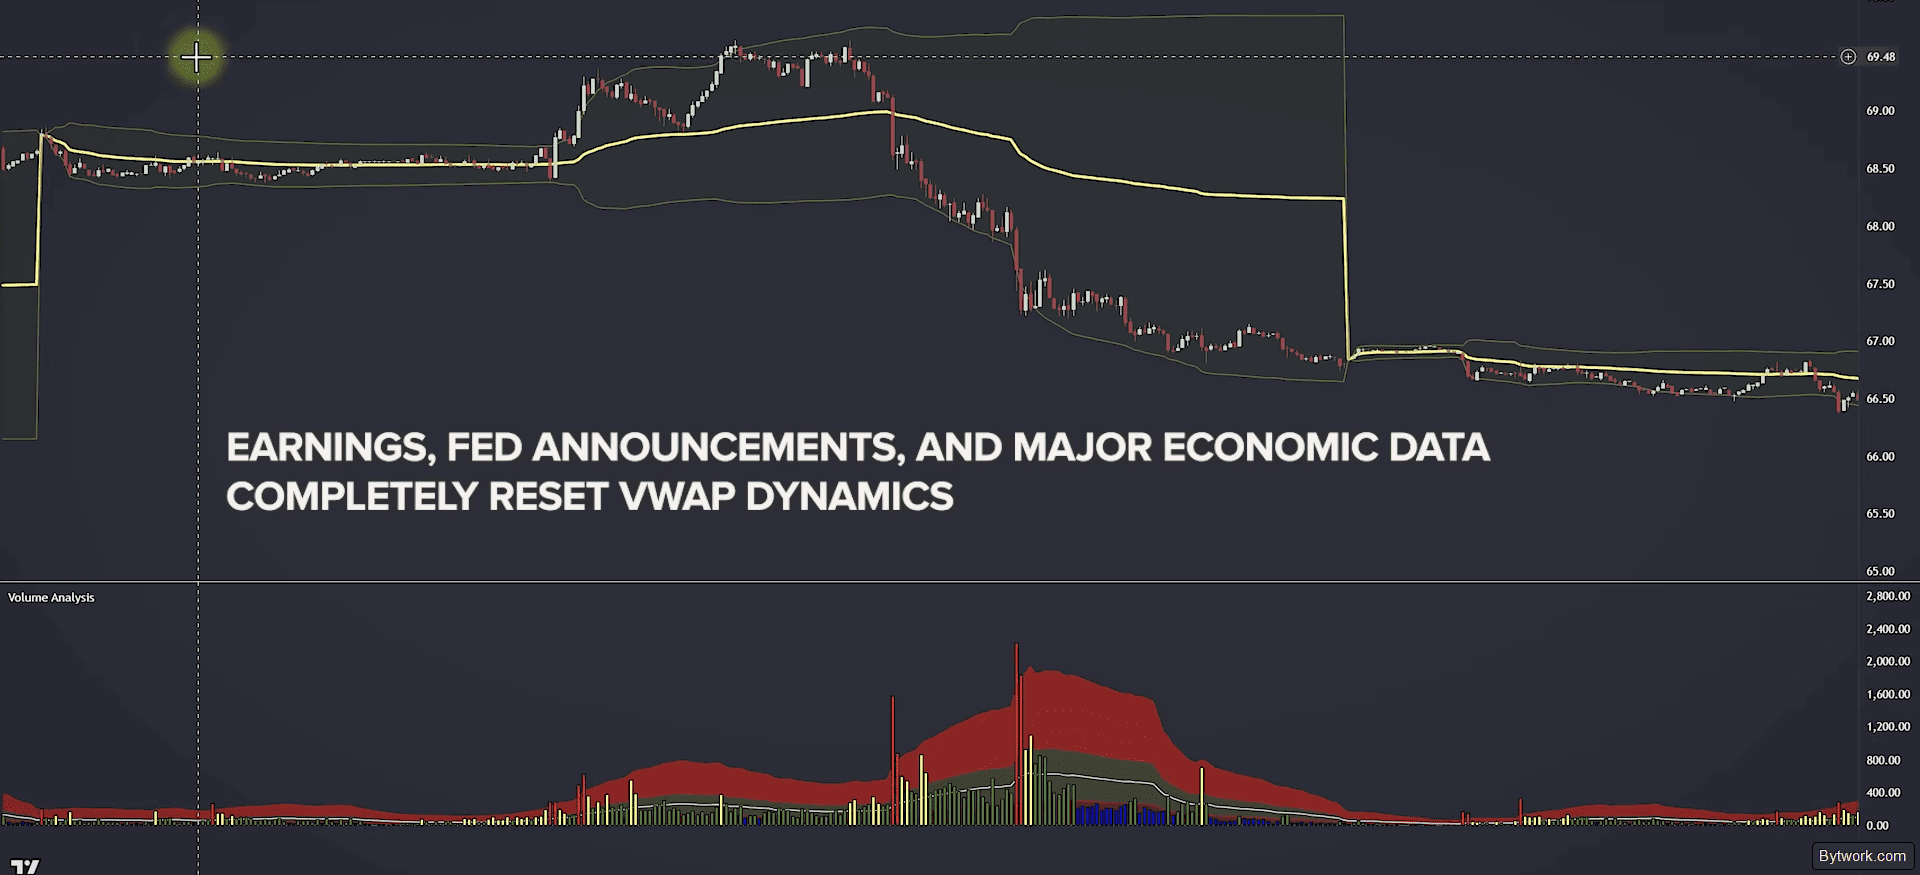
VWAP is an indicator, not a complete strategy, and its application must flexibly change according to market conditions.
Stop‑Losses and Targets with VWAP
To trade VWAP at a professional level, move from subjective decisions to a systematic approach.
Entry confirmations
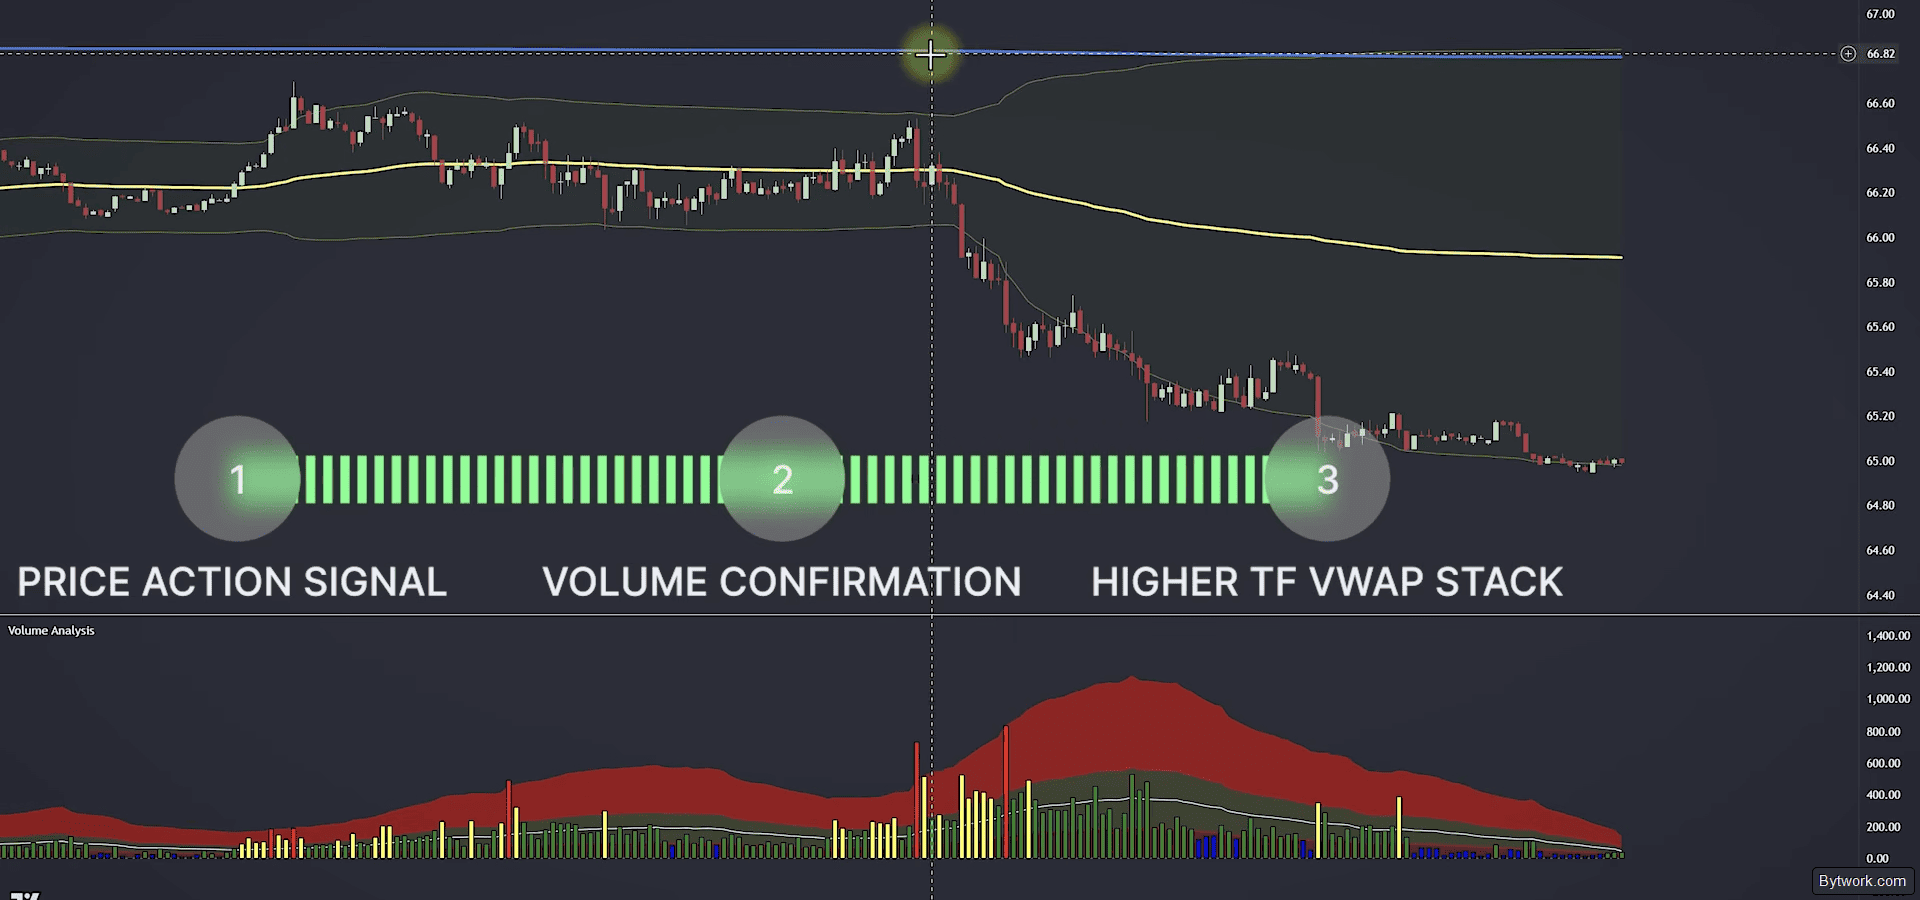
When entering a trade, require 3 confirmations:
- price signal at VWAP,
- volume confirmation of institutional activity,
- directional bias from the higher timeframe (VWAP stack).
Managing stop‑loss and targets
Determine your stop‑loss level using VWAP bands and volume profiles. Place the stop at the next significant band or volume node, exiting only when institutional conviction changes.
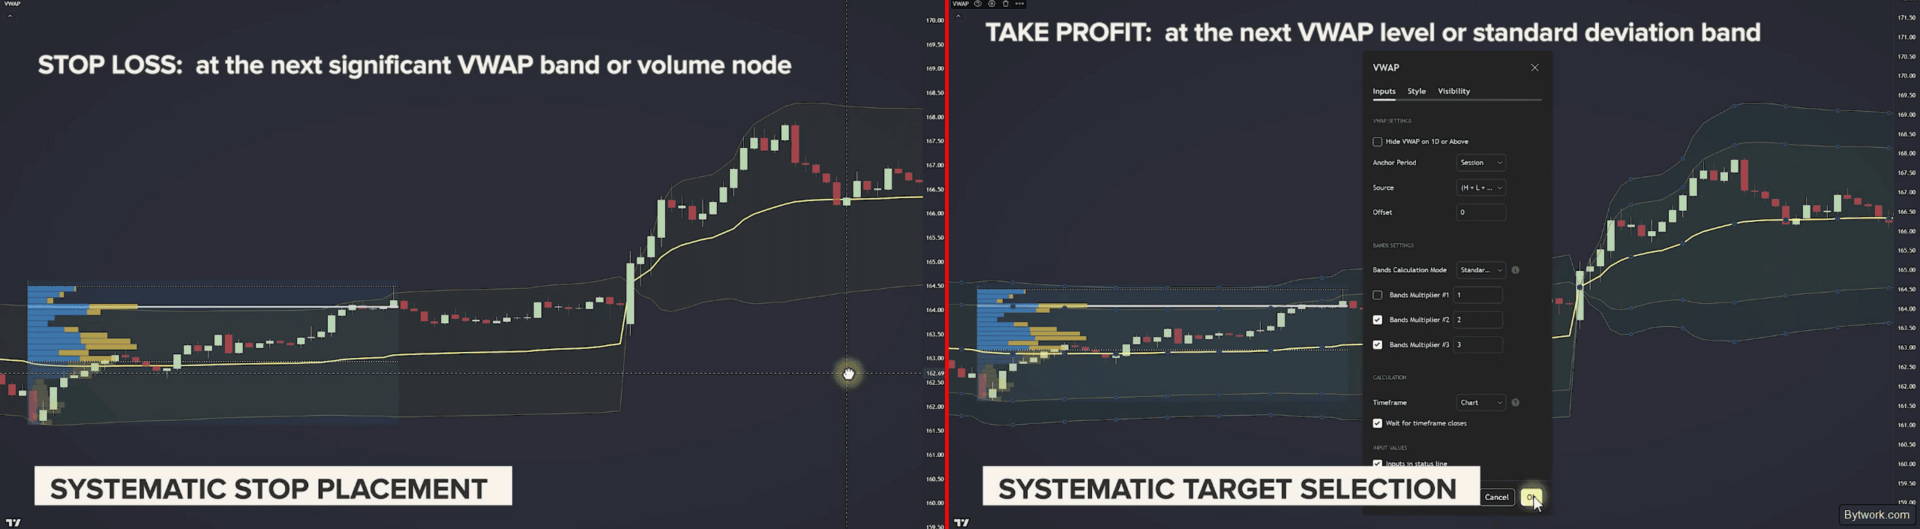
Targets are also chosen using VWAP logic. The first target is at the next VWAP level or standard deviation band; the second at the next volume node.
Exit signals
Exit signals are as important as entry signals. When the VWAP slope changes, volume drops, or bands contract – this indicates a shift in institutional activity, and it is time to reassess the position.
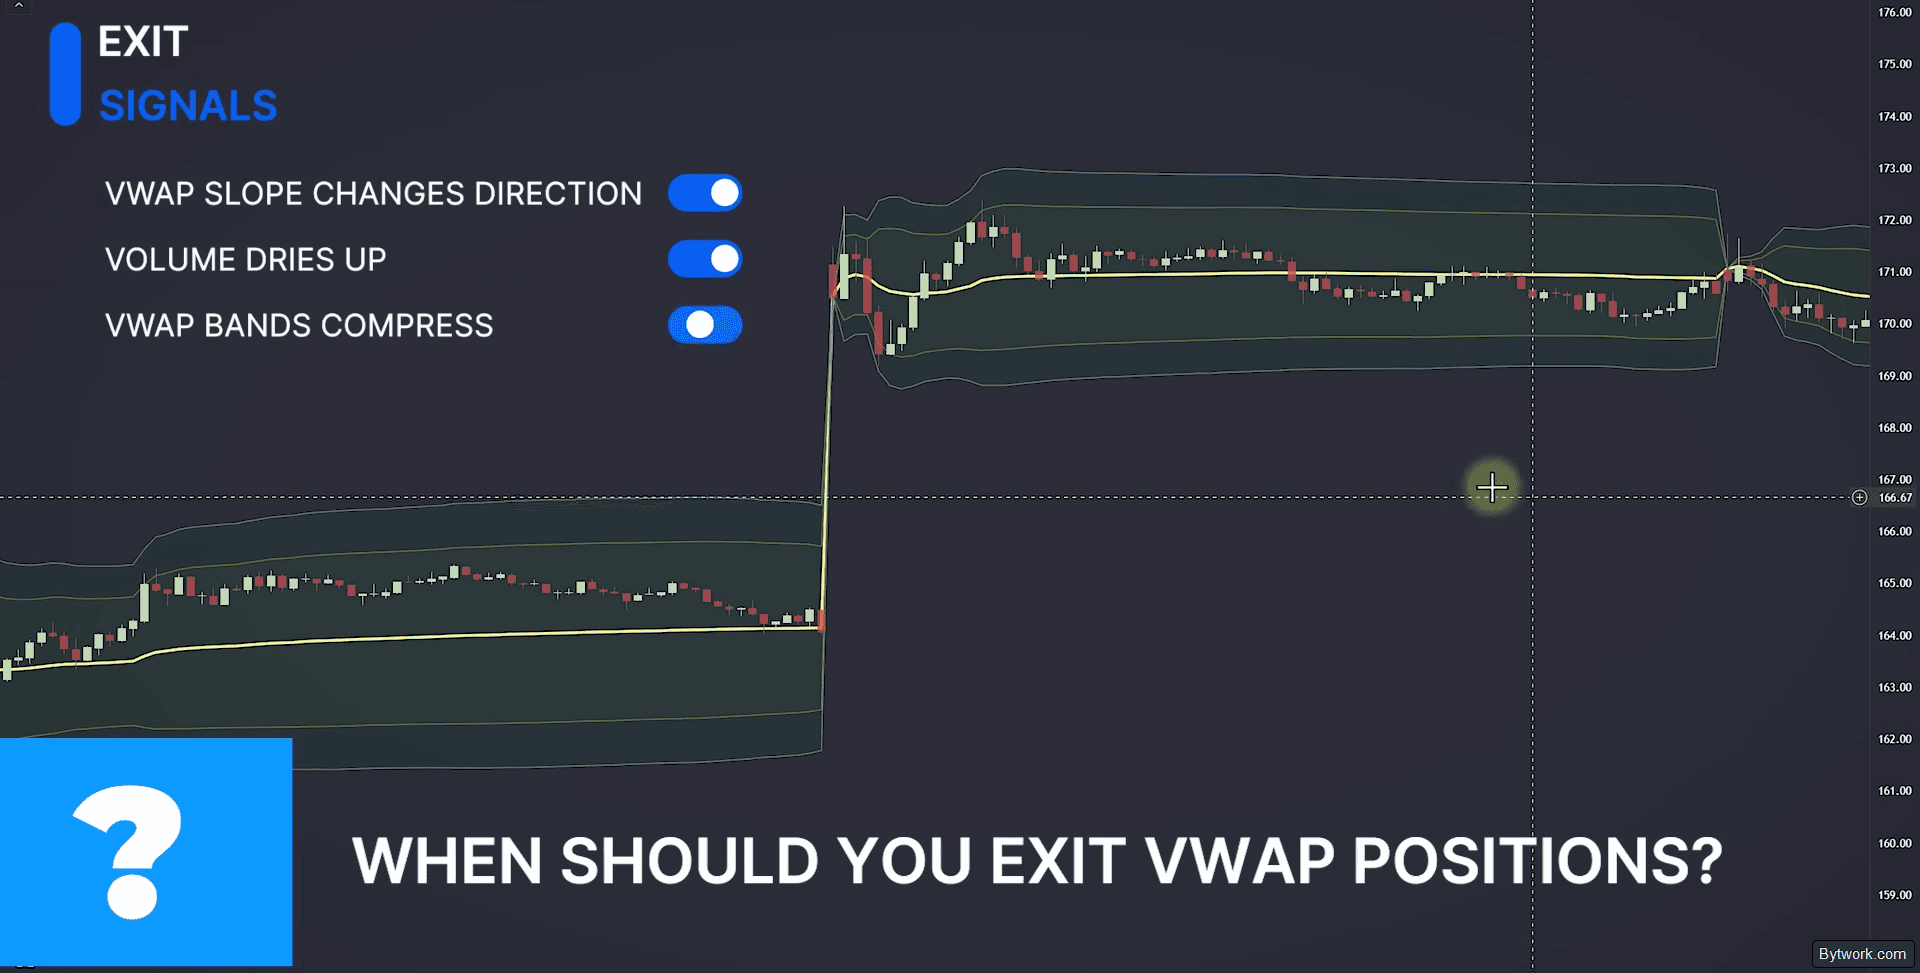
Every decision is purely based on VWAP structure, completely eliminating emotions and guesswork.
- When VWAP flattens or reverses, institutional flow is drying up – adjust your position.
- When volume drops 30% below average, large players stop defending levels – risk of false breakouts increases.
- If the target is not reached within 60 minutes, close the position at market price – systematically prevent capital stagnation in a range.
Timeframe Hierarchy and Position Management
All decisions follow a strict period hierarchy that defines the market regime and removes emotions.
- Yearly VWAP sets the global market regime. In a bull trend, price holds above it for months; in a bear trend, it becomes insurmountable resistance.

- Quarterly VWAP – pure gold. It manages market makers’ positions during earnings seasons, as institutional funds evaluate performance on a quarterly basis.
- Monthly VWAP serves as the primary filter for the current trend. With price above the line, any pullback is used for buying; with price below, any rally is considered for selling.
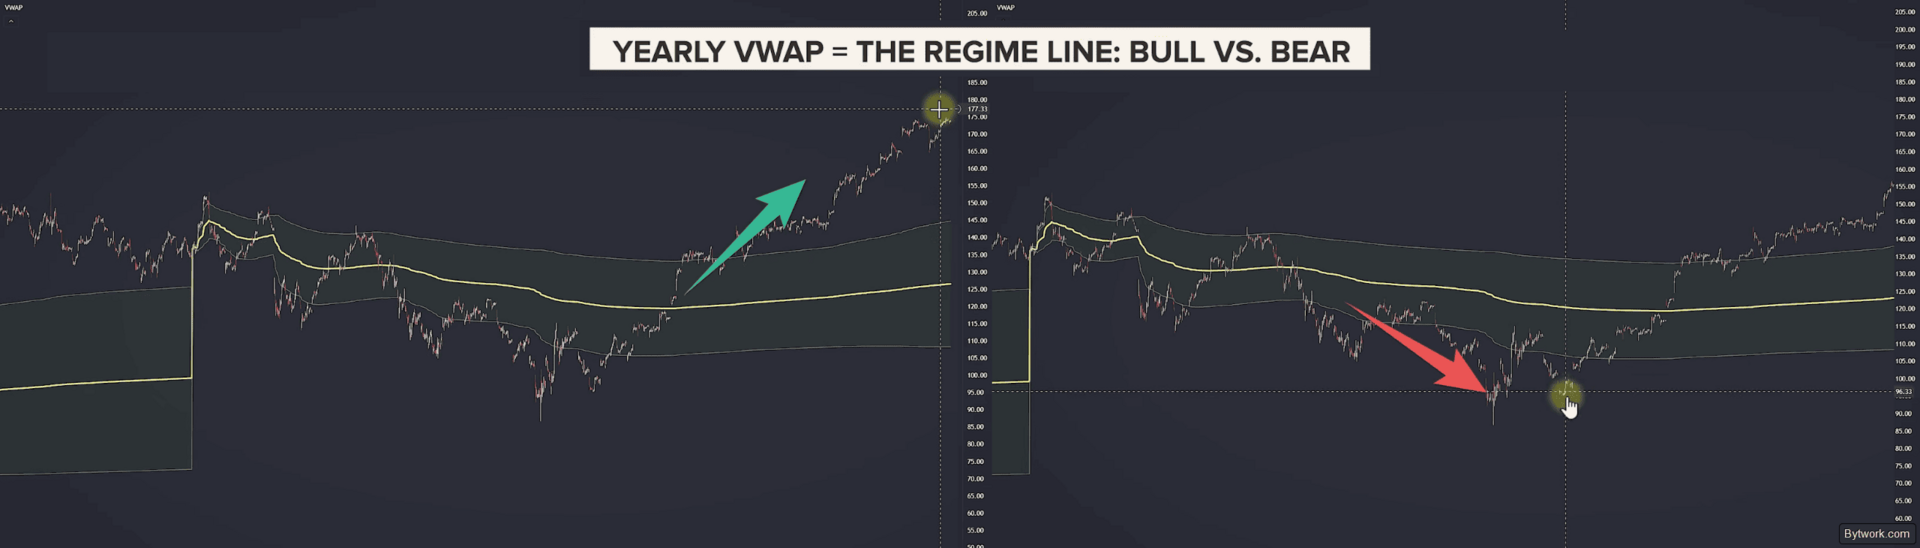
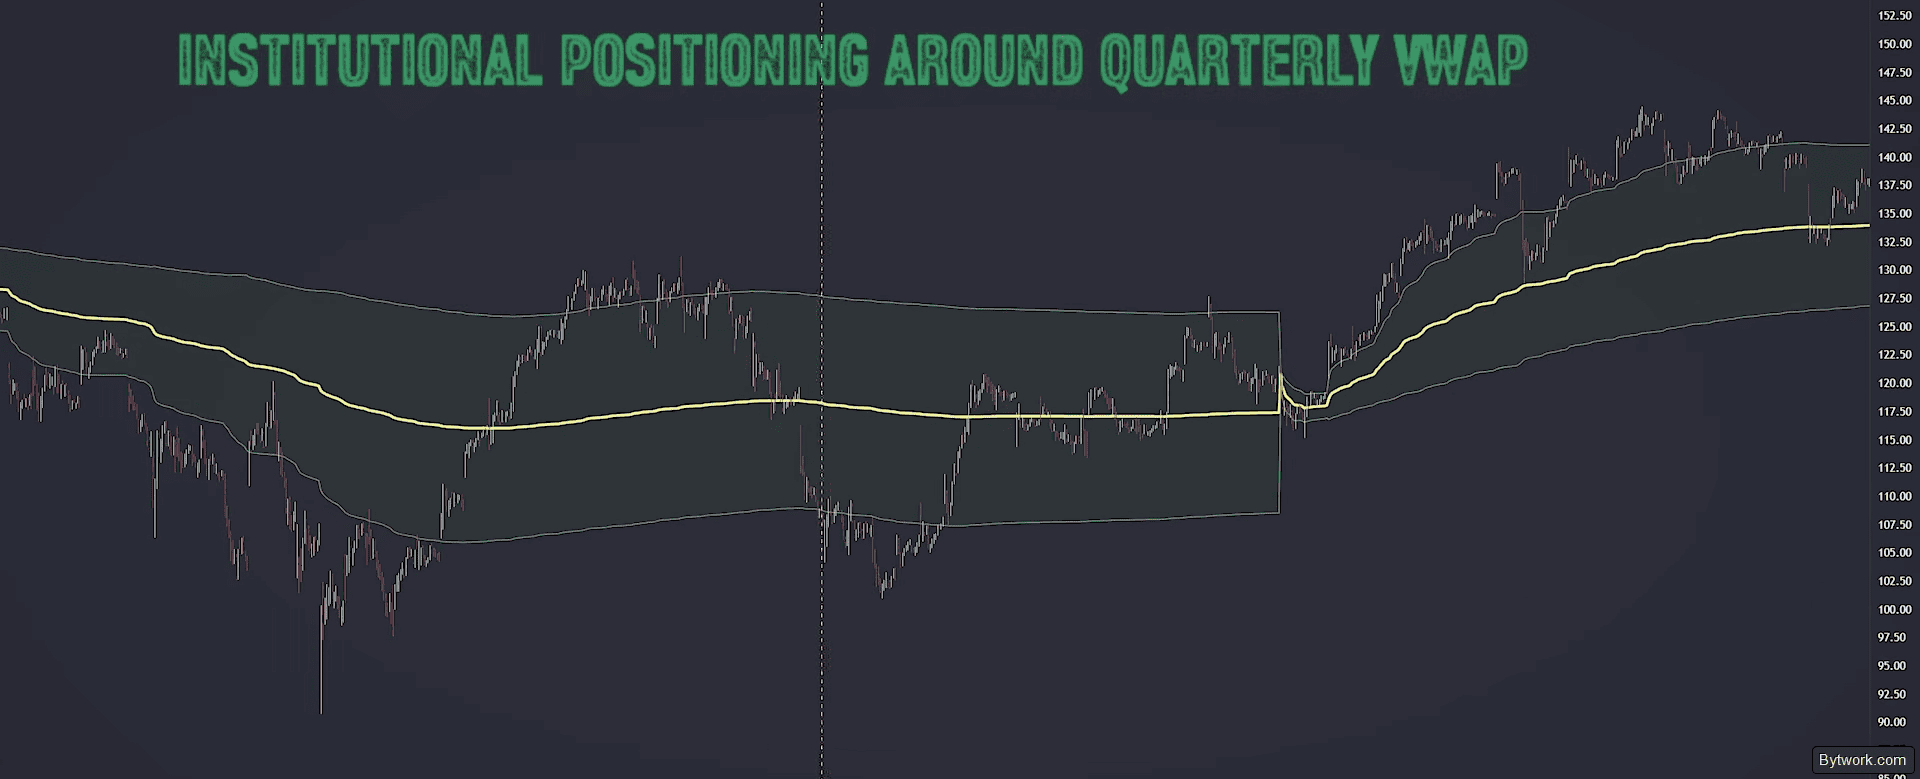

We have derived a rule: the higher timeframe VWAP always takes precedence over the lower, so weekly dominates daily, and monthly dominates weekly. Synchronous alignment of daily, weekly, monthly, and yearly periods signals institutional FOMO and foreshadows strong moves.
Position size for long‑term trades should be adjusted based on distance from VWAP. For example, at a 5% deviation from monthly VWAP, use half the normal size; within 1% – full size.
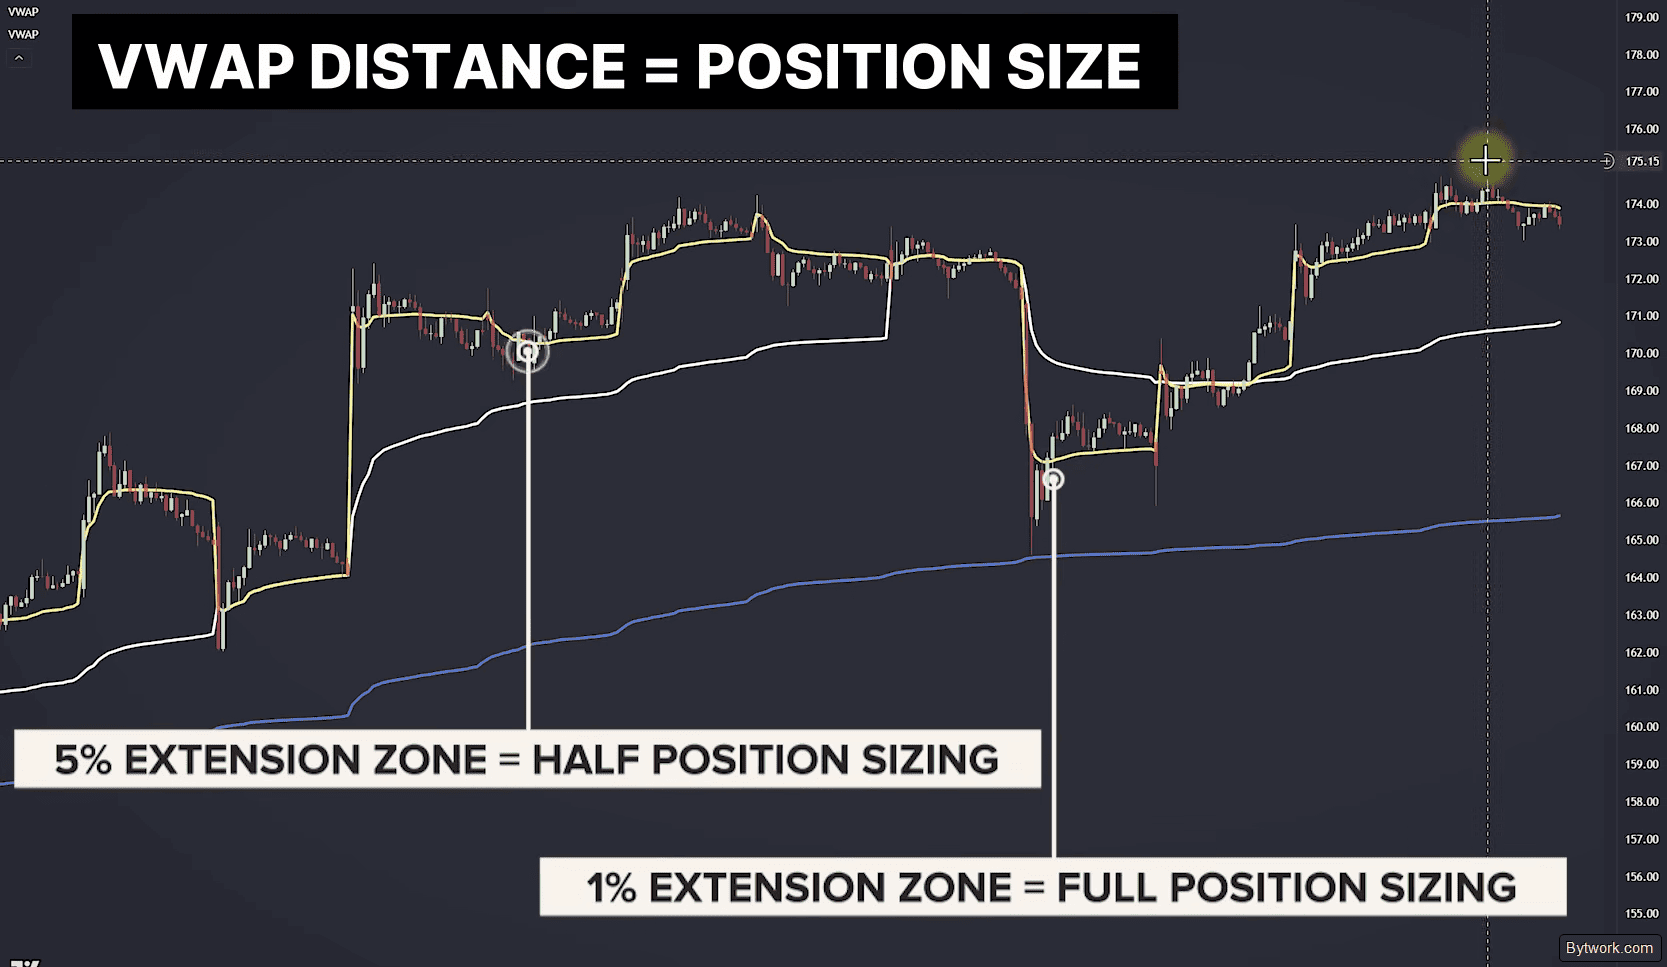
This rule protects you from buying at tops and selling at bottoms.
When does VWAP stop working?
It is equally important to know when VWAP stops working. Low volume (below 30% of average) kills VWAP reliability. Price can pass through it freely without resistance.
Overnight gaps completely break the continuity of the VWAP session – then yesterday’s VWAP becomes a more relevant guide. This is why the first 15‑30 minutes of trading are considered blind. Although crypto spot markets do not have typical price gaps, the role of key starting points and high‑noise zones is played by global interval shifts – Asia, London, New York – or sharp volume spikes, instead of session openings.

In a choppy environment, price can cross it dozens of times an hour, and every cross looks valid but immediately reverses. Recognise this state by chaotic price action and widened bands.
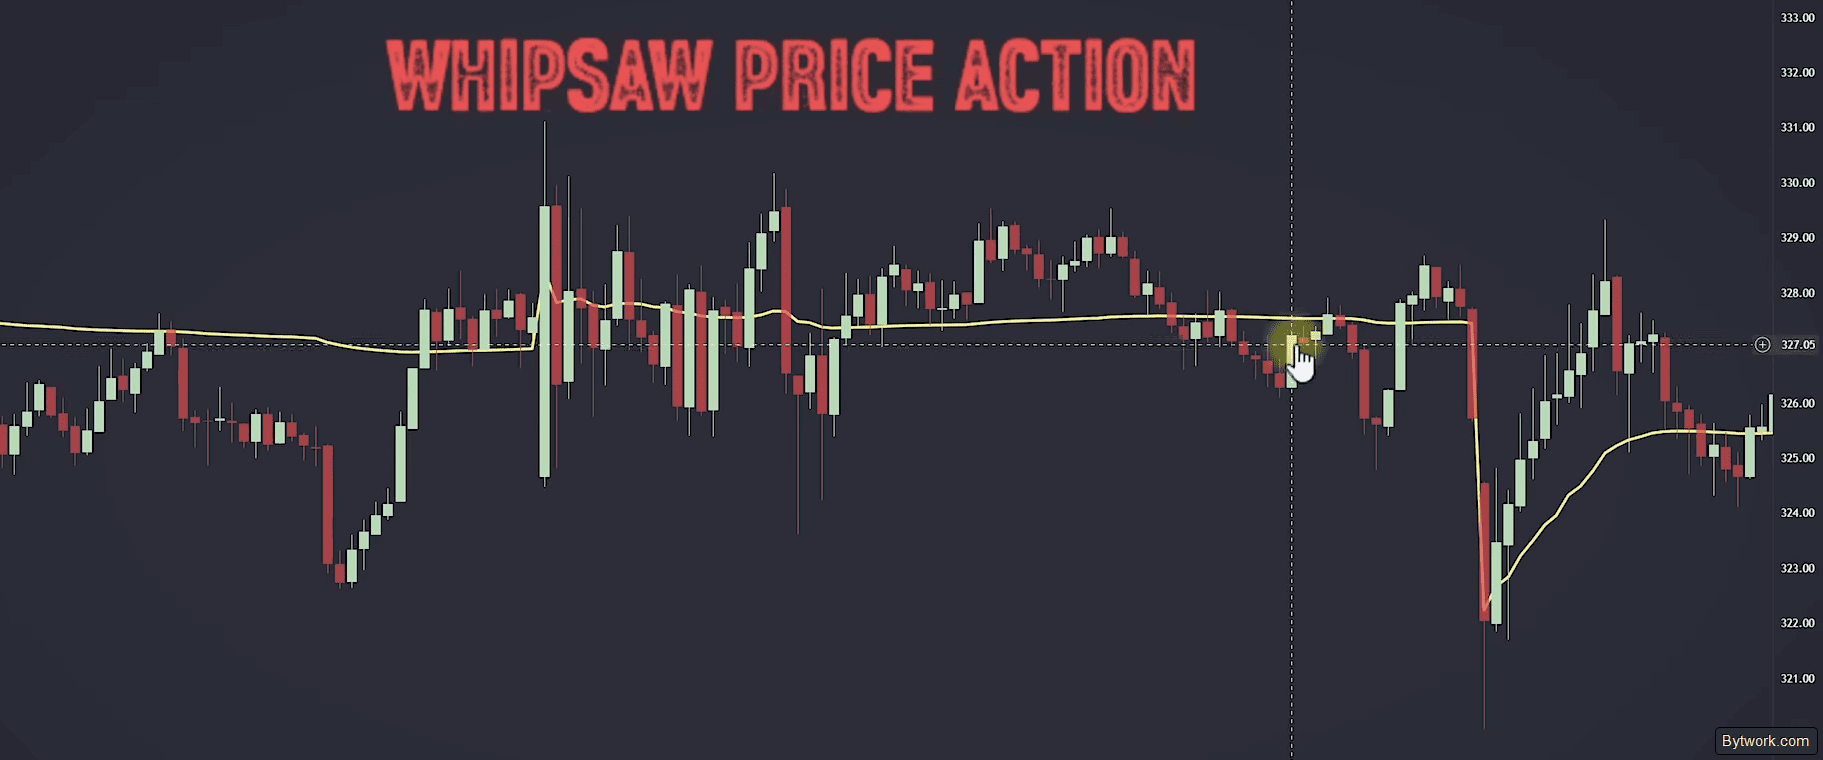
Over years of trading, we have identified 6 more cases:
- Price can make a trend‑day move without pullbacks along the indicator bands in a strong directional trend. This completely debunks the myth of an obligatory return to the midline and burns counter‑trend positions.
- Cumulativeness reduces VWAP sensitivity towards the end of the day, making it useless in the evening without Price Action filtering.
- Algorithms keep price below the line for up to 1 hour to collect liquidity and trigger a short squeeze.
- In a range, trading inside the range is 2‑3 times more effective than trend breakouts.
- Session VWAP resets every 24 hours, so it is only suitable for intraday scalping and not for daily or weekly charts.
- VWAP is purely a historical cumulative indicator of price and volume, lacking predictive properties.

Stay flexible and anchor VWAP to alternative points: the high or low of the previous day, or the last major volume spike.
Practical Guide
Below we present our checklist for trades, TradingView settings, analysis of common mistakes, and strategies.
Pre‑trade Checklist
Check every item before entering a trade. If any of the 5 points is not met – skip the trade.

- Price at the level. Price is directly at the VWAP line or its significant level (daily, weekly, monthly).
- Institutional volume. Current trading volume has risen above the average.
- Timeframe hierarchy. VWAP directions and lines on multiple timeframes align or intersect at the same point.
- Market context. The overall broad market trend confirms and supports the direction of the chosen trade.
- Band condition. The indicator bands are in a clear expansion phase (trend) or contraction (range).
Our TradingView Settings
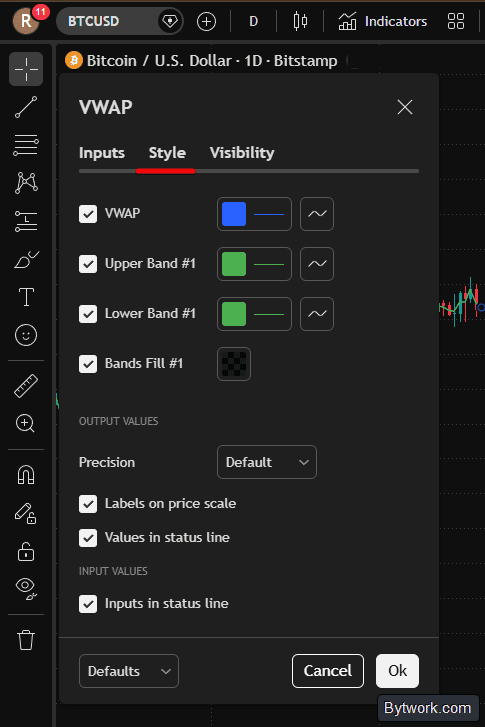
In TradingView, go to the “Indicators” tab and type “Volume Weighted Average Price” in the search. When adding VWAP to the chart, 3 pairs of additional lines – multiplier bands – appear automatically. They can be set as standard deviations (1, 2, and 3 sigma) or percentage deviations (1%, 2%, and 3% from the current VWAP value).
This is the default behaviour, and many do not notice that these lines can be completely removed or customised (colour, thickness, fill) in the Style tab of the indicator settings.
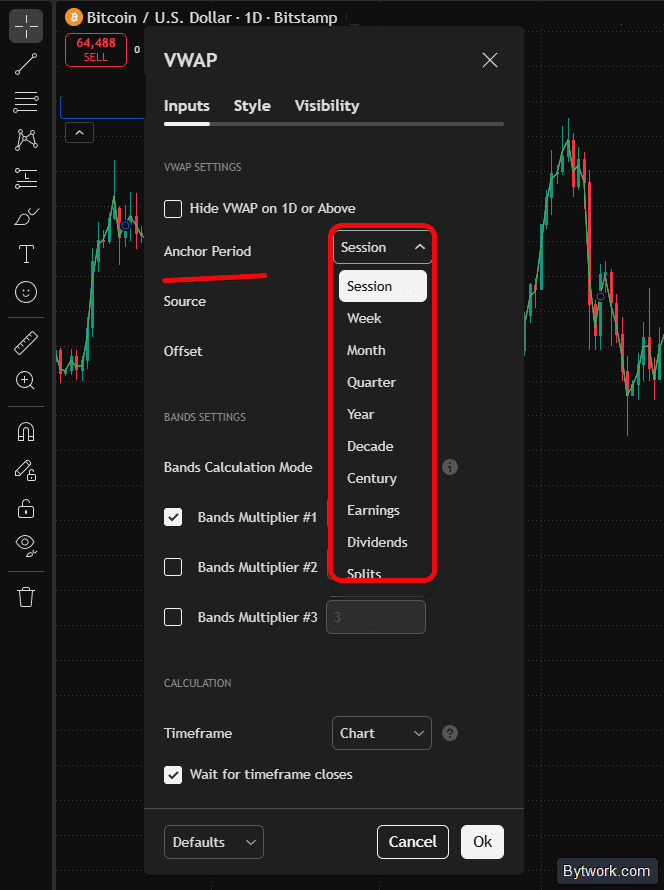
The Anchor Period is a crucial metric determining when the calculation resets.
- Session – the basic reference for intraday traders, where VWAP resets every 24h or at the market open.
- Week and Month are popular among swing traders on 30‑min and 1‑hour timeframes to determine the medium‑term trend.
- Year helps identify global market regimes – in a bull trend, price can trade above yearly VWAP for months.
The Bands Multiplier setting shows the statistical probability of price being within the range.
- First band (±1 SD) contains 68.26% of all price movements.
- Second band (±2 SD) holds 95% of price – touching it signals extreme overbought or oversold.
- Third band (±3 SD) covers 99.7% of data – breaking beyond it occurs only in 0.3% of cases and often marks the final climax of the move.
For aggressive scalping and 1‑minute entries, professionals use tight multipliers like 0.5, 1.0, and 1.5.
To reduce visual noise, we prefer to disable the background fill (Band Fill) and keep only the central line and the 2nd deviation band. This allows us to focus on mean reversion with a 70‑80% success rate on ranging days.
We calculate VWAP using the price (High+Low+Close)/3. However, other sources are available in settings – Open, Close, High, Low, as well as (High+Low)/2, and (Open+High+Low+Close)/4.
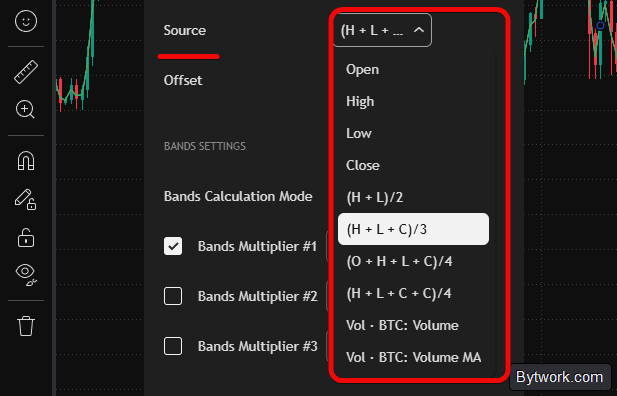
Choosing an alternative source (e.g., the arithmetic average of the high and low over the period) changes the line values and its sensitivity to impulses, providing an edge when customising a specific trading strategy.
How to Choose the Indicator Type?
Besides standard VWAP, there is also Anchored VWAP (AVWAP), which anchors to any important point. Which to choose – see the table below.
|
Algorithm modification |
Specifics |
Format / Developer |
|
Anchored VWAP (AVWAP) |
Calculates the volume‑weighted average price from any chosen point (news, reports, High/Low). It does not reset daily, preserving historical memory of the level. |
Drawing tool (left panel) |
|
Uses a floating calculation period and never resets. It better describes price at the end of the day when regular VWAP becomes sluggish. |
Editors Pick (TradingView) |
|
|
Dynamic Swing Anchored VWAP |
Automatically moves the anchor point to new confirmed swing highs and lows. Adapts speed to volatility. |
Community script (author – Zeiierman) |
Apart from anchored versions, there are also session‑based ones. This collection of scripts expands the capabilities of standard VWAP by anchoring to specific events, sessions, and volumes. This allows you to more precisely find entry points and filter false signals.
|
Name |
Specifics |
Format / Developer |
|
Session Volume Profile |
Displays volume distribution across price levels for the trading session. Helps identify Point of Control (POC) and high‑volume nodes (HVN). |
TradingView |
|
TPO (Time Price Opportunity) |
Shows the distribution of market activity (profile) based on time and price over selected intervals (15 min, 30 min, hour). |
TradingView |
|
Session VWAPS |
Allows manual selection of specific trading sessions (London, New York, Asia) for calculation, accounting for time zone differences. |
Community script (author – QuantVue) |
|
LuxAlgo Free ASFX A2 VWAP |
Automatically plots VWAP lines for the current and previous days. The previous day acts as an important support/resistance level. |
Community script (LuxAlgo) |
These 3 algorithms generate ready buy/sell signals and filter false breakouts of VWAP bands, helping you enter trades in time.
|
Name |
Specifics |
Format / Developer |
|
VWAP and Standard Deviation Bands |
Generates trading signals (diamonds) when price touches the deviation bands. Customisable band multipliers for fast trades. |
Community script (author – ChartPrime) |
|
Turtle Trade Channels |
Used in combination with VWAP to confirm momentum changes and entry points. |
Community script (author – Kevans / Spillgig) |
|
Indicator for volume confirmation and impulse strength. Helps filter entries on VWAP band breakouts. |
Community script (author – LazyBear) |
Heat maps complement VWAP well. VWAP‑oriented algorithms slice orders and gradually feed them into the market over the course of a day or week. This is reflected on the heat map as patterns of market interest.
The combination of VWAP, Volume Profile (POC/HVN) and Price Action forms an A+ setup. Crypto trading requires mandatory reinforcement of this combination with the Cumulative Delta indicator for accurate false‑breakout filtering.
Now, onto the strategies!
VWAP Strategies
The essence of all strategies is summarised below.
Mean Reversion Method
Applied in a balanced market with a horizontal range and parallel deviation bands.
- Core idea: VWAP acts like a magnet pulling price back from overbought or oversold zones.
- Entry at the touch of the second deviation band (Multiplier 2.0), which historically contains 95% of all moves.
- Confirmation via patterns like “Hammer”, “Shooting Star”, or a long wick, with a bounce probability back to VWAP around 70‑80%.
- Exit take‑profit strictly at the central VWAP line.
Trend Pullback
Used when large funds use VWAP as a fair value marker during a clear trend with a strong slope.
- Idea: find points where institutional players use any pullback to the line as a chance to add to positions.
- Entry on a test of the VWAP line (first or second) after a strong impulse.
- Protection against false breakouts by requiring price to hold the level for at least 3 candles.
- Exit take‑profit at the first or second deviation band in the direction of the trend.
“Stack” Strategy
Applied when synchronising timeframes to find explosive moves on the chart.
- The signal originates when algorithms of intraday traders, swing players, and large funds start looking in the same direction.
- Long conditions: daily VWAP above weekly, weekly above monthly, and current price above all three lines.
- Short conditions: daily VWAP below weekly, weekly below monthly, and current price below all three lines.
- The result of consensus gives a powerful impulse that typically travels 3 times the standard daily range.
Anchored VWAP
Used to track market memory after major news, when standard session VWAP resets and loses relevance.
- Math: the algorithm calculates the average price of all participants since the event, where price position determines their profit or loss.
- Anchor points are chosen based on IPO dates, earnings reports, FOMC meetings, CPI data, or strong gaps above 3%.
- “Dual AVWAP” trick: set the first anchor at the trend start, the second at the first major pullback to form a support zone for months ahead.
Confluence (VWAP + Volume Profile)
Applied when combining the vertical calculation of VWAP with horizontal volumes of the market profile.
- Maximum strength is achieved at the institutional confluence point where the indicator line intersects with the highest volume nodes POC or HVN.
- In practice, traders work from confluence zones where the largest limit orders are concentrated.
- Ultimately, such a combination guarantees a significantly higher win rate compared to using the indicators separately.
Q&A
How to boost signal accuracy when using VWAP?
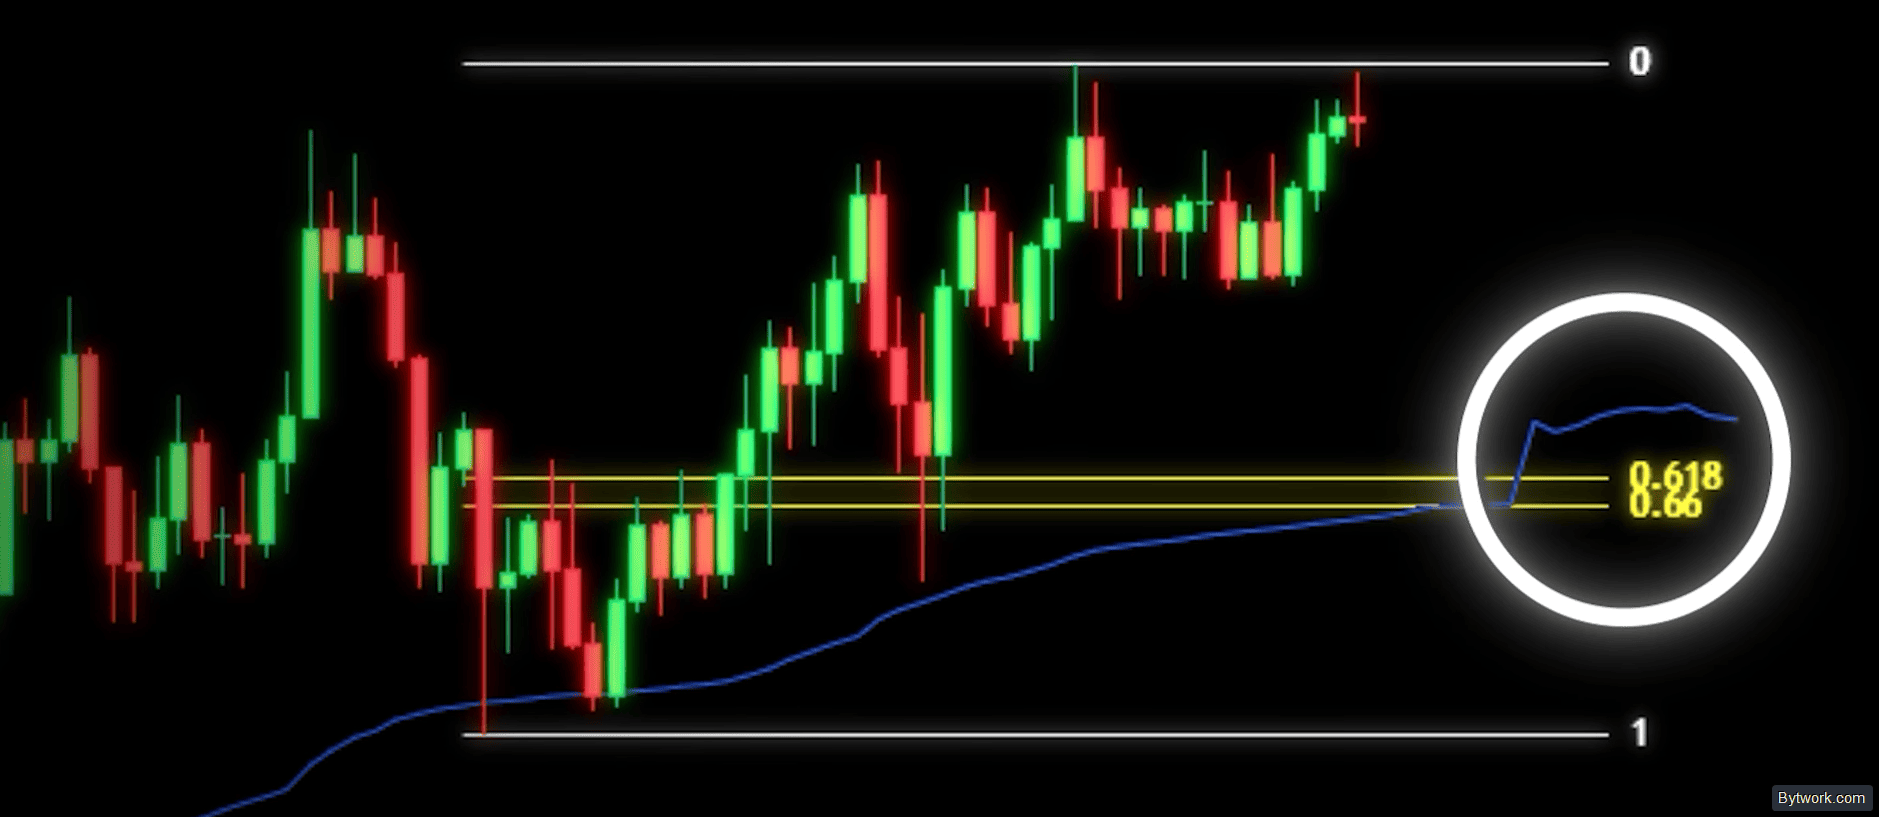
Look for confluence – alignment of VWAP with other levels, e.g., Fibonacci 61.8% or horizontal zones. Also, overlaying multiple VWAPs with different anchor periods (week, month) provides stronger confirmation.
What does reaching the 3rd VWAP band mean?
It is an extreme overbought or oversold marker, after which a return to the mean is likely.
What risk/reward ratios are recommended for VWAP trading?
Ideally, aim for 1:2 or 1:3. Place a stop‑loss below the recent low or below VWAP, and set the target at the next key resistance (for longs) or support (for shorts).
Why add a separate volume indicator to the chart if VWAP already accounts for volume?
A separate volume indicator allows you to see the magnitude of trading activity visually (as bars under the chart). This helps correlate volume spikes with VWAP behaviour and identify moments when price deviates from the average with high or low participation of large players.
On which timeframes is VWAP most effective?
For day trading and scalping – from 1 min to 15‑30 min. The hourly interval is acceptable, but it is recommended to stay below the 30‑minute timeframe.
What is the statistical proportion of trending markets applicable to VWAP strategies?
Only 30% of the time the market is in a sustainable trend, the remaining 70% is in a range. This means VWAP is effective for trend approaches only one‑third of the time – in a range, a different tactic is needed.
Why can’t you set a fixed profit target at a single VWAP level?
VWAP continuously updates throughout the day, shifting with price and volumes. A fixed target becomes obsolete within minutes, so the exit point must be adjusted dynamically based on the current indicator value.
Are all versions of the VWAP indicator equally reliable?
No. Custom builds may have unknown formulas, so it is recommended to use only the standard algorithm built into the terminal.
Why shouldn’t you wait for a perfect touch of the VWAP line?
Because the market is imperfect, and waiting for an exact bounce causes you to miss 95% of quality trading opportunities. It is acceptable to consider a zone around VWAP, not the line itself, as the entry point.
What strategies are used with VWAP?
“Mean reversion” – when VWAP is flat and price is at the first/second band; “trend continuation” – when VWAP is sloped, “buying pullbacks” to VWAP or the first band in the direction of the main move.
Afterword
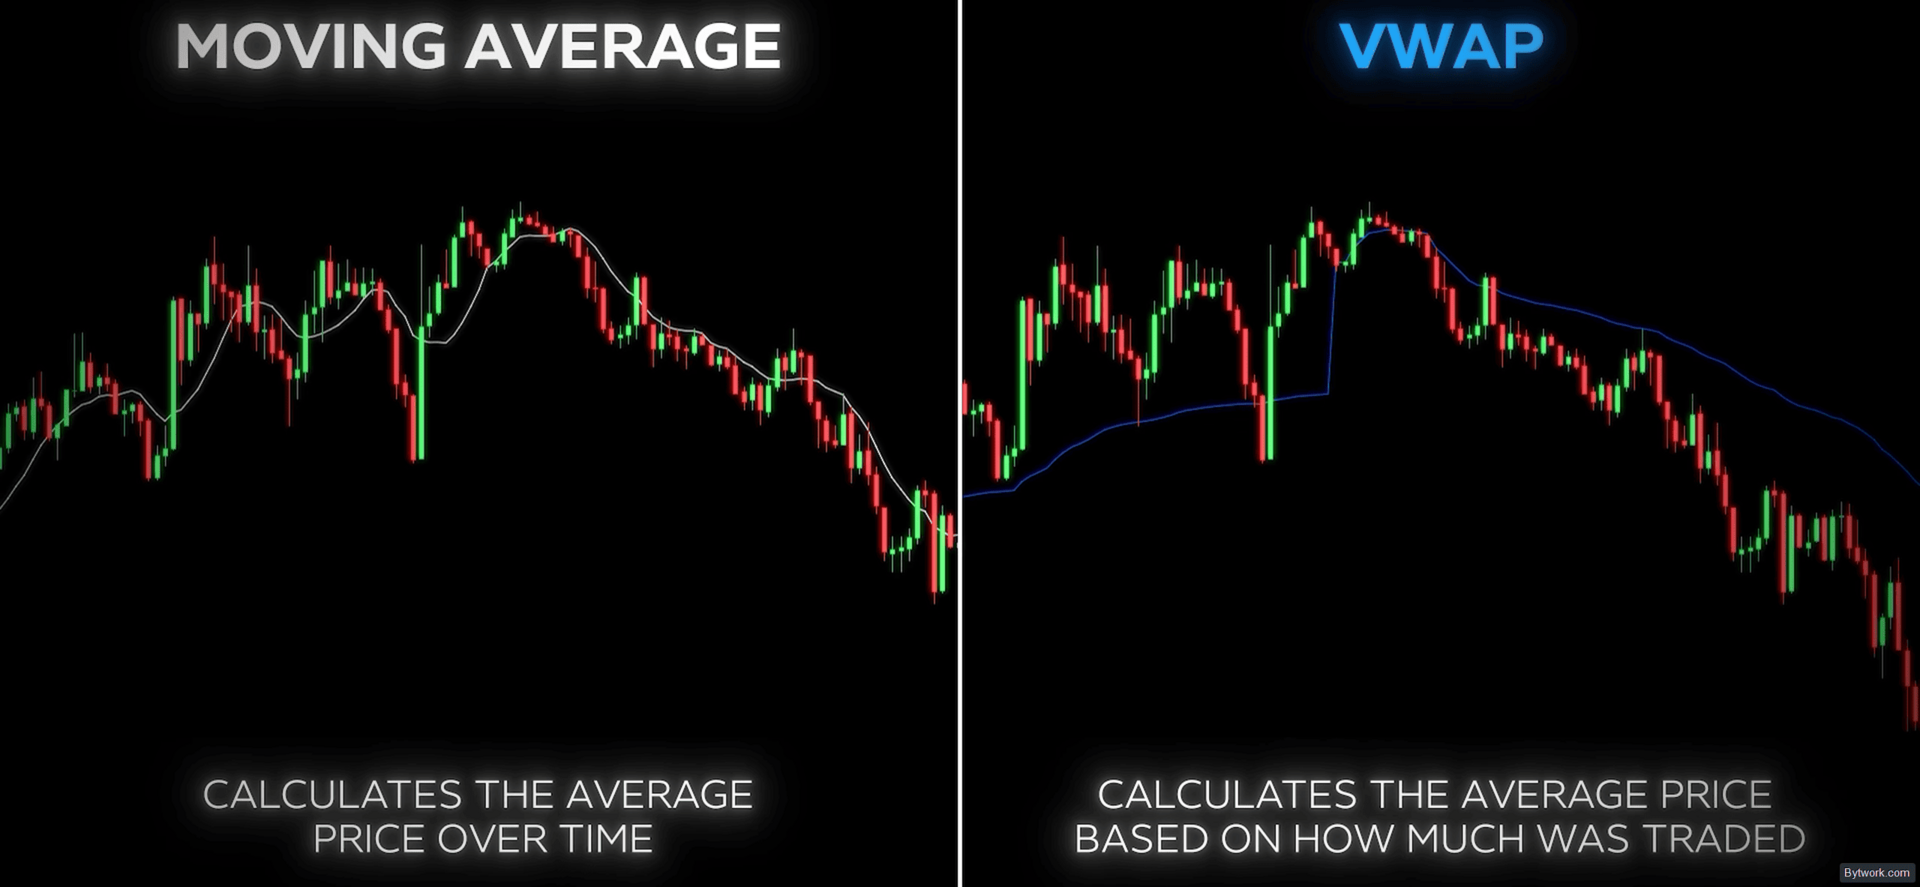
You have now reached the level of understanding of the market as seen by large funds and market makers. Essentially, VWAP is a moving average where the actual traded volume determines the weight of the price and highlights who runs the market.
But remember, it is not an isolated trigger for entry. To stop guessing and start entering trades alongside institutions, combine the indicator with price patterns, strong levels, Fibonacci grids, and higher‑timeframe alignment.
Paired with strict risk management, this becomes the foundation of your consistent profitability. For those who are new to the exchange and do not yet know where to start, we have opened a trading section. Head there to easily pick your first trading system.
Afterword: we have been trading since 2018 and have tested hundreds of strategies and indicators. Your editor – Pavel Grachev for bytwork.com.

Now reading


In DePin, people create networks themselves, share traffic or capacity, and receive rewards in tokens from these projects.