100 hours of ICT trading lectures in 15 minutes: a step-by-step breakdown

You will learn the secrets of ICT strategy authors who elevate trading to the level of professional funds. We will break down strict criteria for zone validity, impulse logic, and entry rules on live charts. This guide will package the scattered knowledge from 100 lectures into a ready-to-use strategy for steady growth of your deposit.
This material is for informational purposes only and does not constitute financial advice.
What is the ICT Concept?
ICT (Inner Circle Trader) is a methodology of technical analysis based on identifying algorithmic pricing models, aimed at detecting "smart money" manipulations, liquidity zones, and imbalances.
Simply put, we uncover manipulations by large funds that sweep your stop-losses and drive the markets.
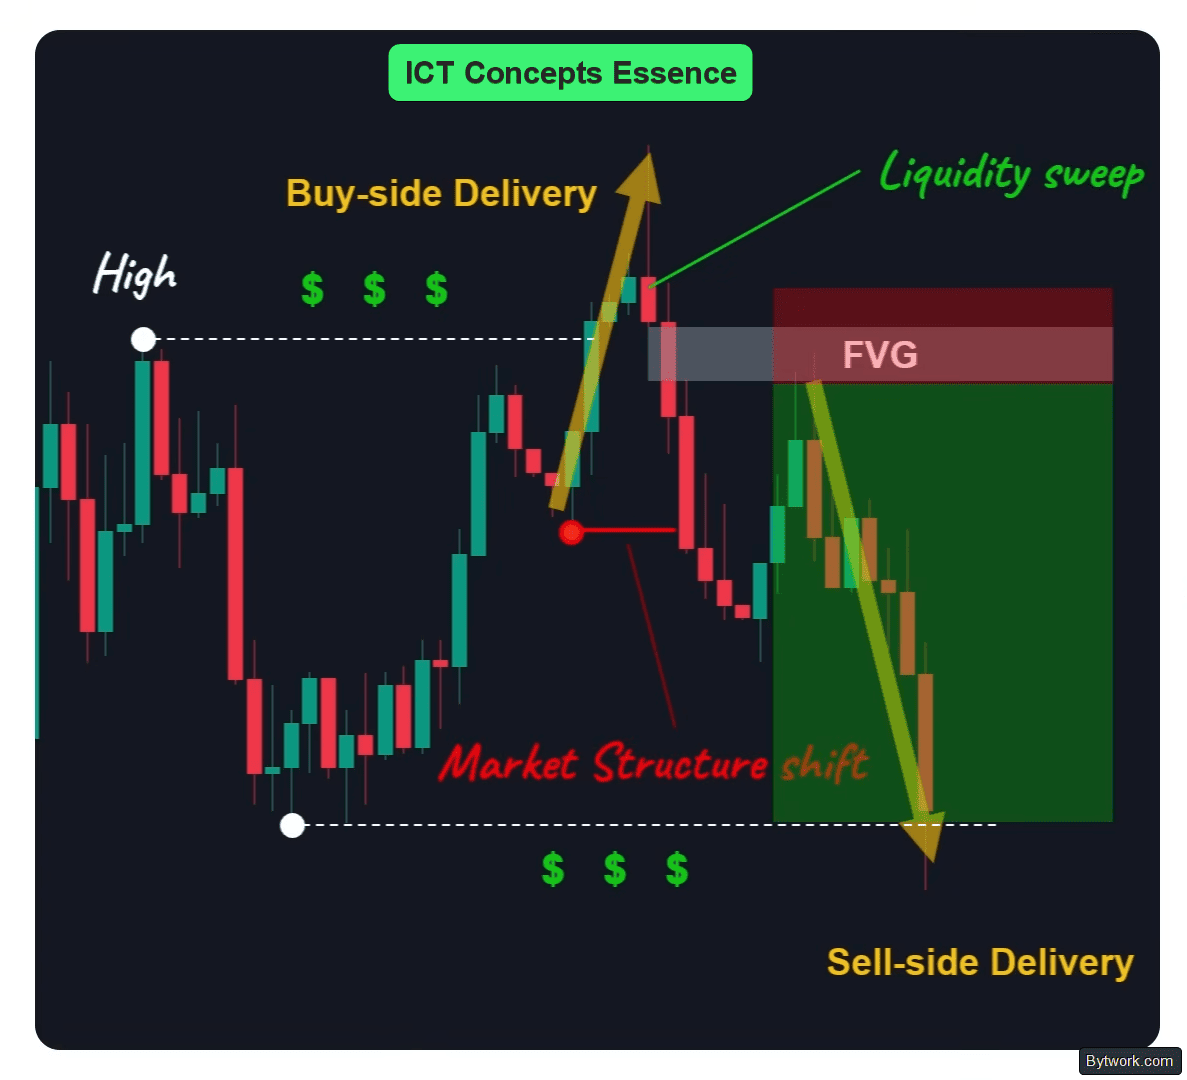
For easier understanding of ICT, we have distilled it into 6 concepts:
- 1. Liquidity is the goal. It answers the question – where will the price go?
- 2. Displacement is the impulse. It shows the strength of the big player who pushed the price toward that liquidity.
- 3, 4, 5. – FVG, Order Blocks, Breaker Blocks – are the traces. Zones left behind by displacement, from which we look for entry.
- 6. Market Structure Shift (MSS) is the trigger. Confirmation on a lower timeframe that it is time to open a position.
The methodology is not a guarantee of profit. However, it provides a statistical edge with proper risk management.
1. Liquidity
Let us start with the first concept – liquidity. Without understanding it, a trader becomes a source of liquidity for market makers, who use algorithms to hunt for it. They know well how retail traders behave.
When you buy at a support level, you place your stop-loss just below that level to protect your position. This is shown in the example below.
Market makers are fully aware of this, and their systems are designed to sweep these stop-losses and create liquidity.
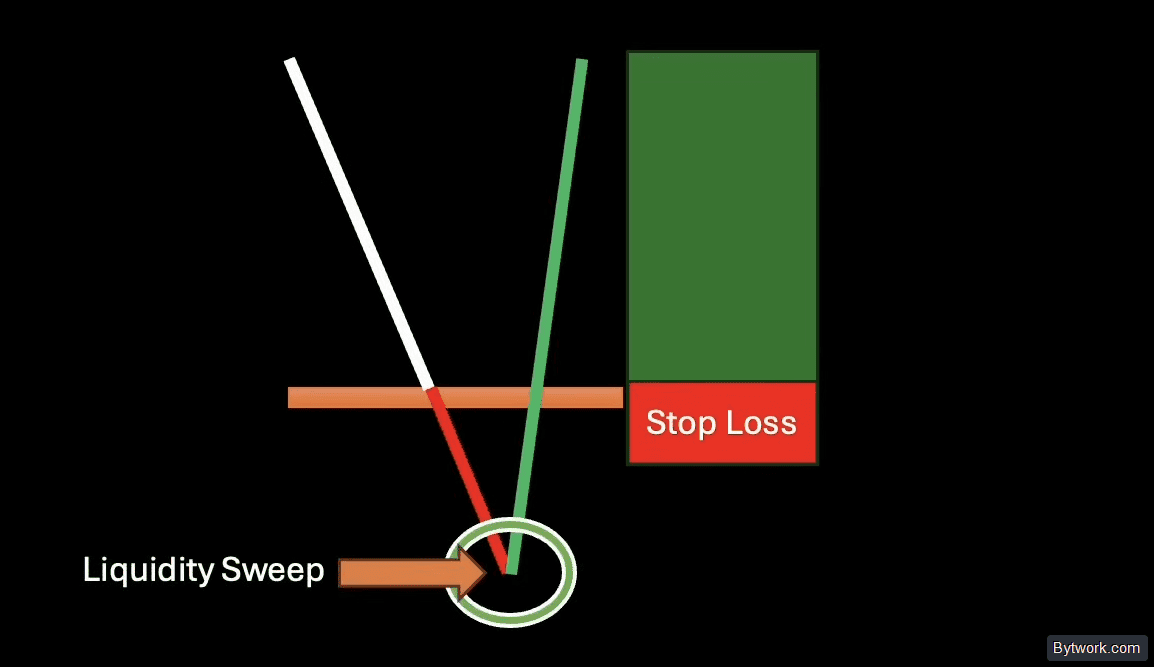
Such clusters of orders are tied to Pivot Points, and liquidation heatmaps help effectively assess the global distribution of large-capital positions.
Similarly, when you sell at a resistance level, the market may break through that resistance, hit your stop-loss, and then move in the direction you originally anticipated.
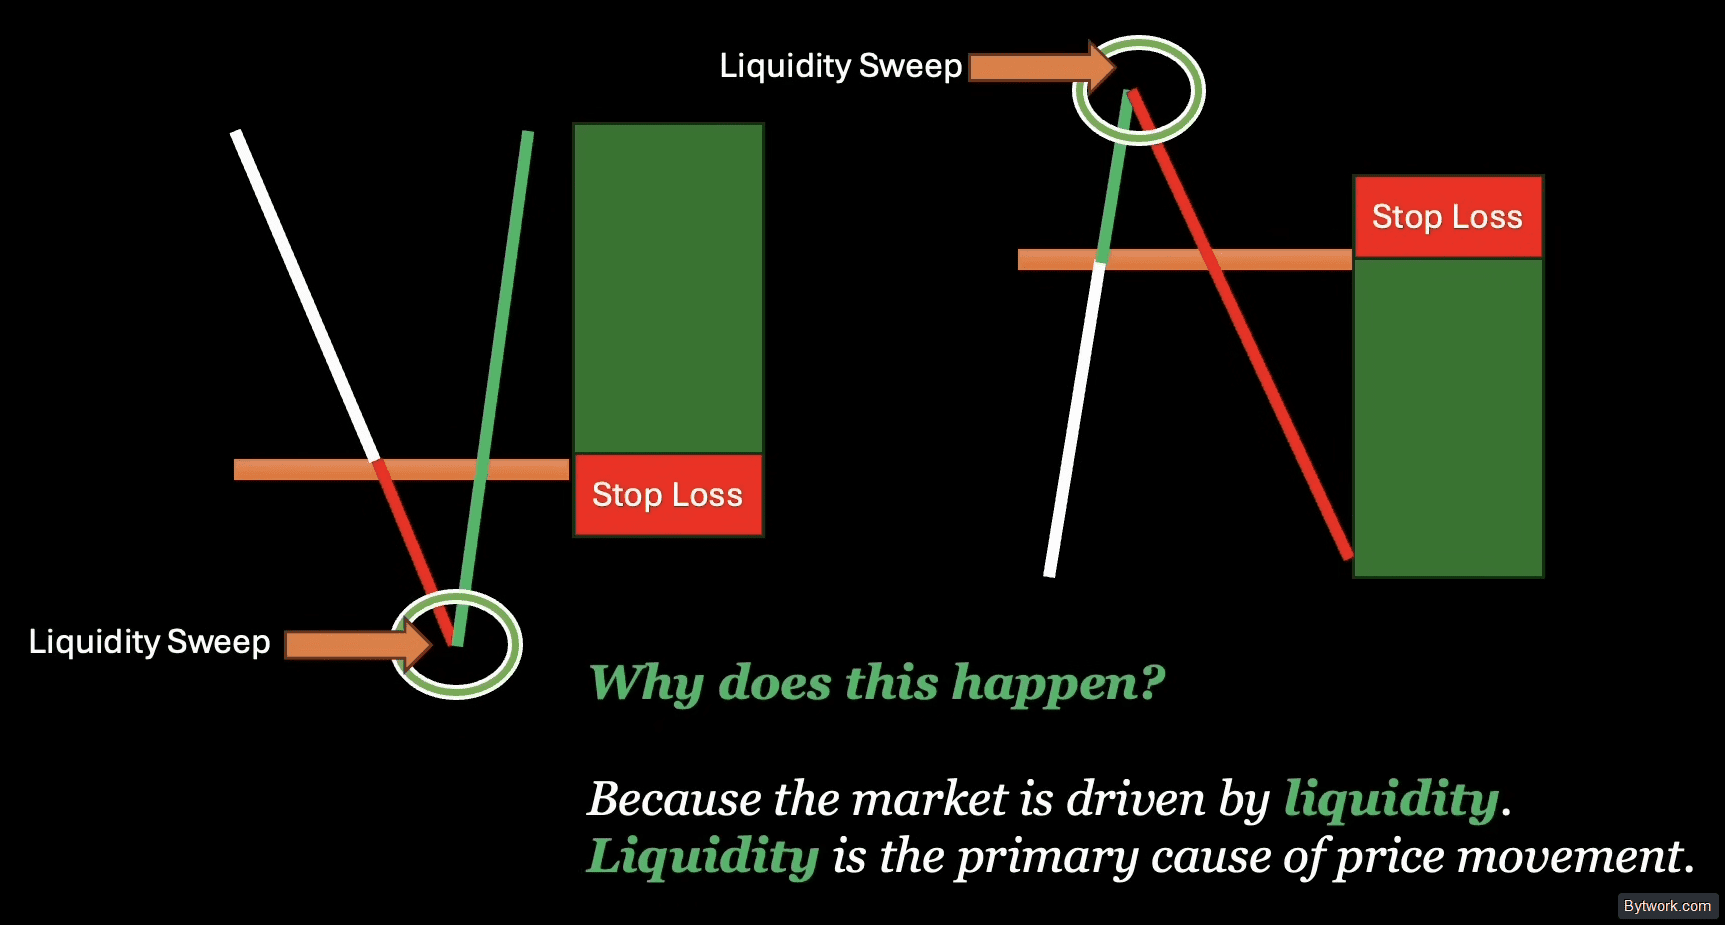
Why does this happen? Because liquidity drives the market – it is the reason for price movement.
There are two types of liquidity:
- buy-side liquidity
- and sell-side liquidity.
Buy-side Liquidity
According to ICT, buy-side liquidity is the volume of pending orders, known as sellers' stop-losses. When opening short positions, traders place them above previous daily or weekly highs for protection.
Stop clusters often form at the boundaries of dynamic trend lines, attracting retail breakout traders.
Market makers deliberately drive price to these levels. There, sellers' stop-losses turn into market buy orders, allowing the big player to offload their shorts and trigger a bearish impulse in the opposite direction.

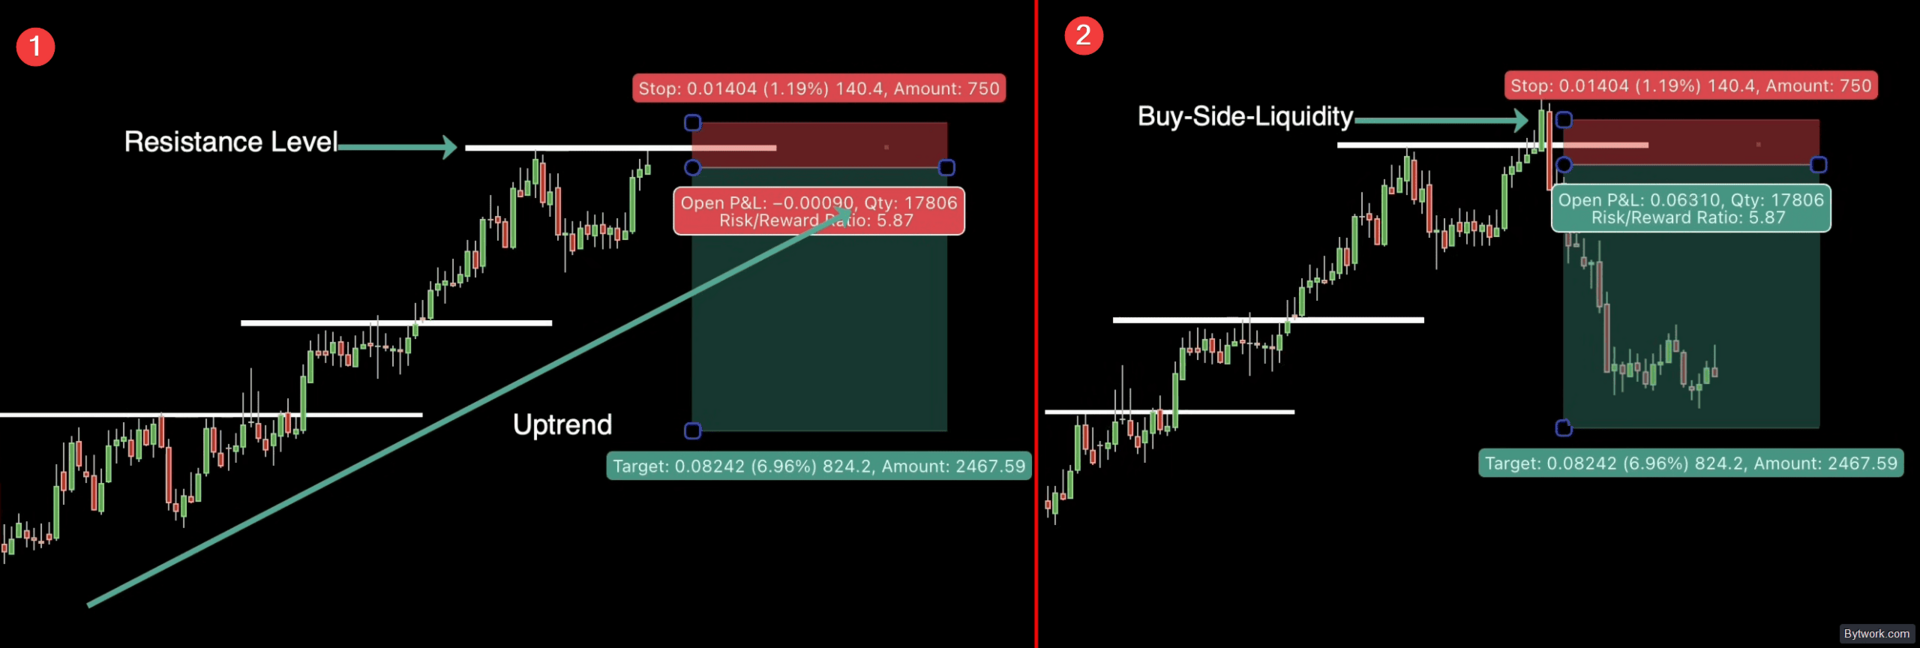
As shown in the example, equal highs act as buy-side liquidity. Market makers sweep these old peaks, collect sellers' stops, and reverse the market downward. This is a classic example of a buy-side liquidity hunt.
Sell-side Liquidity
Sell-side liquidity is the cluster of protective stops from buyers. Traders place them below historical, weekly, or daily lows to protect their long positions.
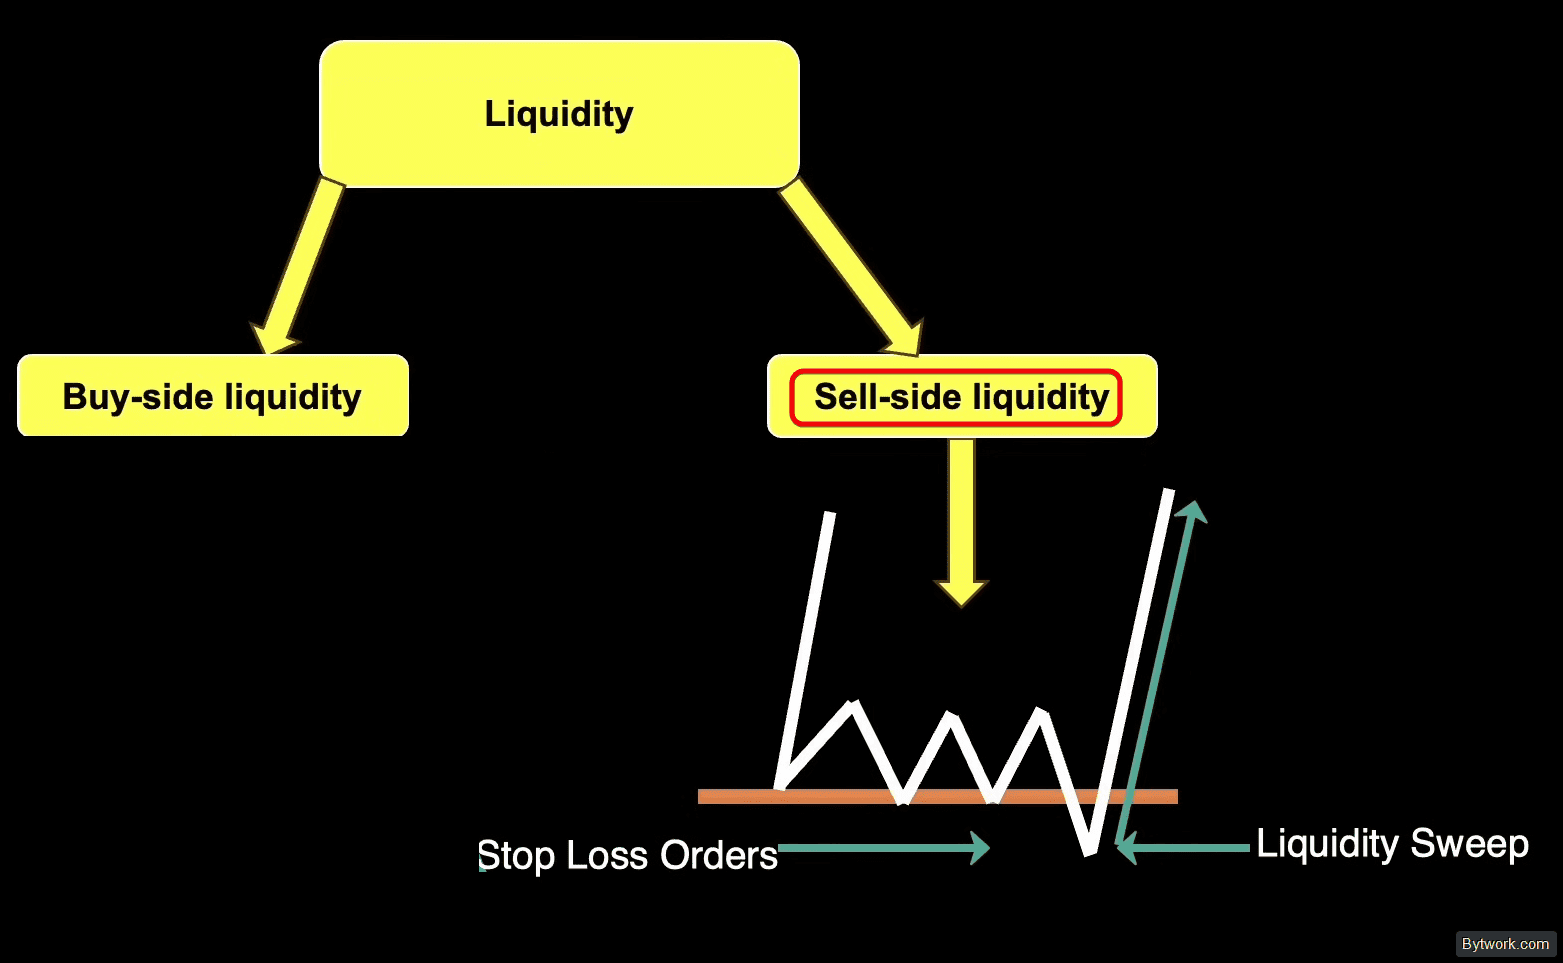
Market makers intentionally push price toward these zones, activating stops and turning them into market orders. After gathering liquidity, price often reverses, and market makers profit from retail traders.
Learn how to find liquidity zones to protect your deposit in our guide.
Examples of Liquidity Hunts
In this example, the market was rising under buyers' control. At resistance, sellers place stops above the level, while breakout traders place pending buy orders on a breakout. Market makers first sweep sellers' stops by breaking resistance, then reverse the market downward. The big player conducted a classic liquidity hunt, collecting protective orders from both sides before the true move began.
In another example, the market was moving down under sellers' control. When price reached a key support level, many traders expected a bounce and entered long positions, placing stops just below support. At the same time, some breakout traders anticipated a breakdown and continuation lower, placing sell orders below the level with stops above.
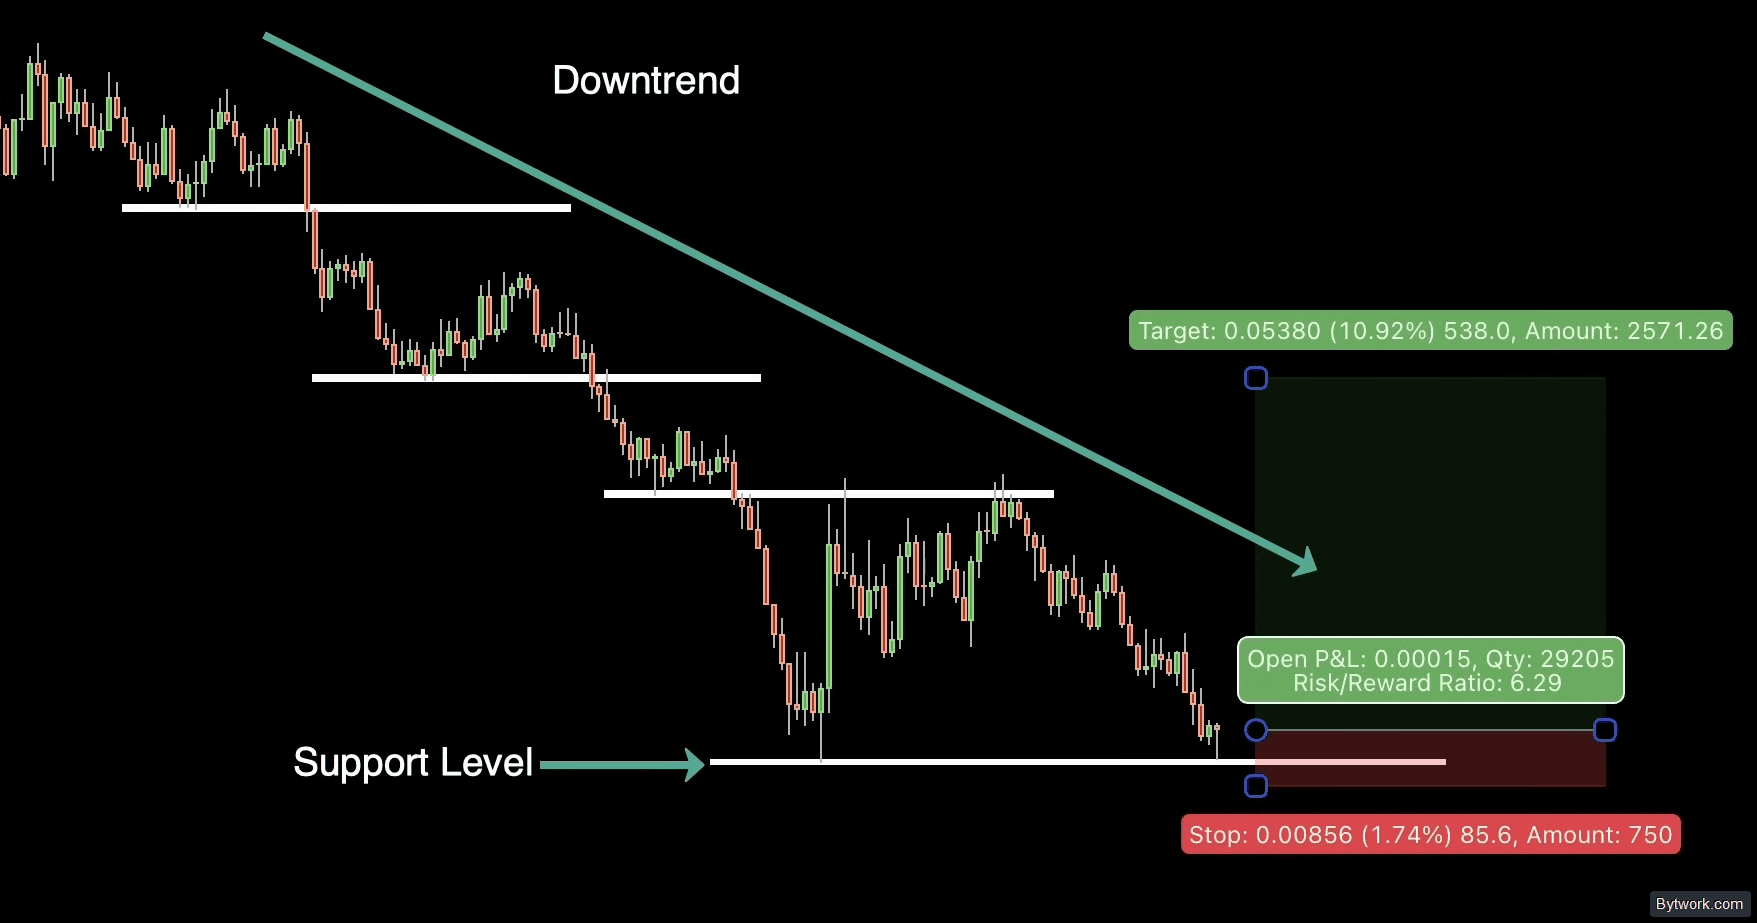
Market makers saw liquidity on both sides. Price first broke support, activating long stops and sell orders from breakout traders. But instead of continuing lower, the market reversed and moved up, hitting the stops of breakout traders.

This is an example of a sell-side liquidity hunt, where the market takes liquidity below support and then sharply reverses upward.
Next in the ICT concepts comes the impulse.
2. Impulse (Displacement)
Impulse in ICT is a sharp and strong price movement caused by large institutional orders. It indicates "smart money" activity and helps traders understand the direction of their orders.
Impulse can be bearish or bullish.
Bullish Impulse
A bullish impulse is a strong upward move by large players.
Its characteristics:
- 3 consecutive bullish candles.
- Large bodies and minimal wicks.
- Smooth rise without pullbacks.
- Presence of FVG (imbalance) as confirmation.
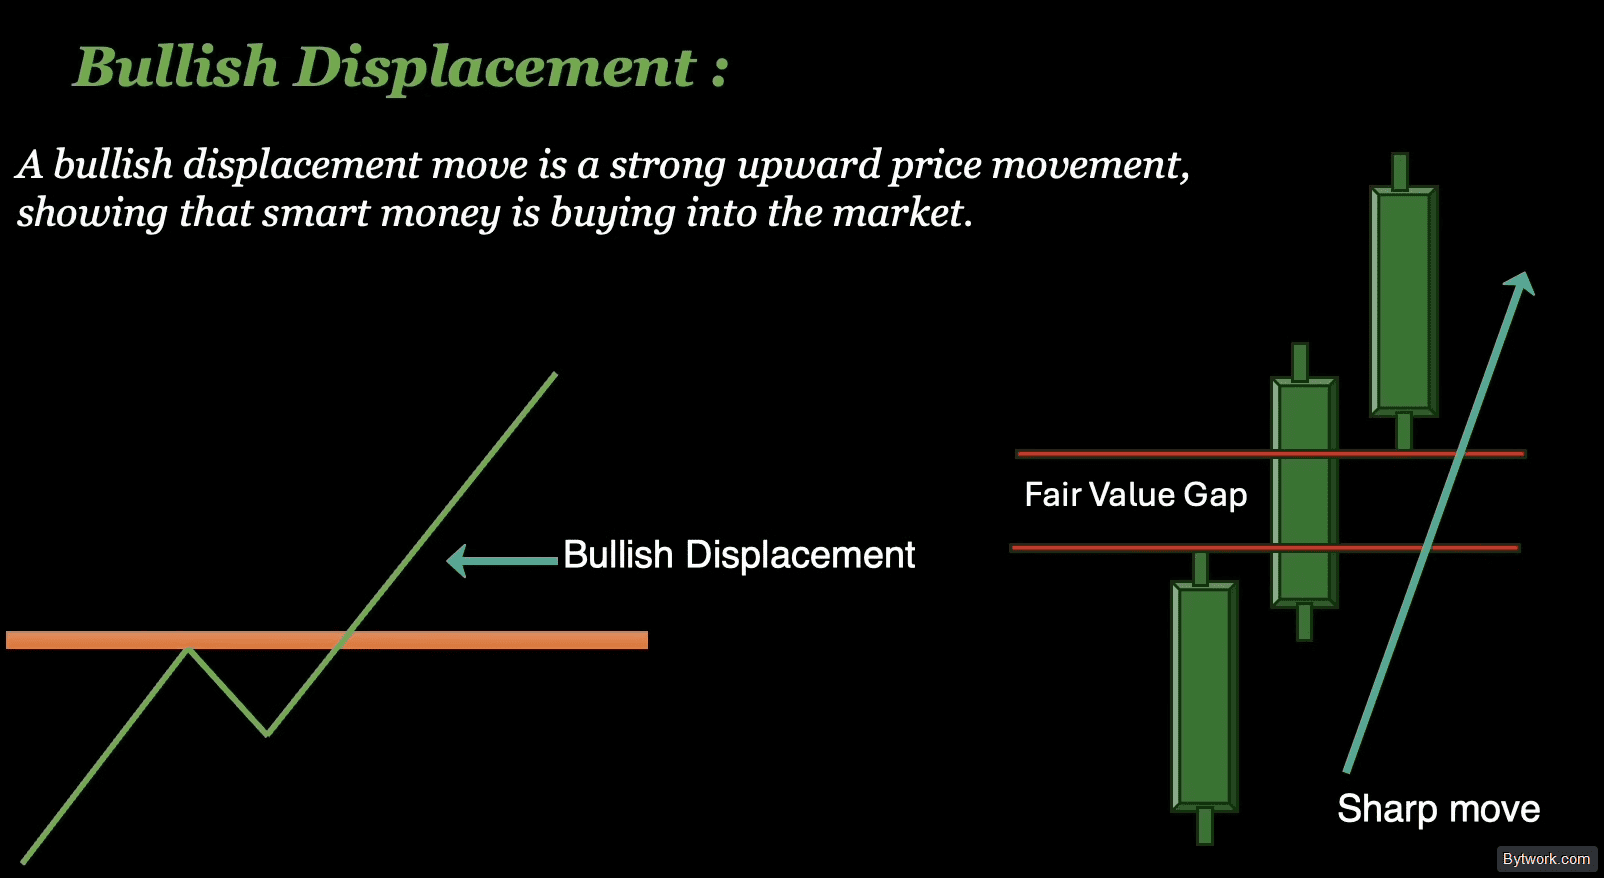
This move proves that institutions are aggressively buying the market.
To understand pricing across different timeframes, it is helpful to recall the basics of Japanese candlesticks and reversal patterns that form the foundation of price action.
Bearish Impulse
A bearish impulse is a strong downward move, indicating active selling. To recognize it, look for at least 3 consecutive bearish candles with large bodies and minimal wicks. Price should fall with strong momentum and limited pullbacks.

Confirmation comes from an FVG between candles, showing that the market dropped rapidly due to institutional selling. This move demonstrates that institutions are pushing the market down.
Let us look at real examples on charts to understand how to identify bullish and bearish impulses.
Examples of Impulses
First, consider a bullish impulse that occurs after sell-side liquidity is taken. On the chart, the market fell to an important support level. Sellers expected a breakdown, while buyers placed stops below support. The market briefly broke the level, taking out buyers' stops and activating short sellers' orders on the breakout. With this move, the big player collected all sell-side liquidity below the level.
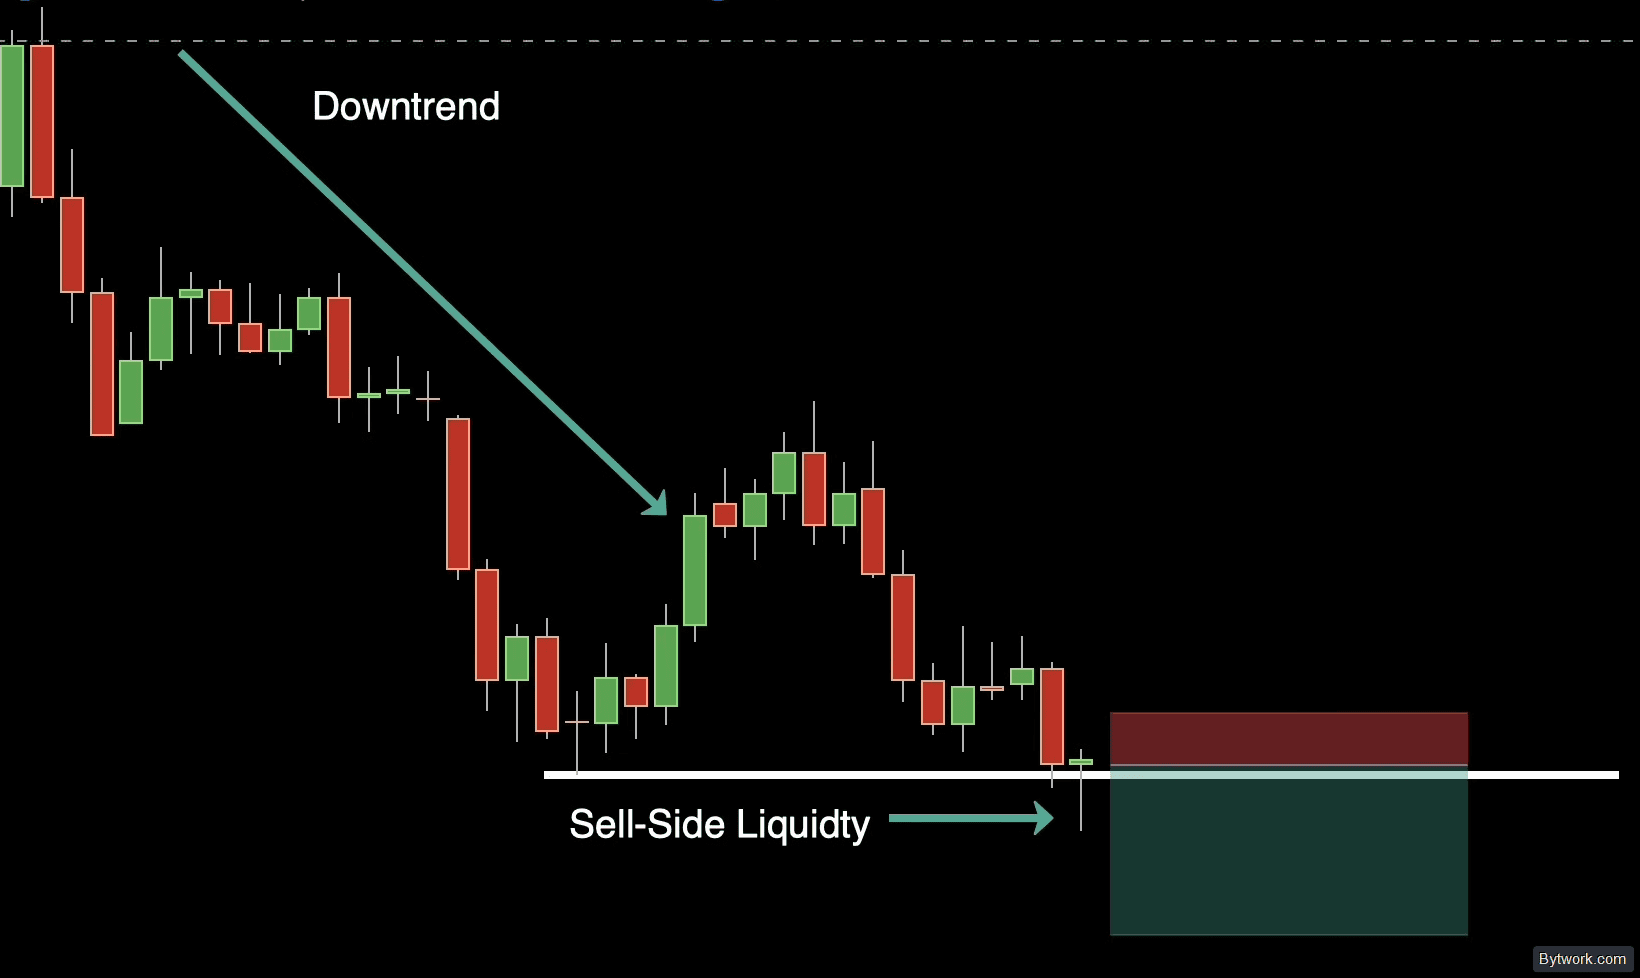
However, instead of falling, the market sharply reversed upward – this is the bullish impulse. To spot it, look for at least 3 bullish candles in a row with large bodies and minimal pullbacks. Between them, an FVG (price imbalance) may form, created by the "smart money" entry.
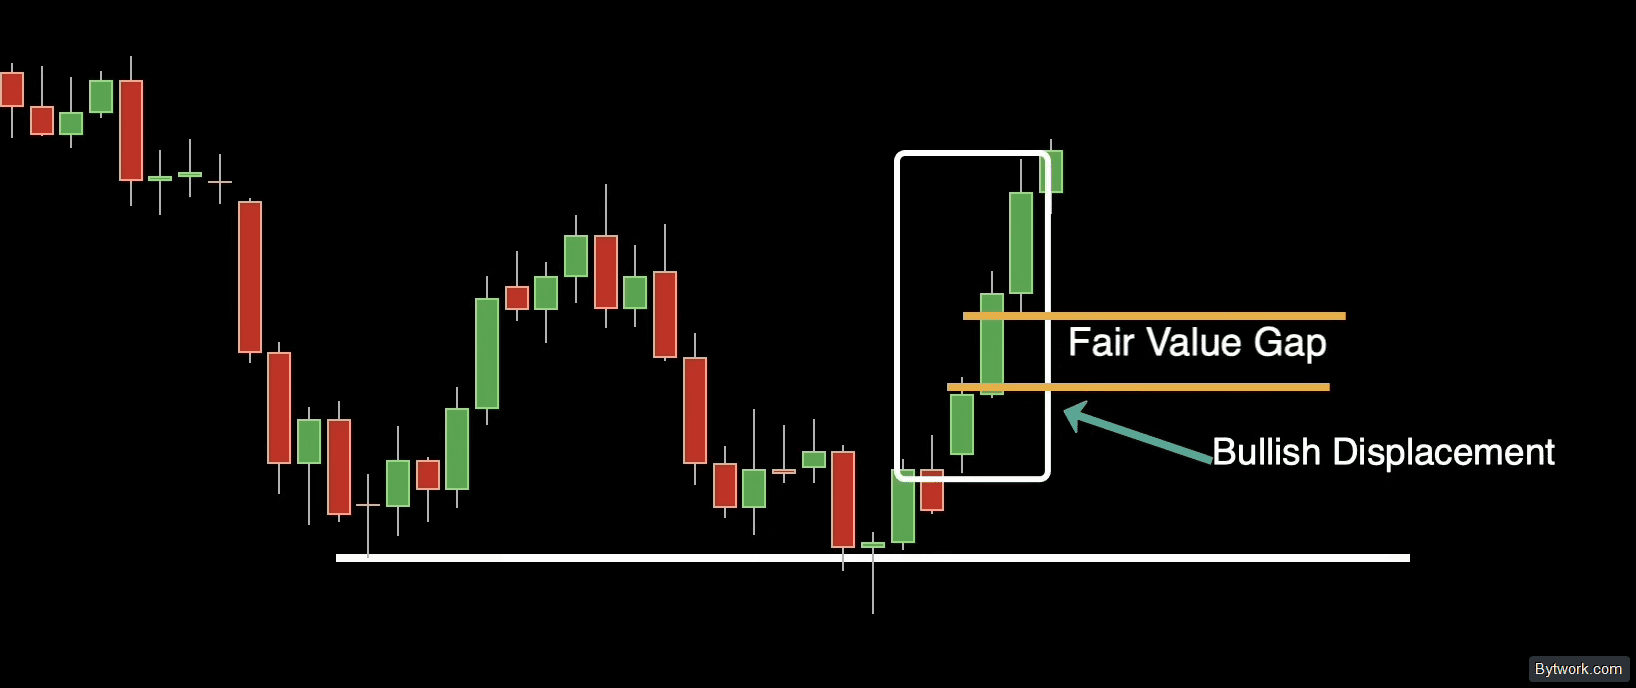
This FVG confirms "smart money" involvement. The bullish impulse clearly shows how the big player collected sell-side liquidity to reverse the market, trapping the crowd in short positions and profiting from their stops.
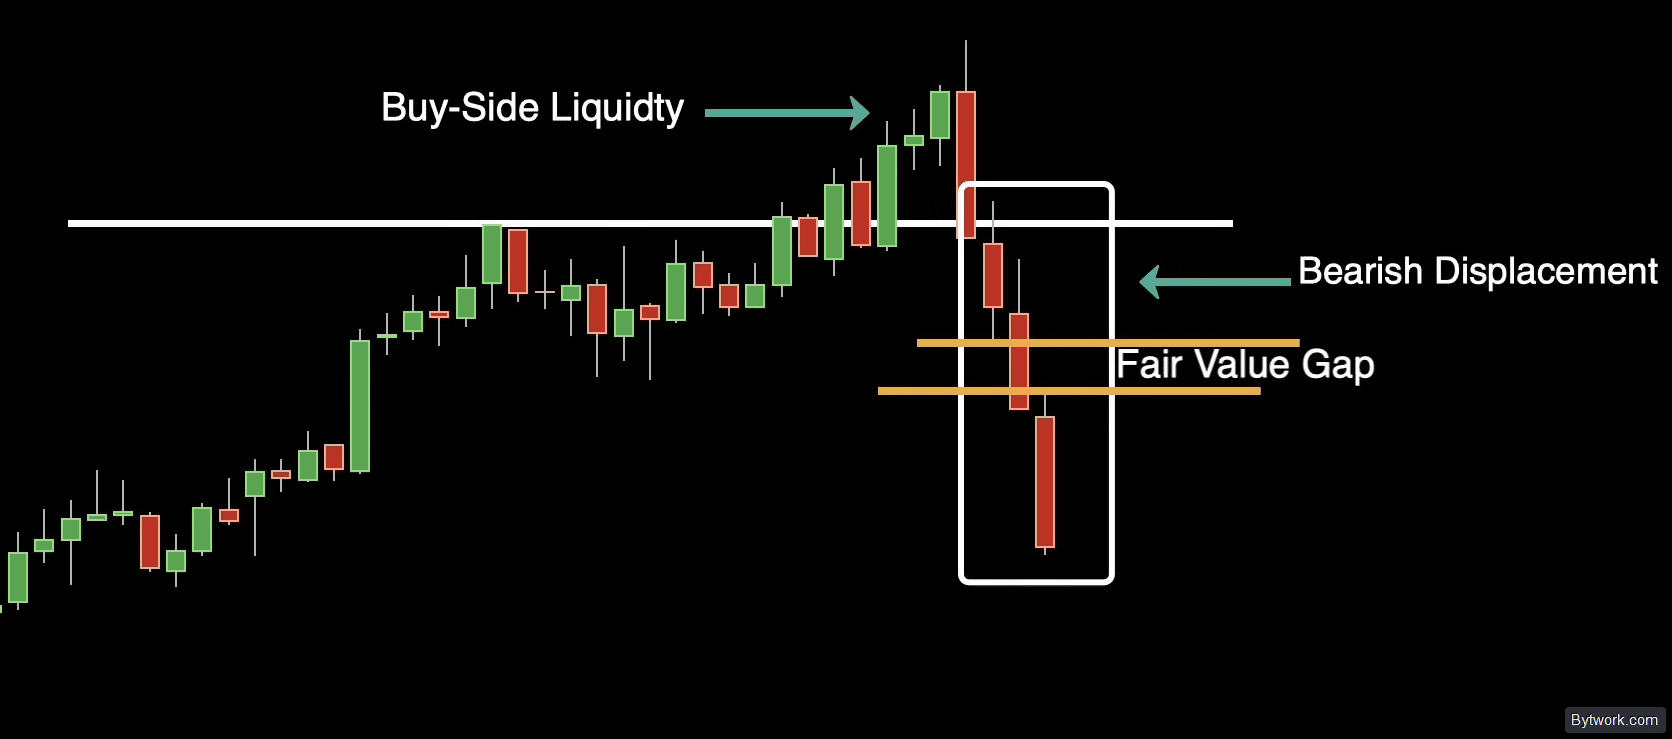
Another example – a bearish impulse that appears after buy-side liquidity is taken. In this case, the market rose to a key resistance. Buyers expected a breakout higher, while sellers opened shorts with stops above resistance. The market briefly broke above resistance, taking out sellers' stops and activating breakout buyers' orders.
Thus, buy-side liquidity above resistance was collected. However, instead of rising, the price sharply reversed, closed below the level, and aggressively moved lower. This reversal is a bearish impulse. To find it, look for 3 bearish candles in a row with large bodies and minimal pullbacks. An imbalance may appear between them, confirming the "smart money" entry.
This impulse vividly demonstrates how market makers collected sellers' stops, lured the crowd into longs, and pushed the price down.
Why is impulse important?
It shows when "smart money" enters the market with large volume and signals the direction of the institutional trend. Understanding impulse is the foundation for combining it with order blocks, breaker blocks, and FVG to find high-probability setups.
Below we will break down these concepts in detail for precise trade entries. By the end of this guide, you will be able to apply ICT professionally.
3. Imbalance (Fair Value Gap, FVG)
The next important concept is Fair Value Gap (FVG), also called imbalance or inefficiency. This is a key notion in "smart money" trading that works on forex, stocks, crypto, and commodities.
FVG is defined by a three-candle formation:
- The middle candle – large, with a wide body, creating a strong impulse.
- The first and third candles – shorter, their wicks do not overlap each other.
The gap between the wick of the first candle and the wick of the third candle is the FVG. It indicates that the market moved too fast for balanced trading.
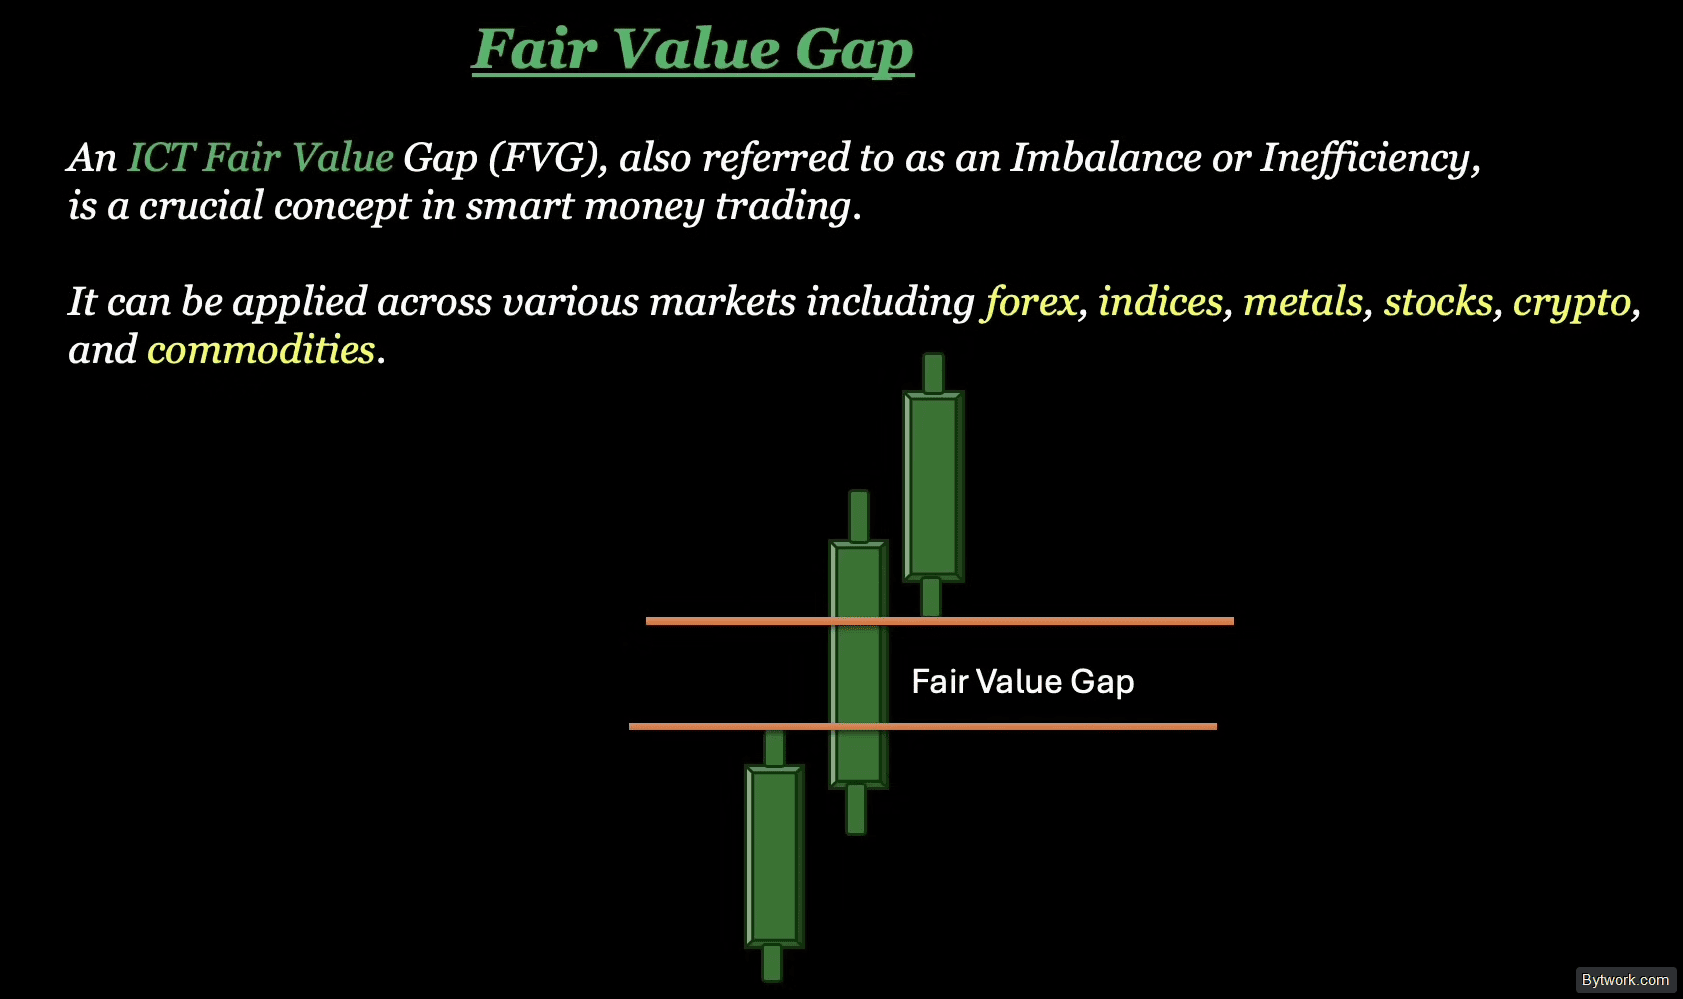
This is an inefficiency zone, confirming institutional intervention.
Characteristics of Bullish and Bearish FVG
Bullish FVG forms in a rising market. The middle candle is a strong bullish one, and the gap appears between the high of the first candle and the low of the third. In a bullish trend, this imbalance acts as support. Price tends to fill the gap before continuing higher.

Assessing such strong bars is more accurate when using Heikin Ashi charts.
Bearish FVG occurs in a falling market. The middle candle is a large bearish one, and the gap lies between the low of the first candle and the high of the third. In a bearish trend, it acts as resistance. Price often returns to fill the gap before further decline.
Steps for Trading FVG
Let us go through simple steps for trading ICT FVG, with the first step being trend identification.
Step 1 – Identify the current trend.
- Bullish – the market forms higher highs and higher lows (HH/HL).
- Bearish – lower highs and lower lows (LH/LL).
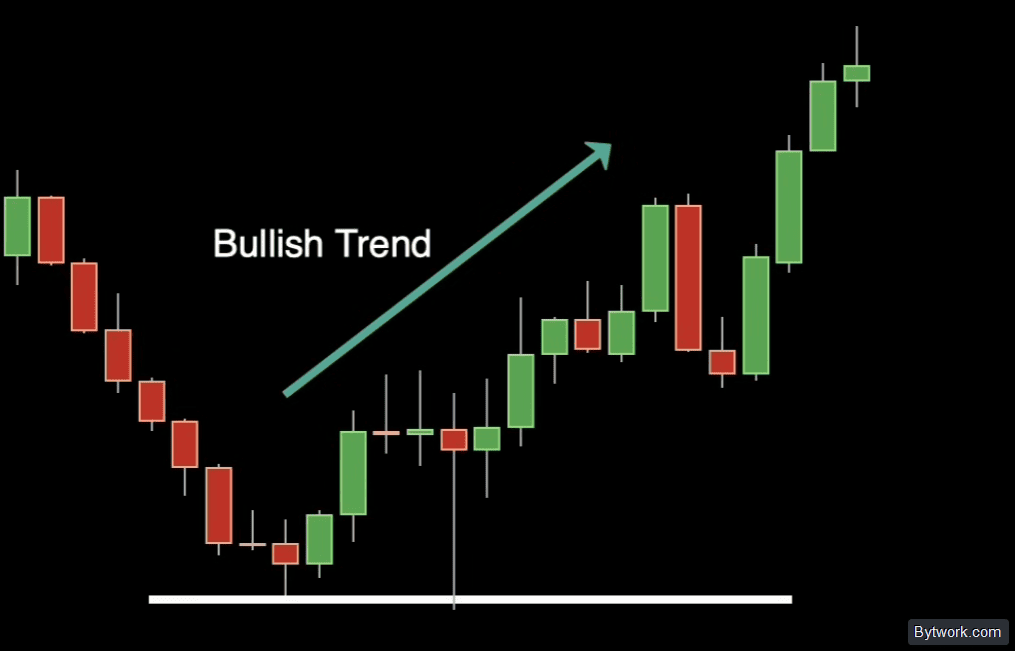
Step 2 – Find a candle with a large body and small wicks in the direction of the trend (bullish for bullish, bearish for bearish).

Step 3 – Check for a valid FVG around that candle:
- The bodies of the preceding and following candles must not overlap the body of the middle candle.
- There must be a gap between the wicks of the outer candles.
- For bullish FVG – high of first candle > low of third.
- For bearish FVG – low of first candle < high of third.
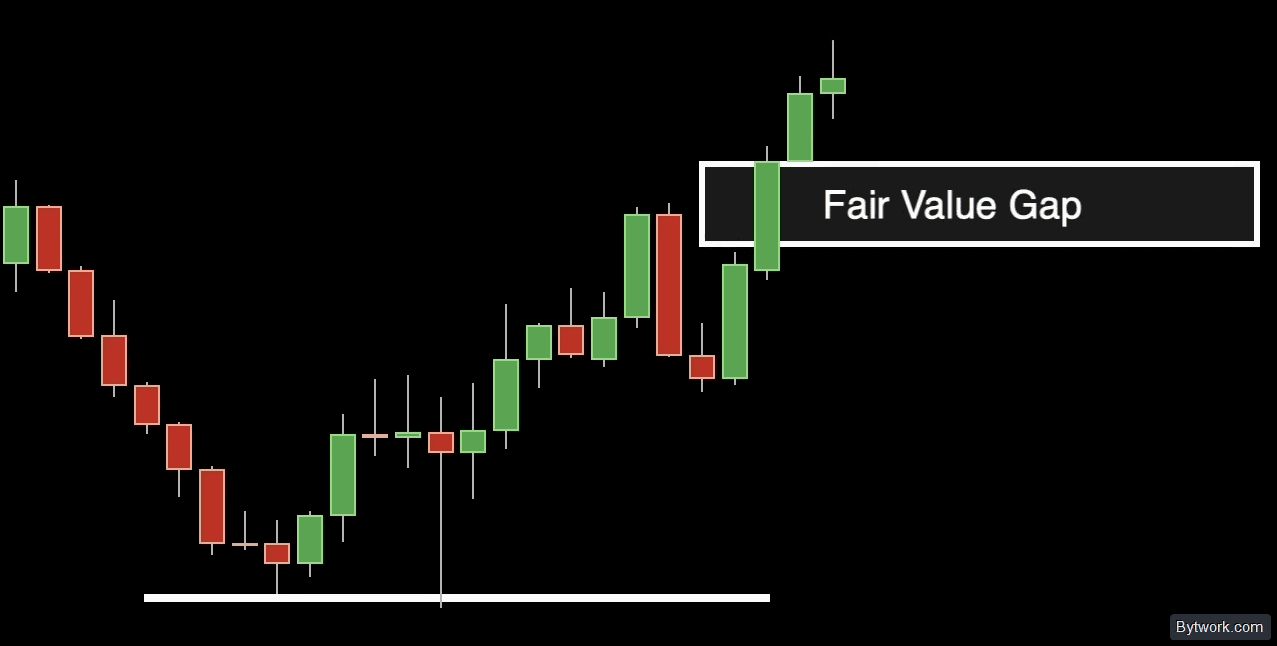
Step 4 – Increase signal reliability – make sure the found FVG coincides with a significant level.
- In a bullish trend – with former resistance that has become support.
- In a bearish trend – with former support that has become resistance.
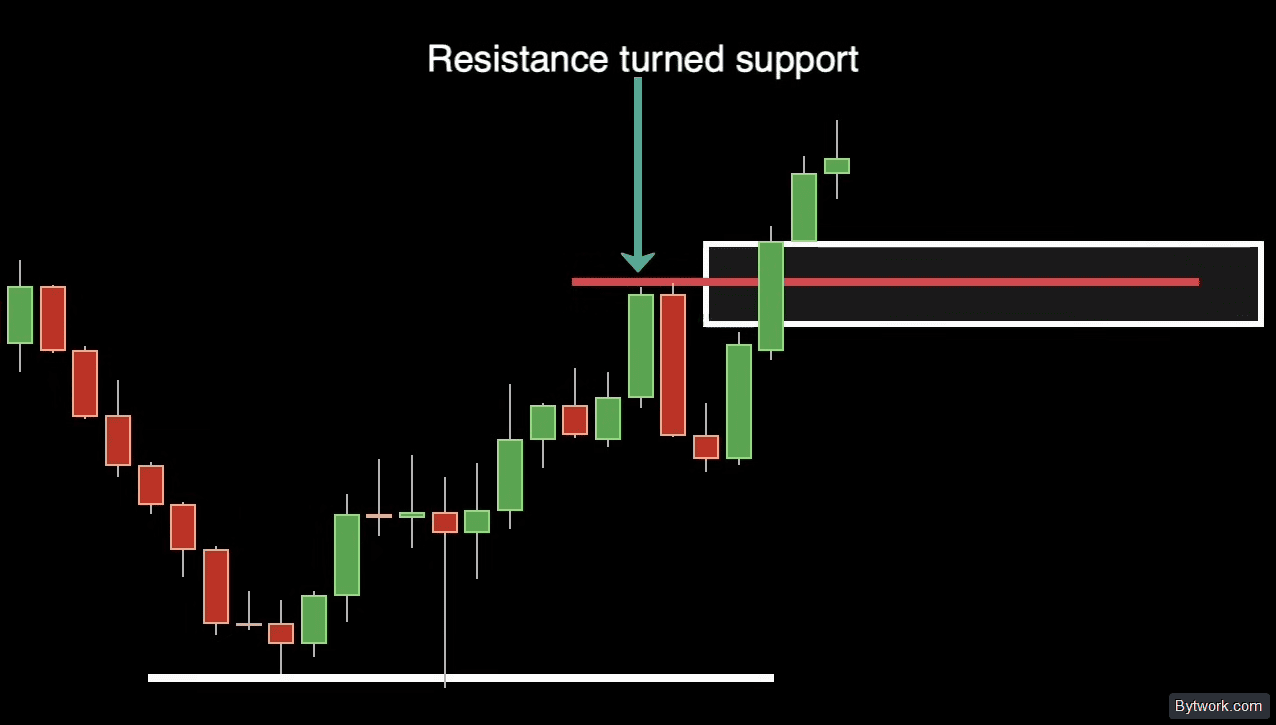
Step 5 – Wait for price to pull back to the FVG zone.
Step 6 – Enter the trade:
- On lower timeframes – look for additional confirmation (bounce, structure shift, pin bar).
- On higher timeframes (e.g., daily) – you can enter directly upon touching the FVG, without extra confirmation.
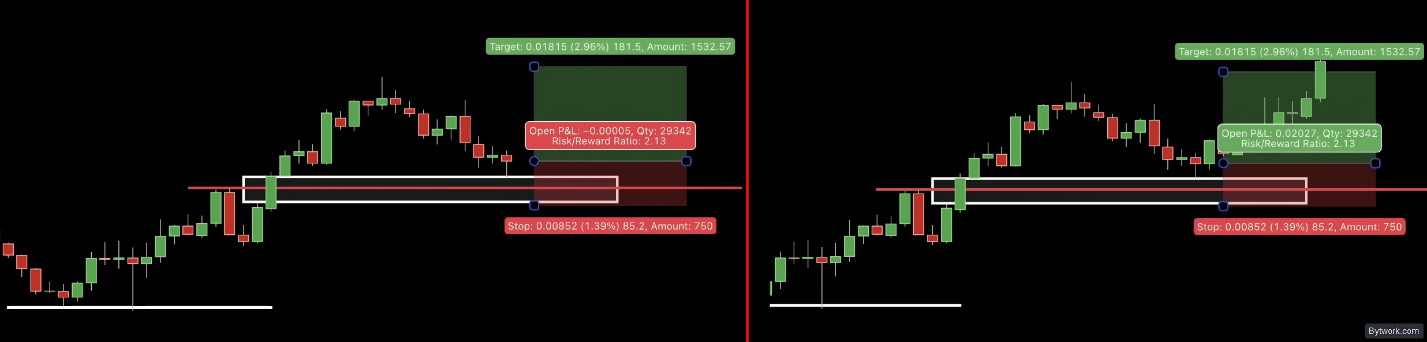
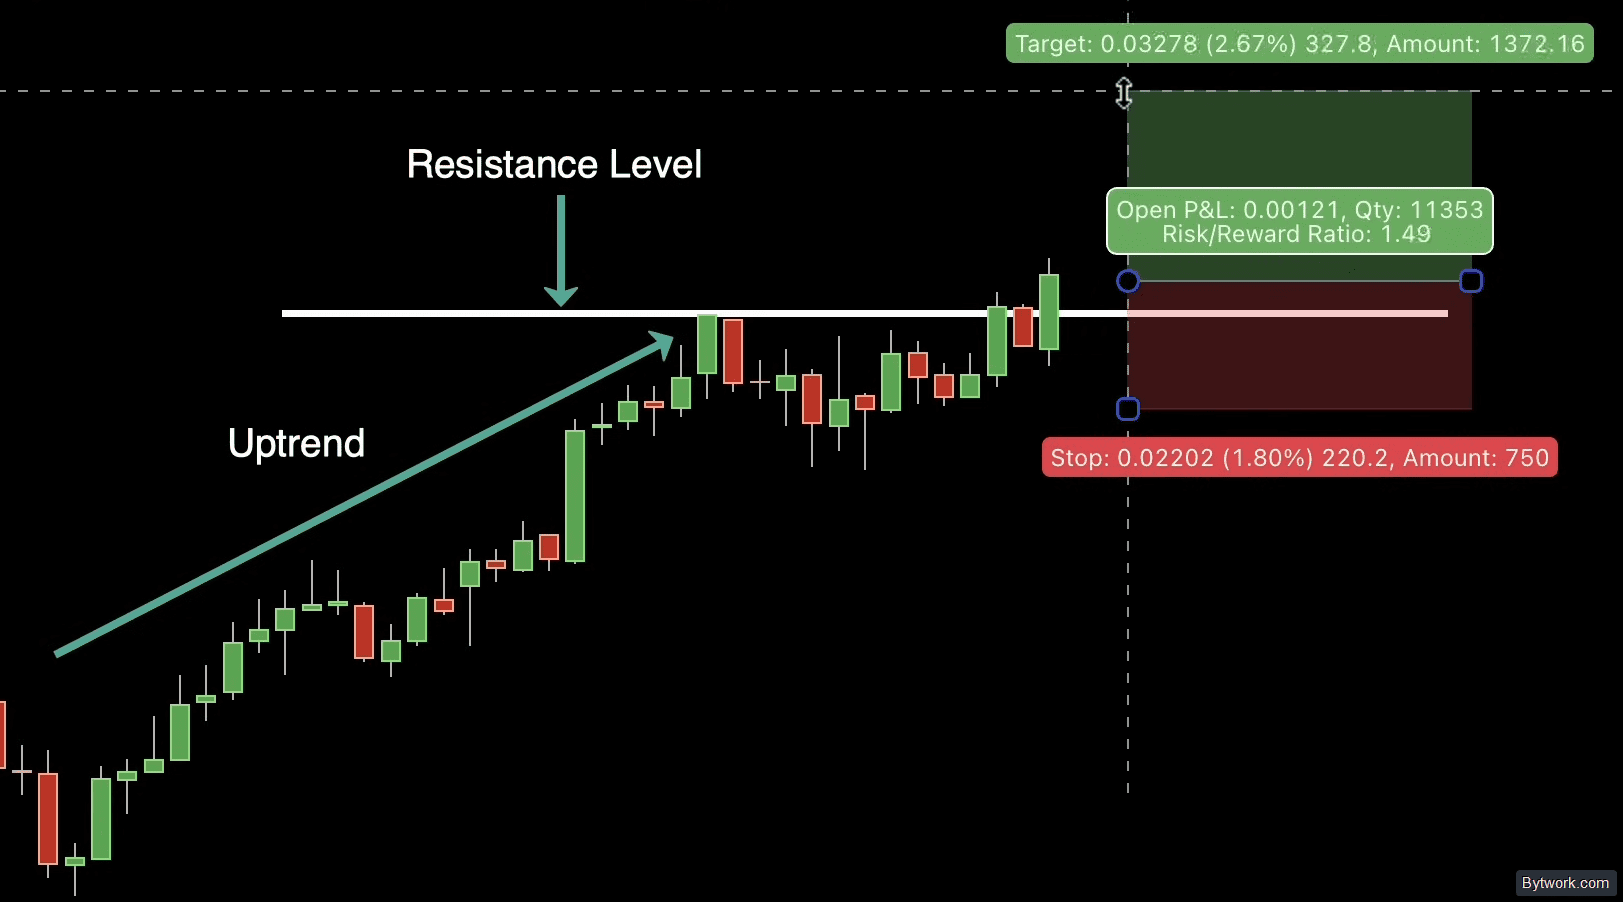
Left – entry from support (Open P&L - -0.00005). Right – price rise confirmed the correct entry (Open P&L - 0.02027).
After a pin bar forms from the FVG, price reverses upward (for bullish) or downward (for bearish) – that is the signal to open a position in the trend direction.
The next important concept is order blocks.
4. Order Blocks
Order blocks are zones on the chart where "smart money" placed large orders. They represent strong supply and demand levels that the market previously rejected sharply.
When price returns to an order block, there is a high probability of a repeat reaction. This provides an excellent opportunity for trade entry.

However, not every demand or supply zone is a true order block. Understanding this distinction is critical to avoid mistakes.
But what defines a valid order block?
Criteria for a Valid Order Block
An order block shows where "smart money" entered the market. For a zone to be reliable, it must meet 3 criteria:

- Inefficiency (FVG). Price must exit the zone with a sharp impulse, leaving an imbalance behind. This proves the strength of institutional orders. The market will return to rebalance.
- Liquidity sweep. Before the impulse, the big player must have collected crowd stops (below support for longs, above resistance for shorts) to fill their position. The candle that swept that liquidity becomes the order block.
- Break of structure (BOS / MSS) – this is the most important condition. The impulse from the order block must break a key high (in a bullish market) or low (in a bearish market). This structural break confirms the market maker's true intentions.
Let us look at a real example of a bullish order block formation.
Example of a Bullish Order Block
In the chart below, the market was trending downward, forming lower highs and lower lows (bearish trend). But at a key support, a sharp reversal occurred. This is the foundation for our bullish order block.
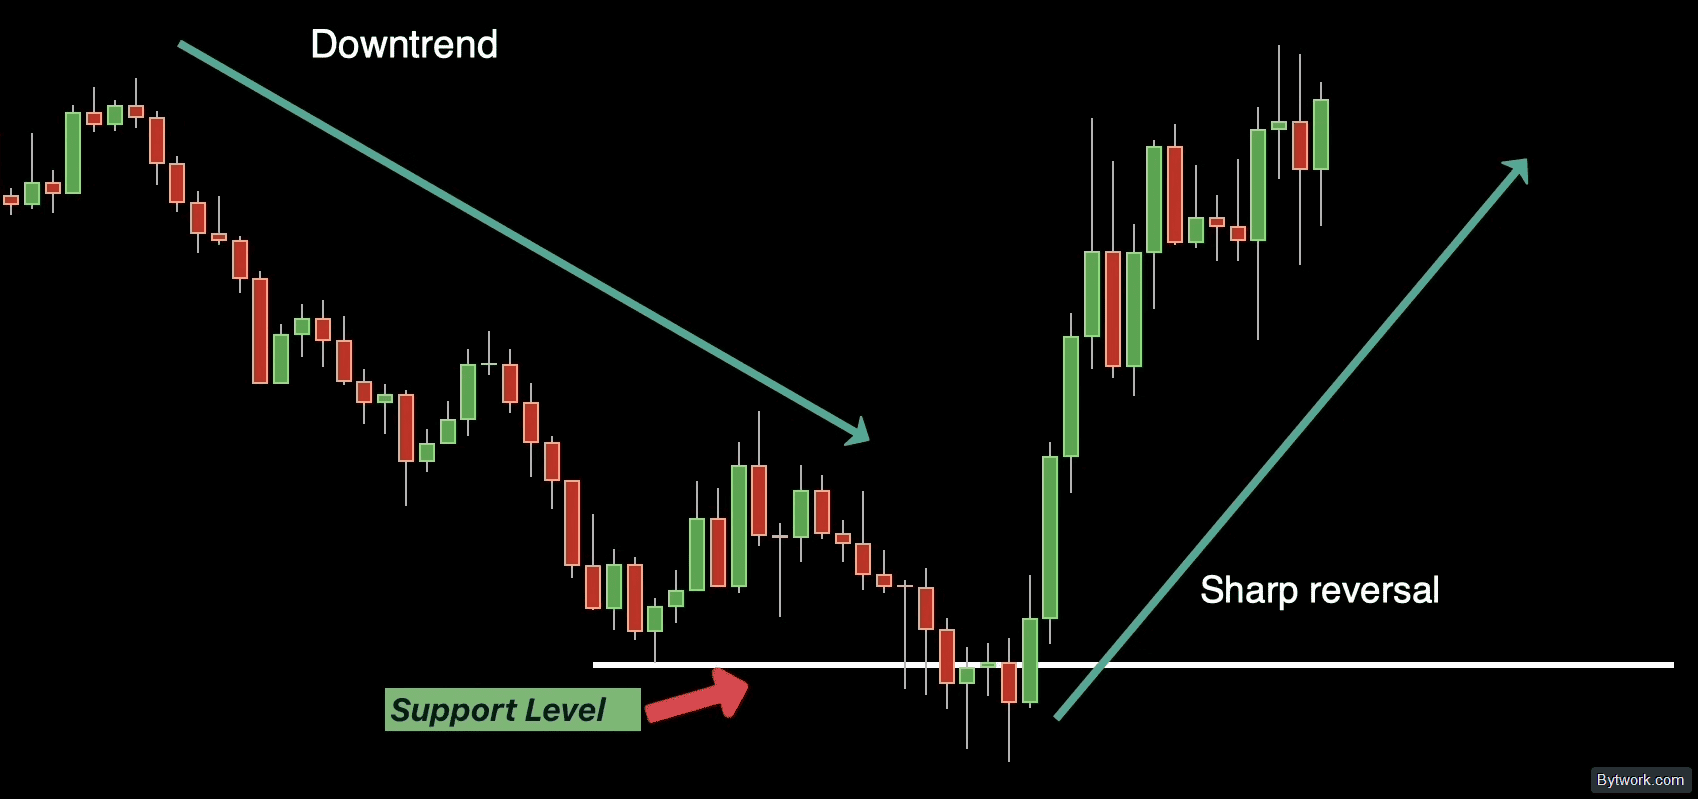
Step 1 – Identify the structure break.
Price reached a significant low, sharply reversed, and broke the previous lower high, forming a higher high. This signals "smart money" intervention and a trend change to bullish.
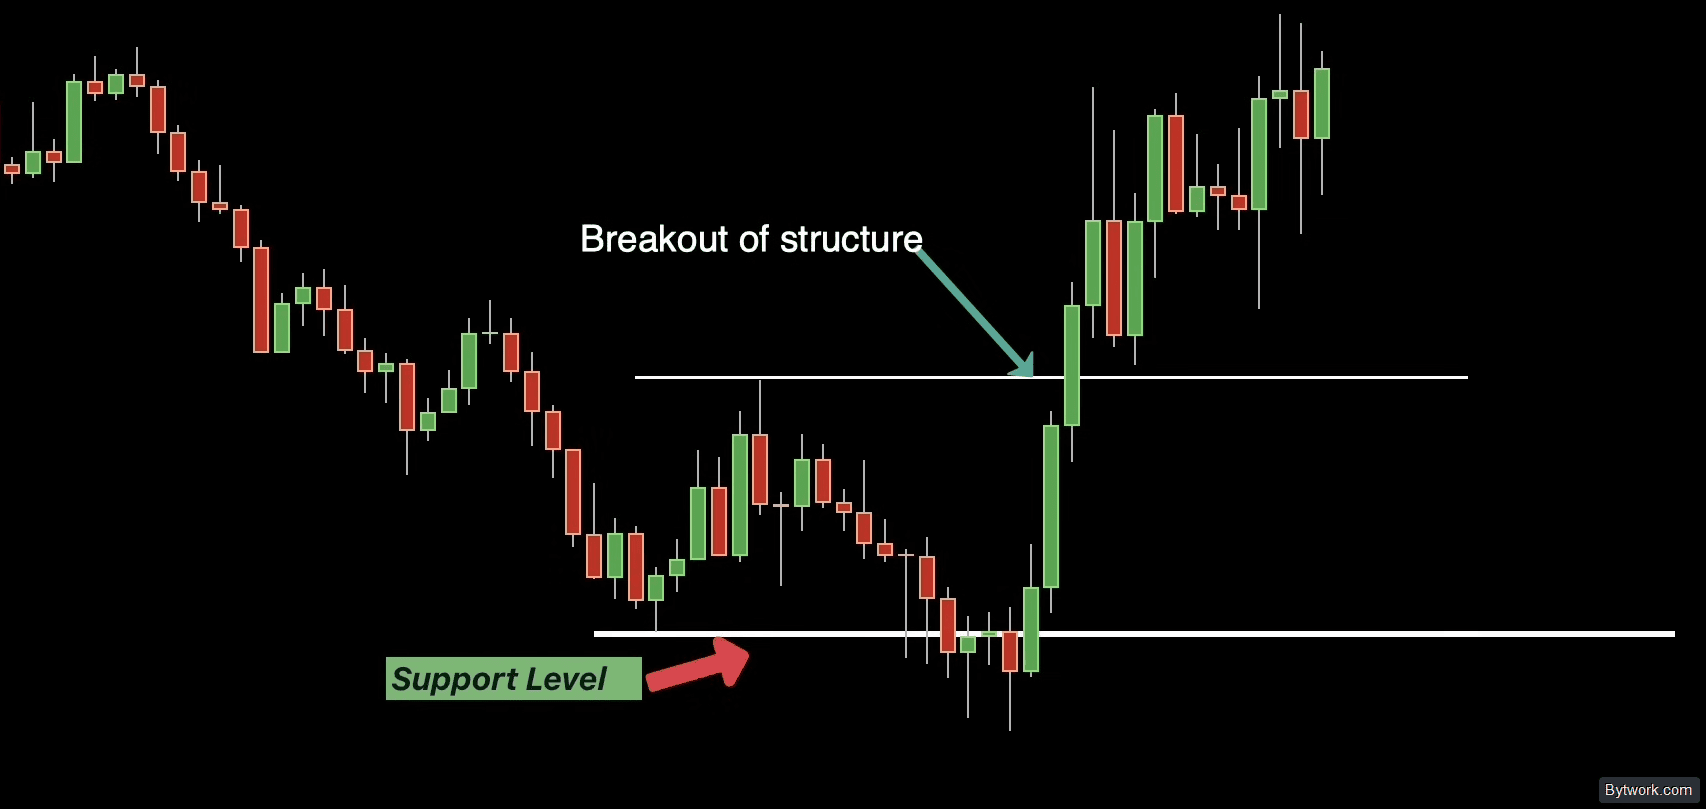
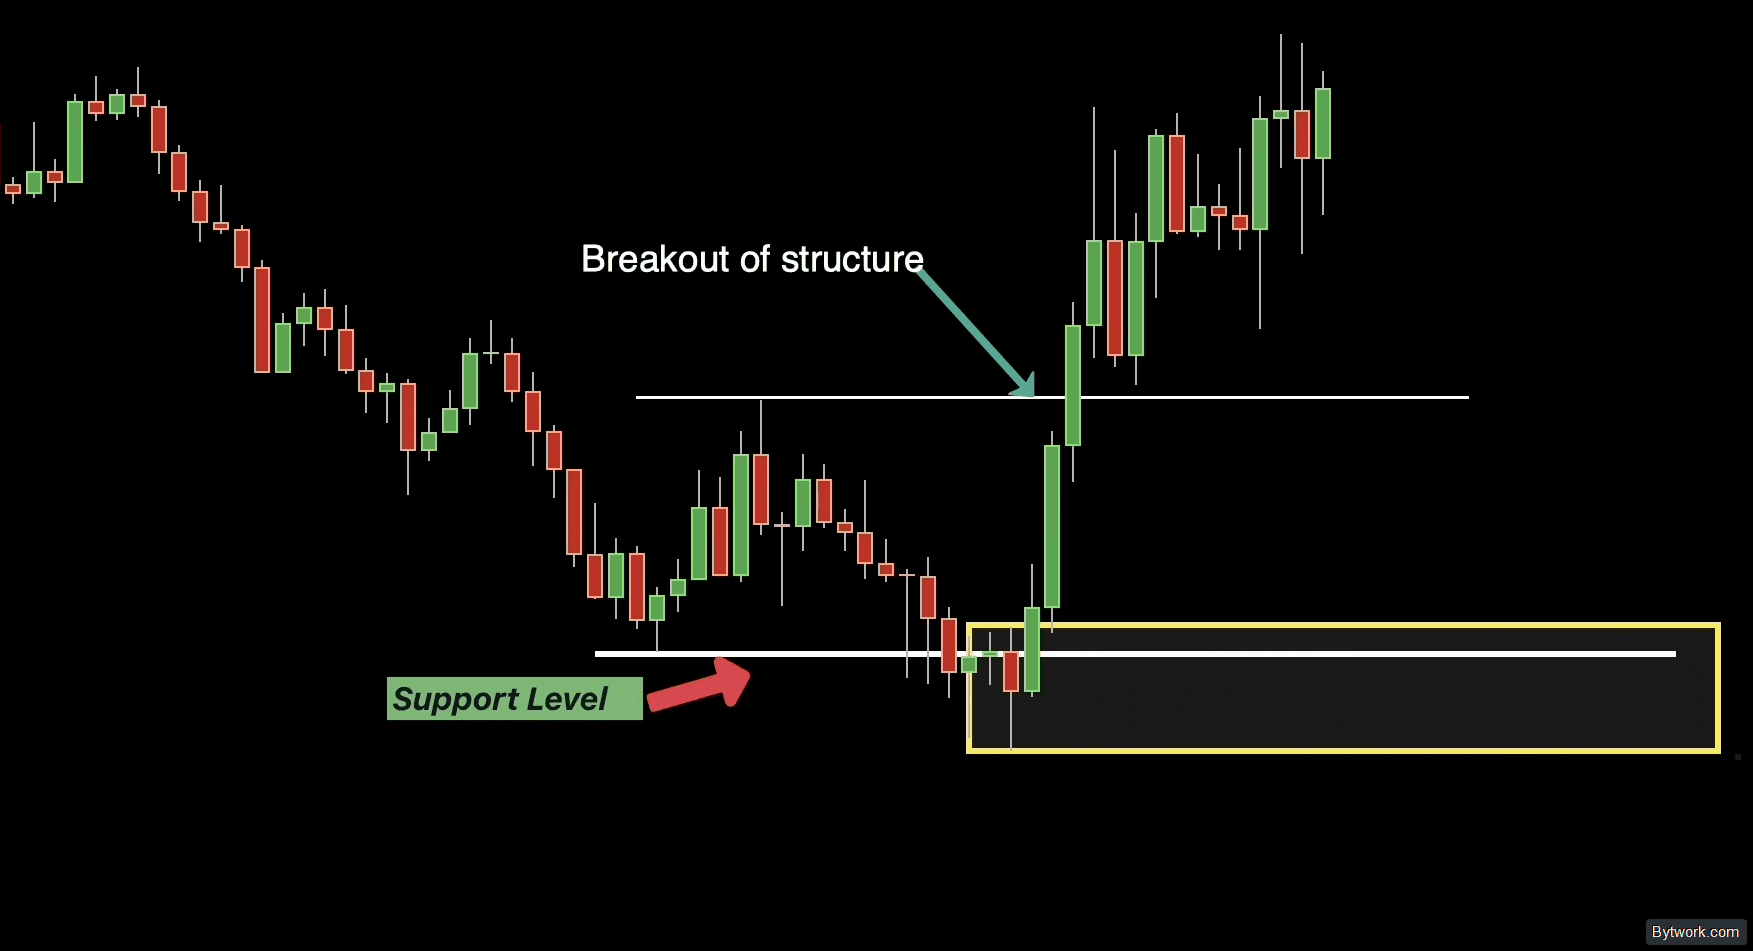
Step 2 – Find the start of the move (order block).
Go back to the beginning of the bullish impulse – this is the zone where "smart money" accumulated long positions. Typically, this is a strong bullish candle at the bottom of the downtrend, just before the reversal.
Step 3 – Check for price imbalance (FVG).
After the strong upward move, there should be a clear FVG. This confirms that aggressive institutional buying left unfilled orders, to which the market may return.
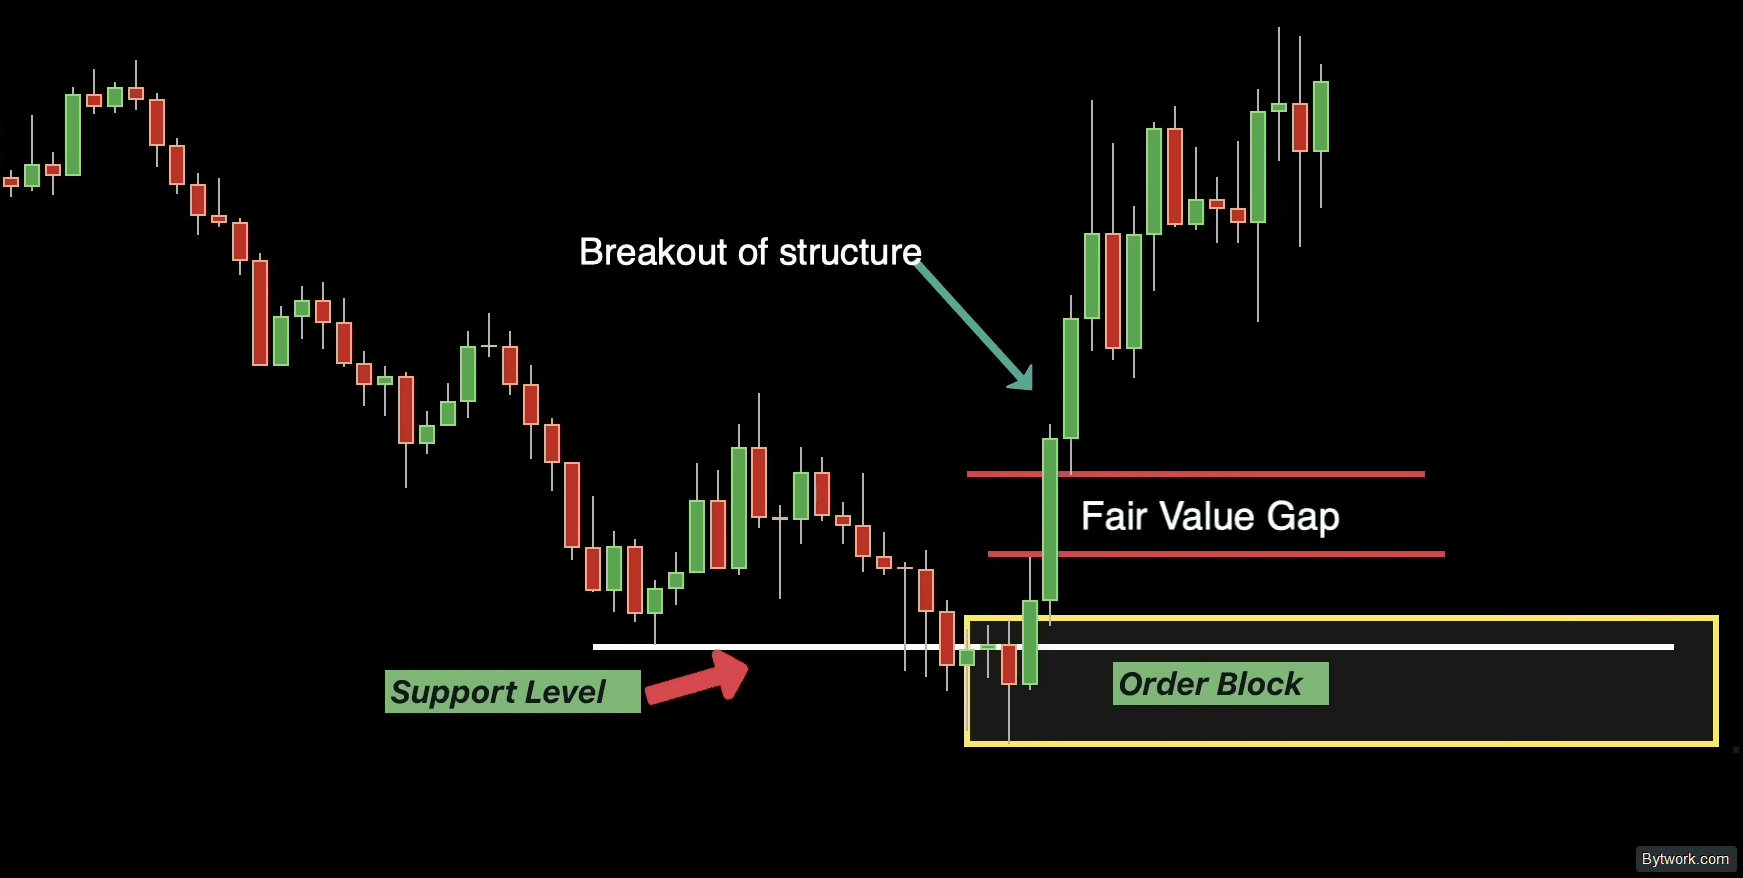
Step 4 – Wait for price to return to the order block.
After the initial thrust, the market pulls back and tests the demand zone in the order block. Wait for this moment for a potential entry.

Step 5 – Look for confirmation and enter.
When testing the order block, look for signals – rejection wicks, structure shift, or bullish candlestick patterns. If the order block holds as support and price starts rising, enter long.
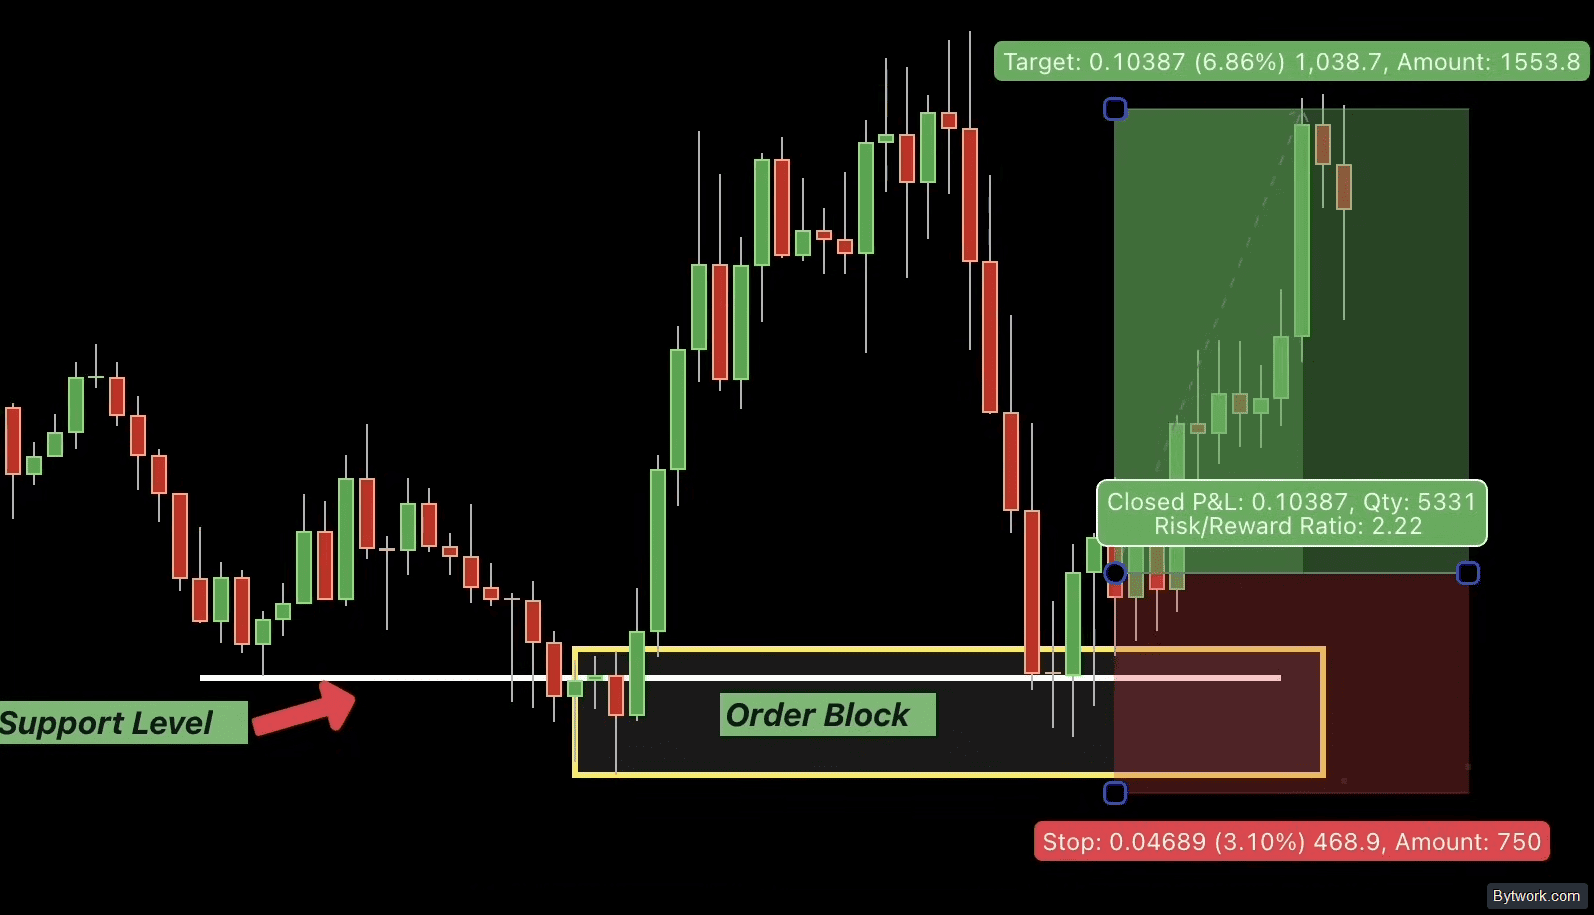
To highlight the bullish order block zone, use the body of the last bearish candle before the impulse (from open to close).
Example of a Bearish Order Block
Now an example of a bearish order block. It works similarly but in the opposite direction. In a bullish trend, the market rose, but at strong resistance it reversed and fell.

Step-by-step algorithm for working with this zone:
- Identify the break of structure (BOS / MSS). Price must break the previous rising low. This confirms a change to a bearish trend and the strength of large sellers.
- Find the start of the move (Order Block). Highlight the last bullish candle at the very peak just before the sharp drop. This is the institutional selling zone.
- Check for imbalance. Ensure the downward impulse left a clear FVG behind. This proves "smart money" aggression.

- Wait for price to return. After the drop, the market will correct upward to test the identified bearish order block.
- Look for confirmation and enter. Upon touching the zone, wait for a market reaction (long upper wicks, patterns, or local structure break on lower timeframe) and open a short trade.
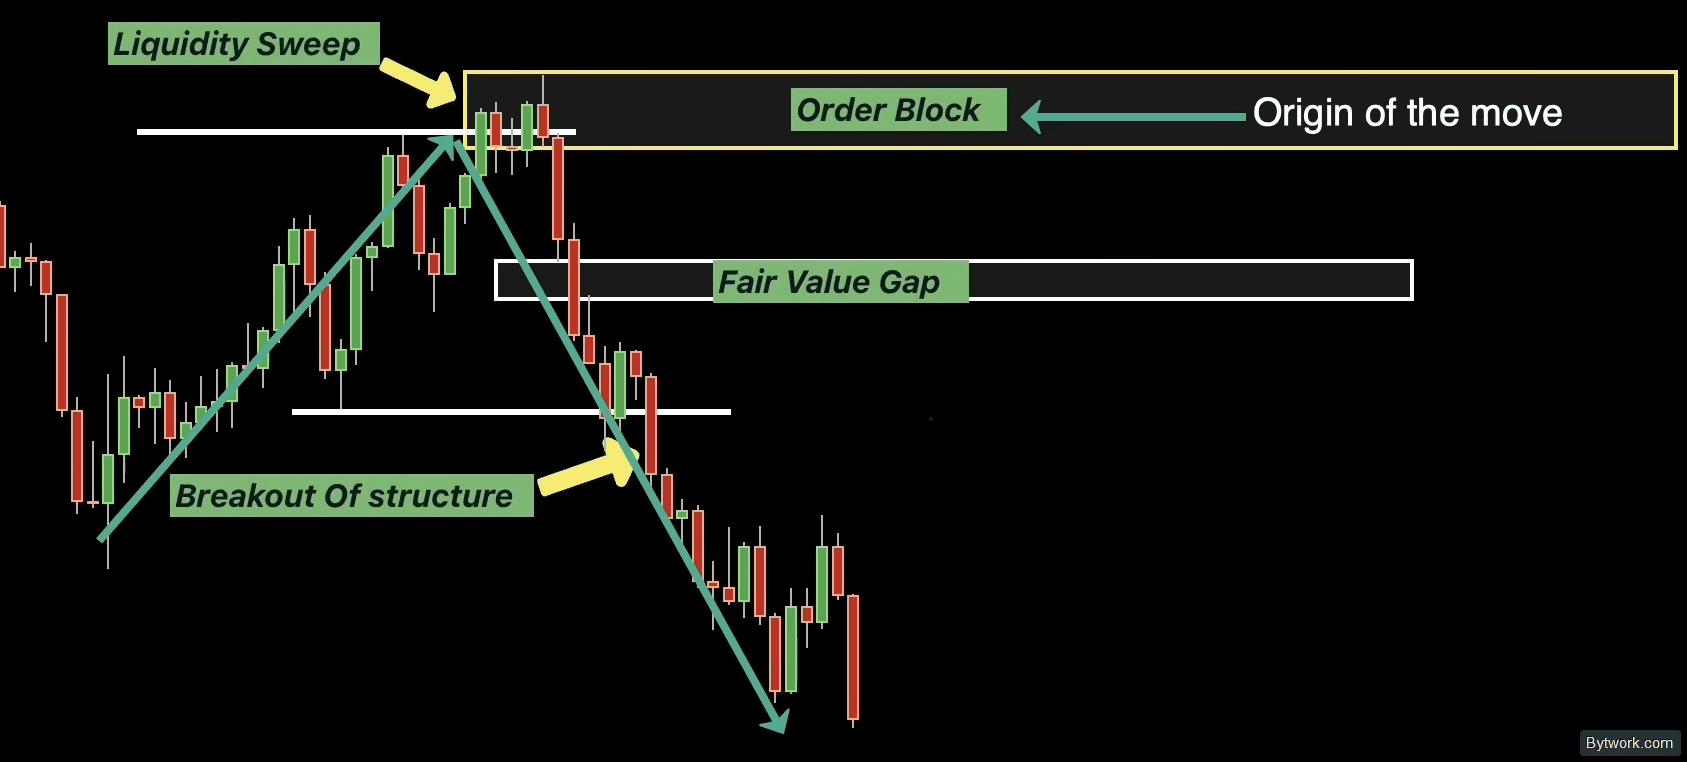
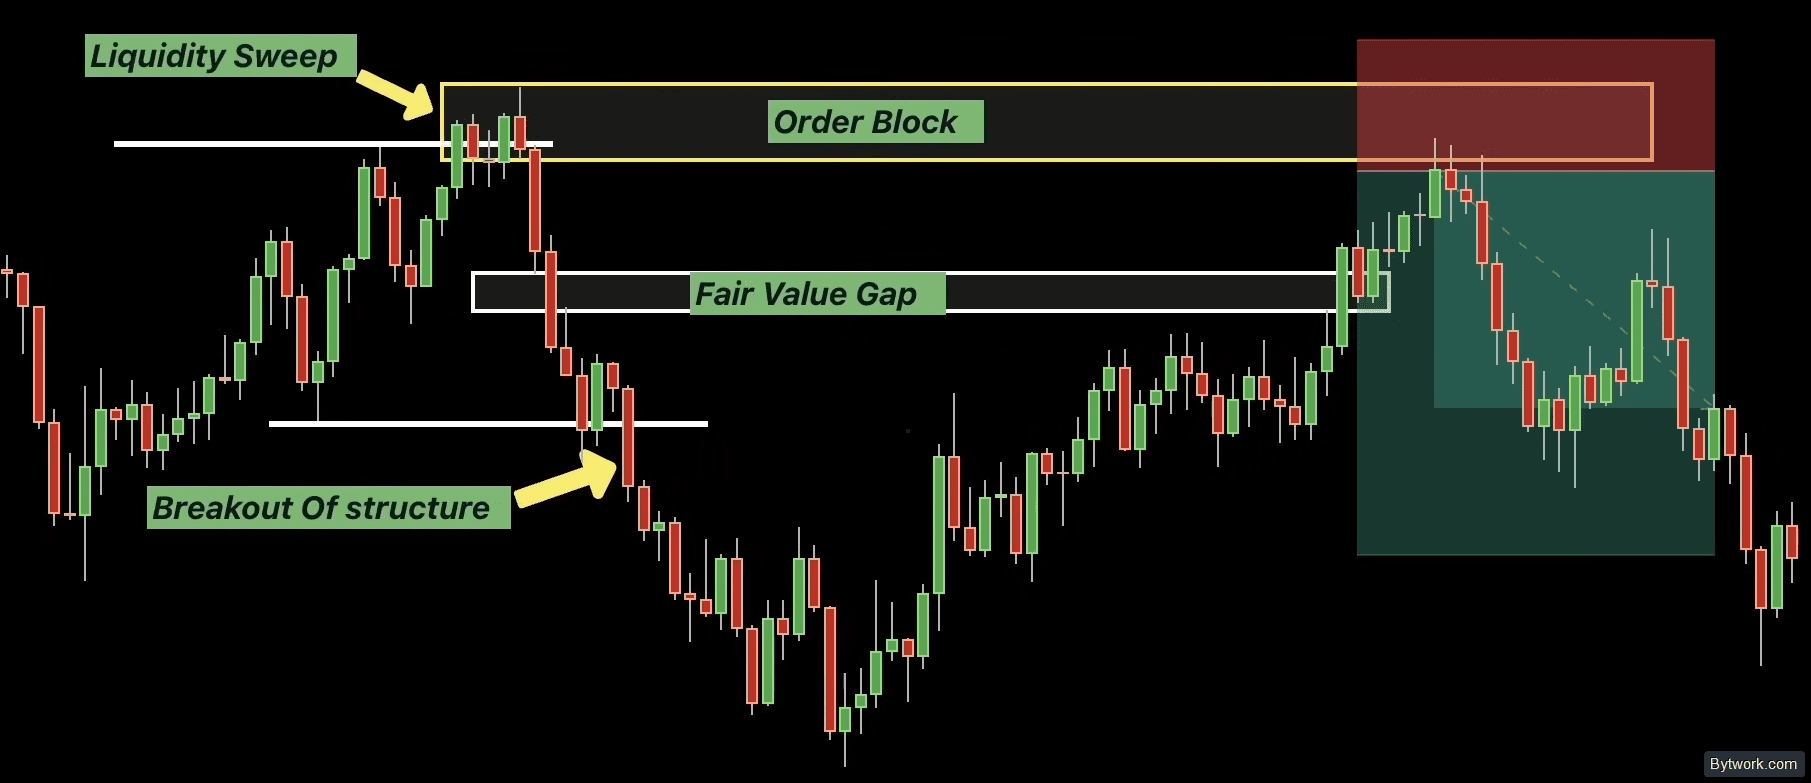
Once price returns to the order block and reacts to it, the zone is considered mitigated. Subsequent touches often have less strength because the big player's orders have ALREADY been filled.
The next concept is the breaker block.
5. Breaker Blocks
A breaker block occurs when a previous order block fails after a liquidity sweep or a market structure shift.
Despite the high effectiveness of ICT concepts, no strategy offers 100% guarantees. Traders using ICT may buy at bullish order blocks and place stops below the low of that block, or sell at bearish order blocks with stops above the high.

However, market makers often exploit these positions by sweeping stop-losses and reversing the market in the opposite direction. This turns the broken order block into a breaker block.
Bullish Breaker Block
A bullish breaker block occurs when a bearish order block fails. When price closes above its high (after a liquidity sweep and structure break), the former resistance turns into support.
Criteria for a valid bullish breaker block:
- Presence of a clear bearish order block.
- Evidence of a liquidity sweep and subsequent structure break.
- A confident close above the high of that block.
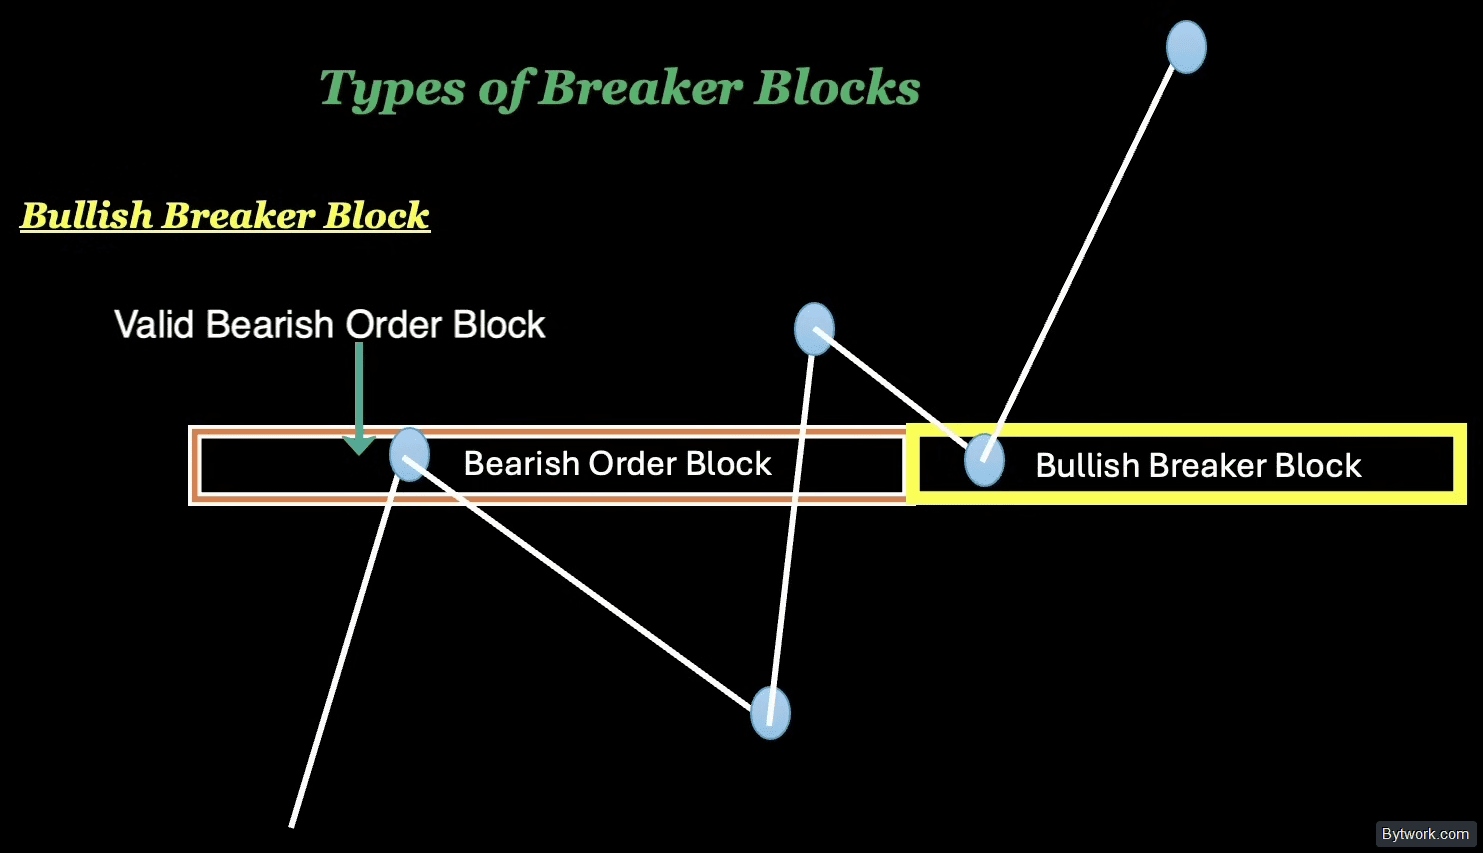
Although all candles before the peak that swept liquidity can be considered part of the breaker, the last bullish candle is the most important.
Bearish Breaker Block
A bearish breaker block is a failed bullish order block. When price closes below the low of a bullish order block, that previously bullish block becomes resistance – a bearish breaker block.

To confirm a valid bearish breaker block, check for: a valid bullish order block, price closing below its low, a liquidity sweep, and a structure shift.
Let us consider a trading strategy on a bullish breaker block.
Bullish Breaker Block Trading Strategy
It is preferable to trade with the trend, as the trend is your friend. Step-by-step algorithm:
- Trap formation. In a rising market, price temporarily falls, creating a bearish order block and attracting sellers.
- Break of the zone. Instead of falling, the market sharply reverses, sweeps the stops of those sellers, and closes above the high of the bearish order block. The broken zone becomes a bullish breaker.
- Pullback and test. Wait for price to return to the breaker block to test the new support zone.
- Look for confirmation. On lower timeframes, look for a reaction (bounce or local structure break). If you trade on the daily chart, you can enter directly without lower timeframes – the higher timeframe itself is reliable.
- Entry and stop-loss. Open a buy, and place your stop-loss 10–20 pips below the low of the breaker block to protect against a deep test.

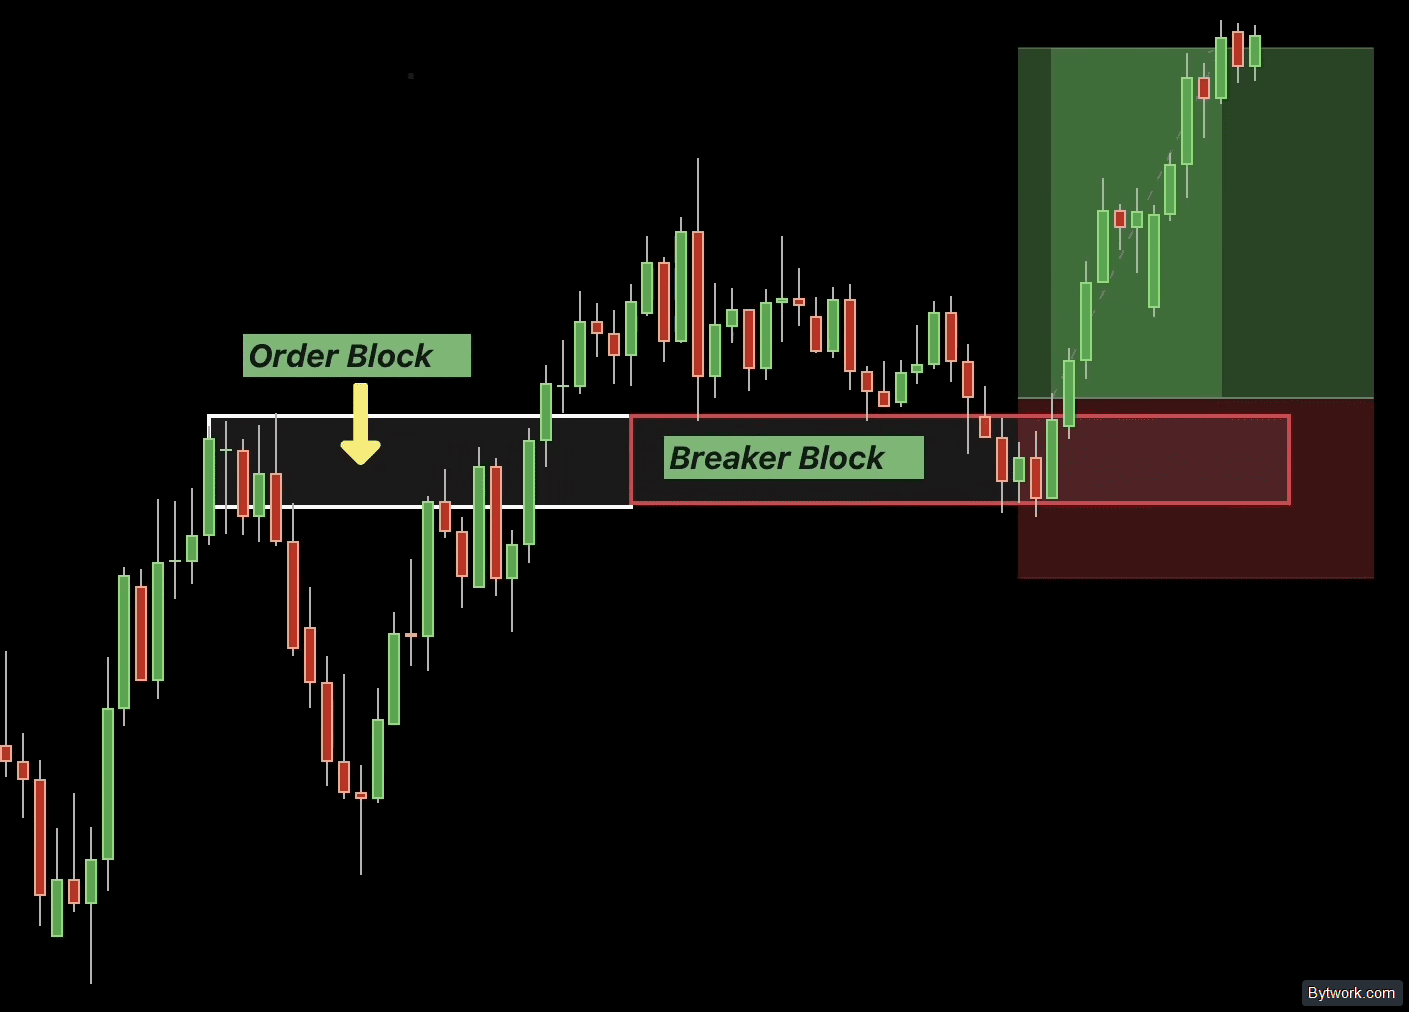
A breaker block is considered high-probability if the impulse that broke it left a price imbalance behind. Such a combination in the ICT methodology is called the Unicorn pattern.
Bearish Breaker Block Strategy
Look for bearish breaker blocks strictly in a bearish trend. Step-by-step algorithm:
- Trap formation. In a falling market, price temporarily rises, creating a bullish order block and attracting buyers.
- Break of the zone. Instead of rising, the market sharply reverses, sweeps buyers' stops, and closes below the low of the bullish order block. The broken zone becomes a bearish breaker.
- Pullback and test. Wait for price to return upward to the breaker block to test the new resistance zone.
- Look for confirmation. On lower timeframes, look for a reaction (bounce or local structure break). When trading on the daily chart, you can enter directly without lower periods.
- Entry and stop-loss. Open a sell, and place your stop-loss 10–20 pips above the high of the breaker block to protect against a deep test.
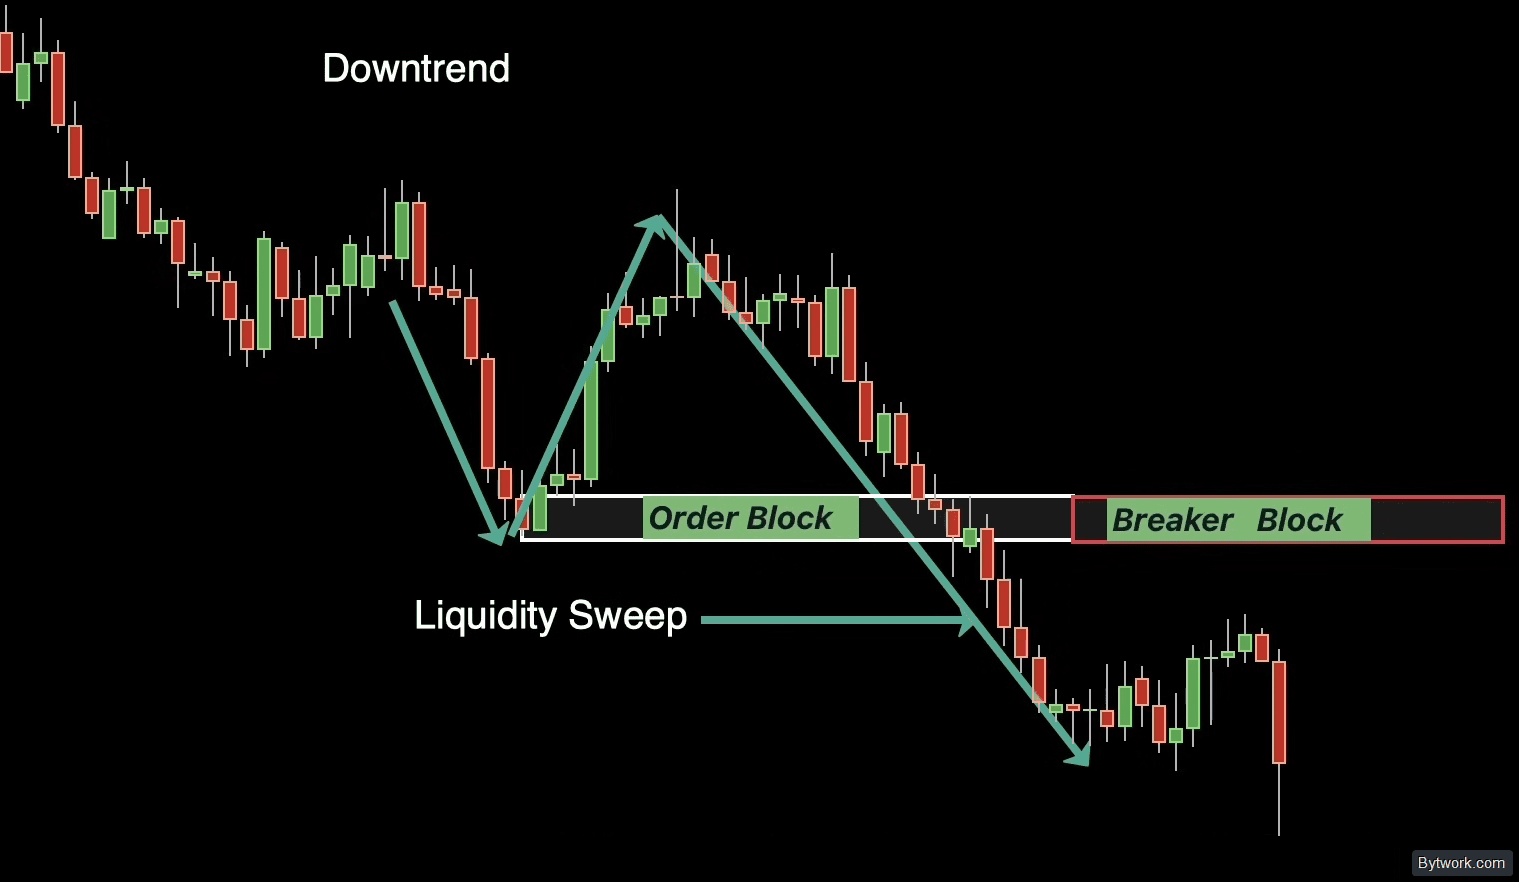
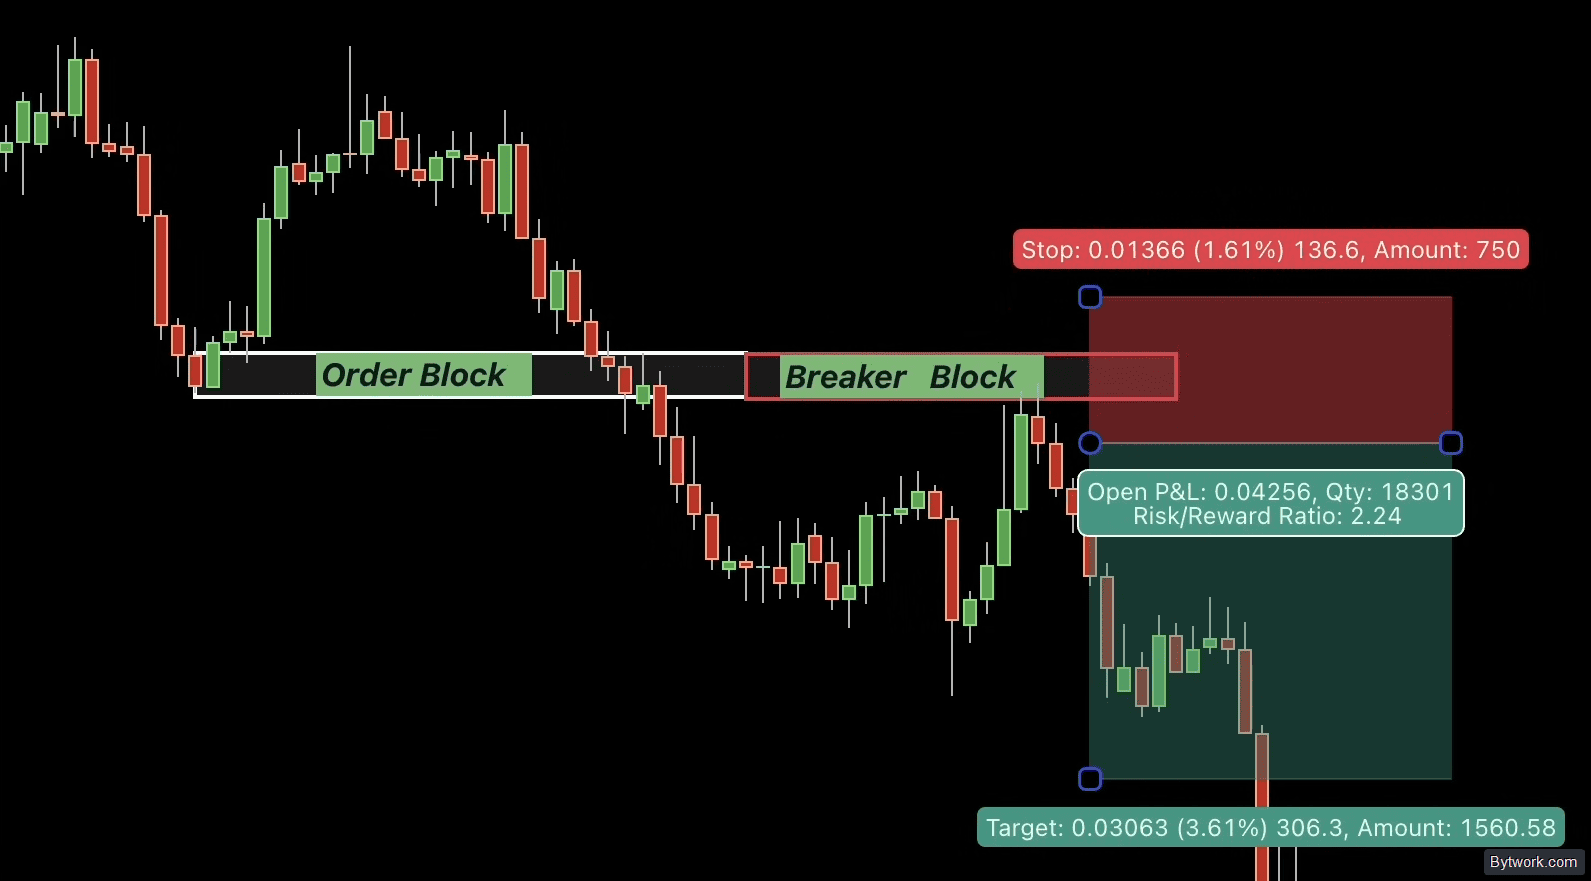
The logic behind the entry is that market makers who bought in this zone for manipulation are now "underwater" and will close their buys at break-even when price returns, pushing it lower.
Moving on to the sixth ICT concept – MSS.
6. Market Structure Shift
A Market Structure Shift (MSS) in the ICT concept means a trend break. Usually, price moves structurally, updating highs in a bullish market and lows in a bearish one. Violation of this pattern and a change in the direction of market movement lead to an MSS.
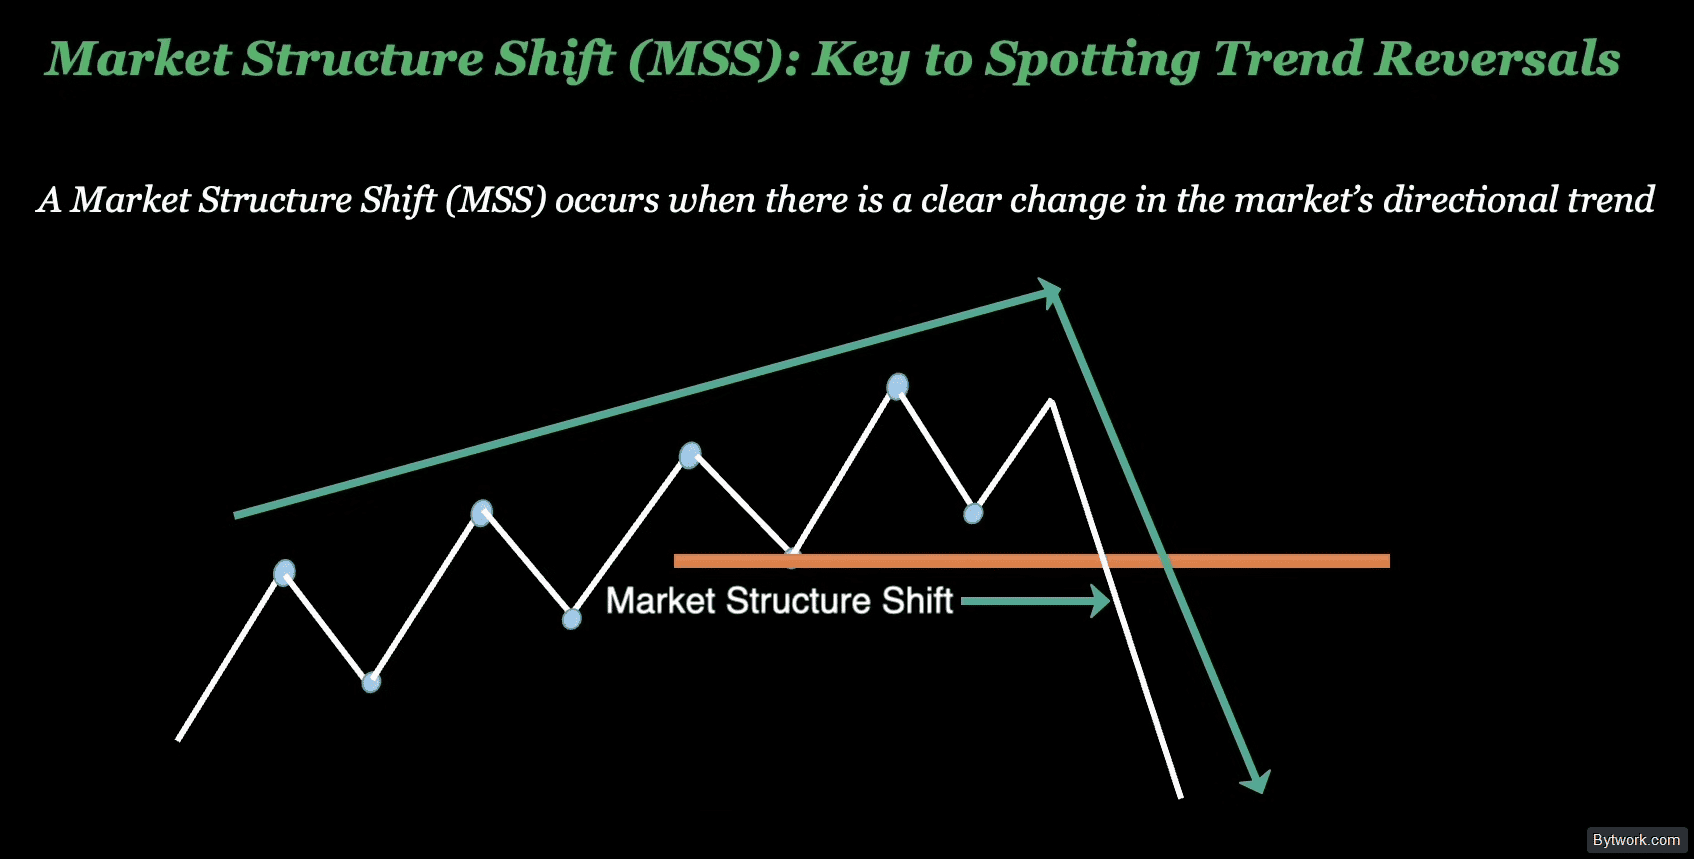
Structure shifts are vital – they mark points where "smart money" reverses the trend, trapping the crowd. Early recognition of the break helps the trader enter in the direction of the institutional move.
Bullish MSS
A bullish MSS (structure break) occurs when transitioning from a bearish to a bullish trend. In a falling market, price forms lower highs and lower lows. A bullish break occurs when price moves up with strong impulse and breaks the last key high (the one that made the previous low).
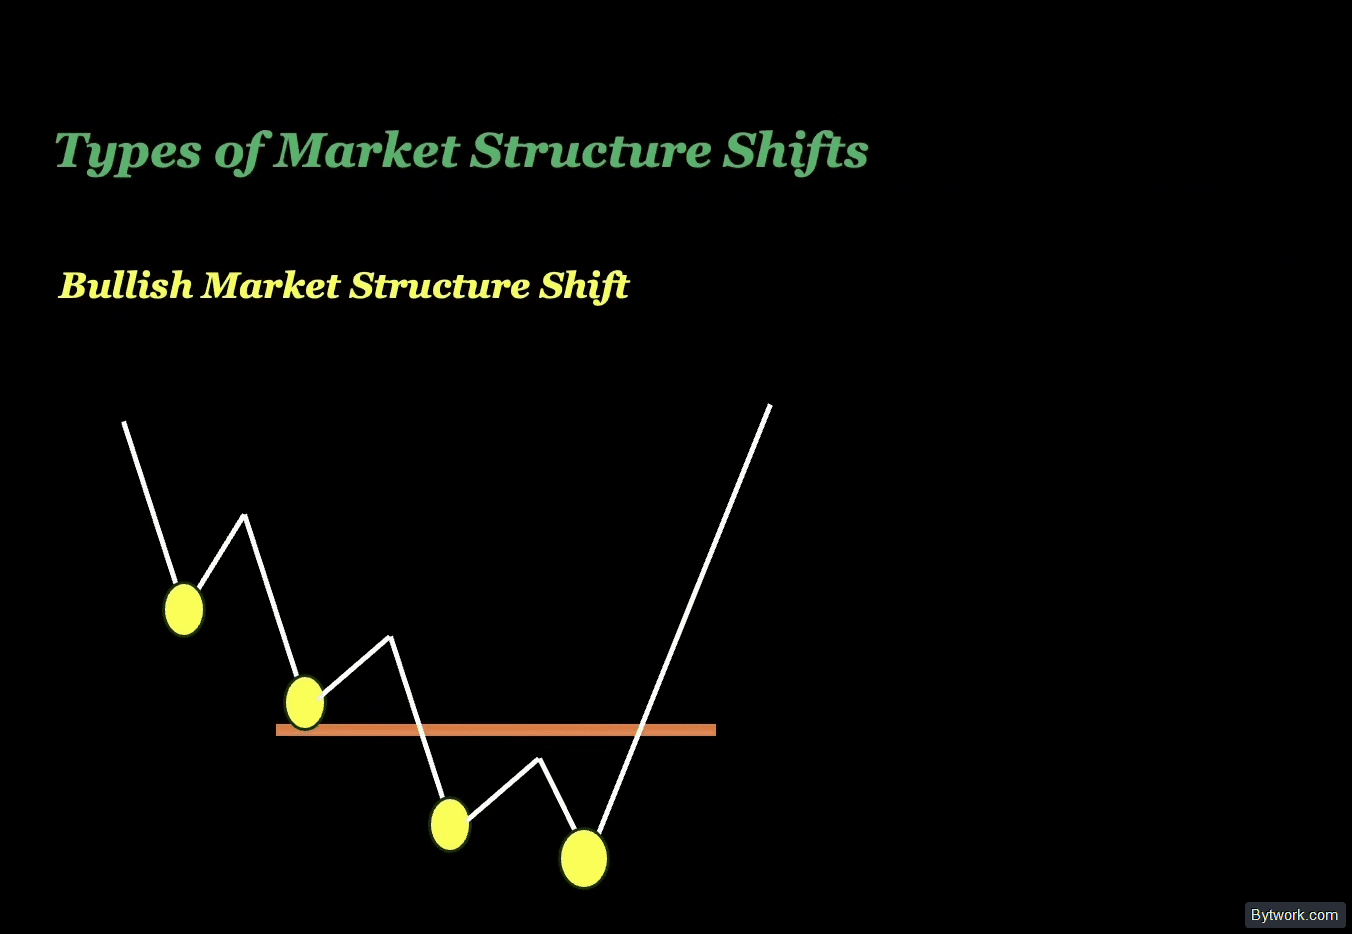
Breaking that peak signals the end of the bearish trend and a reversal upward.
Bearish MSS
A bearish MSS (structure break) occurs when transitioning from a bullish to a bearish trend. In a rising market, price forms higher highs and higher lows. A bearish break occurs when price moves down with strong impulse and breaks the last key low (the one that made the previous high).

Breaking that low signals the end of the bullish trend and a reversal downward.
Structure shifts often occur at the end of impulses or corrections. To more precisely determine the nature of MSS and the current phase of the market cycle, Elliott Wave Theory can be helpful.
Trading a Bullish MSS
Now, how to trade a bullish MSS in ICT. When the market shifts from bearish to bullish, the goal is to catch the reversal, using impulse, FVG, and order blocks to optimise entry.
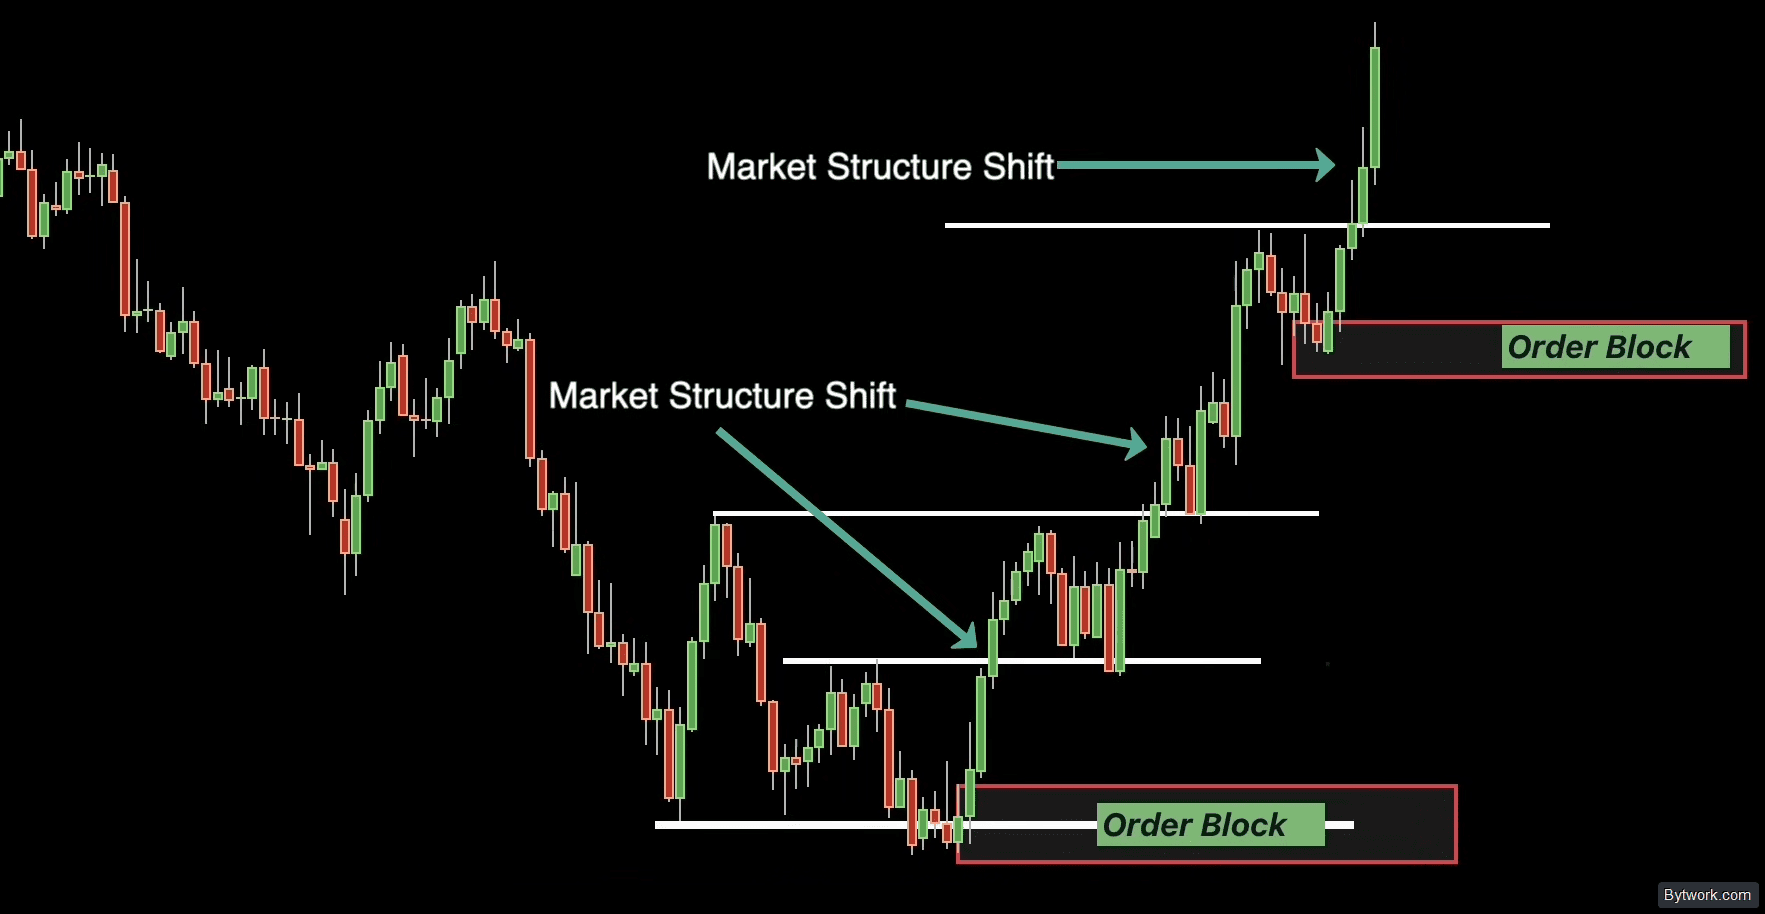
Step-by-step process for trading a bullish MSS:
- Identify the shift – when price breaks the previous lower high with displacement, the structure has turned bullish.
- Wait for a retest – when the market pulls back to the order block, look for confirmation that price respects these levels.
- Enter long – upon confirmation, open a long position. Place your stop-loss 10–20 pips below the order block zone, with a 1:2 risk-to-reward target.

For MSS, it is critical that the candle closes with its body above the structural high. A mere wick touch is not enough – that could be a false signal.
Trading a Bearish MSS
For a bearish MSS, when the market shifts from bullish to bearish, the goal is to capitalise on the downtrend.
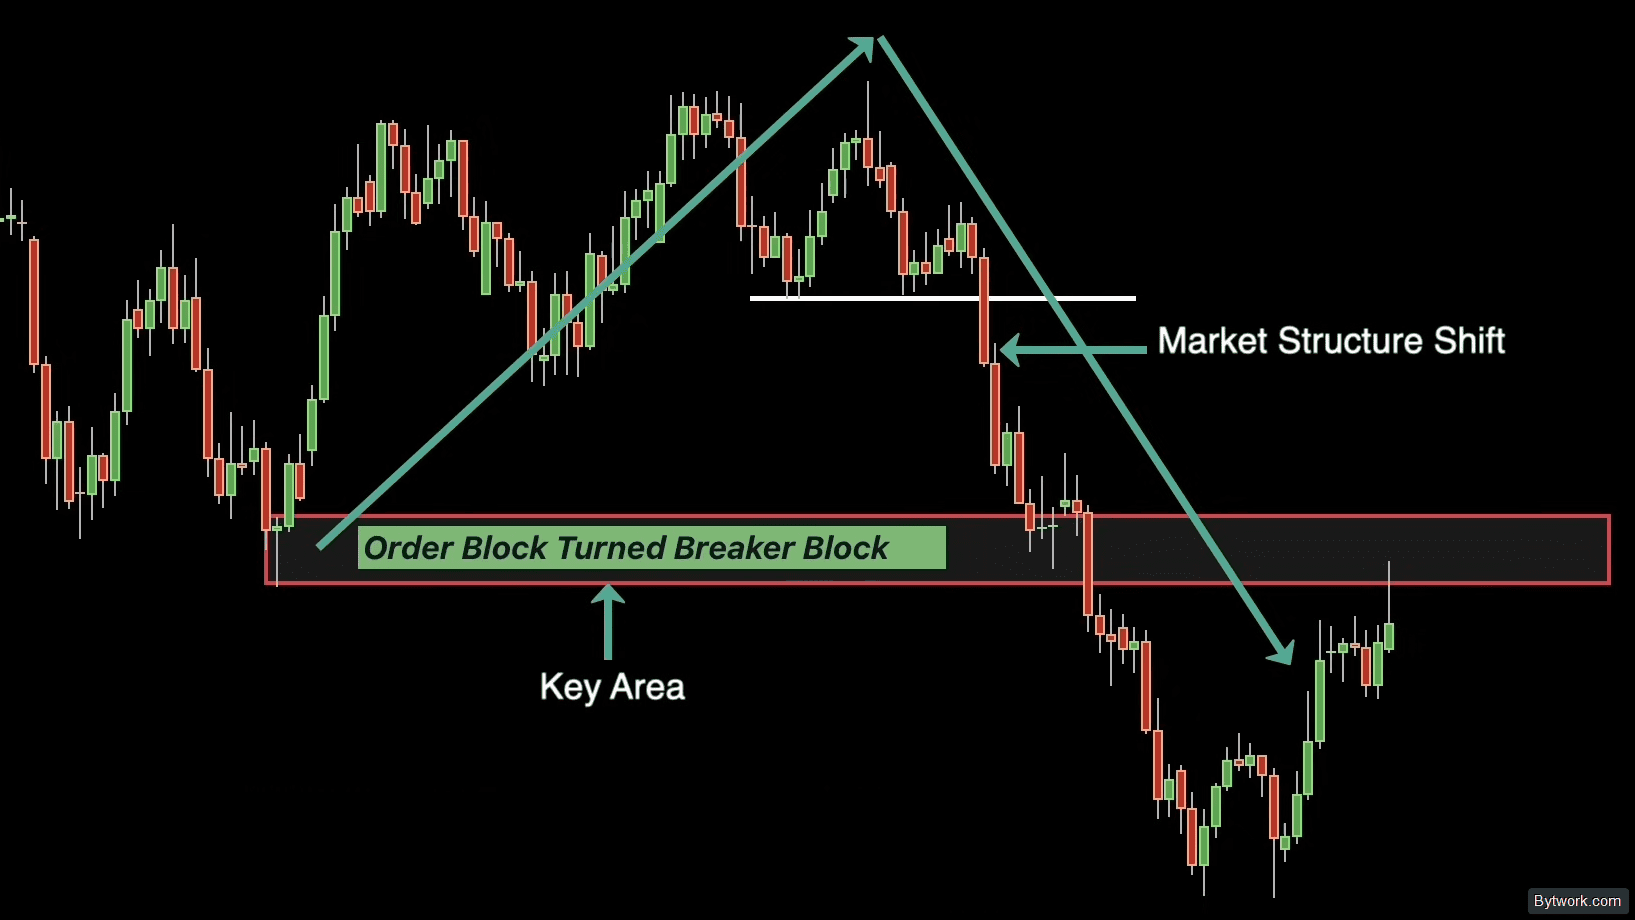
Step-by-step:
- Identify the shift – when price breaks the previous higher low with impulse, the structure has become bearish.
- Mark key zones – find FVG, order blocks, or breaker blocks that could become retest areas before further decline. In the example, a breaker block is found that serves as a potential retest zone, confirming the likelihood of continued bearish trend.
- Wait for a retest – let price pull back up to the breaker block and look for signs of rejection or confirmation that these areas act as resistance.
- Enter short – upon confirmation, open a short position. Place your stop-loss 10–20 pips above the breaker block, with a 1:2 risk-to-reward target.
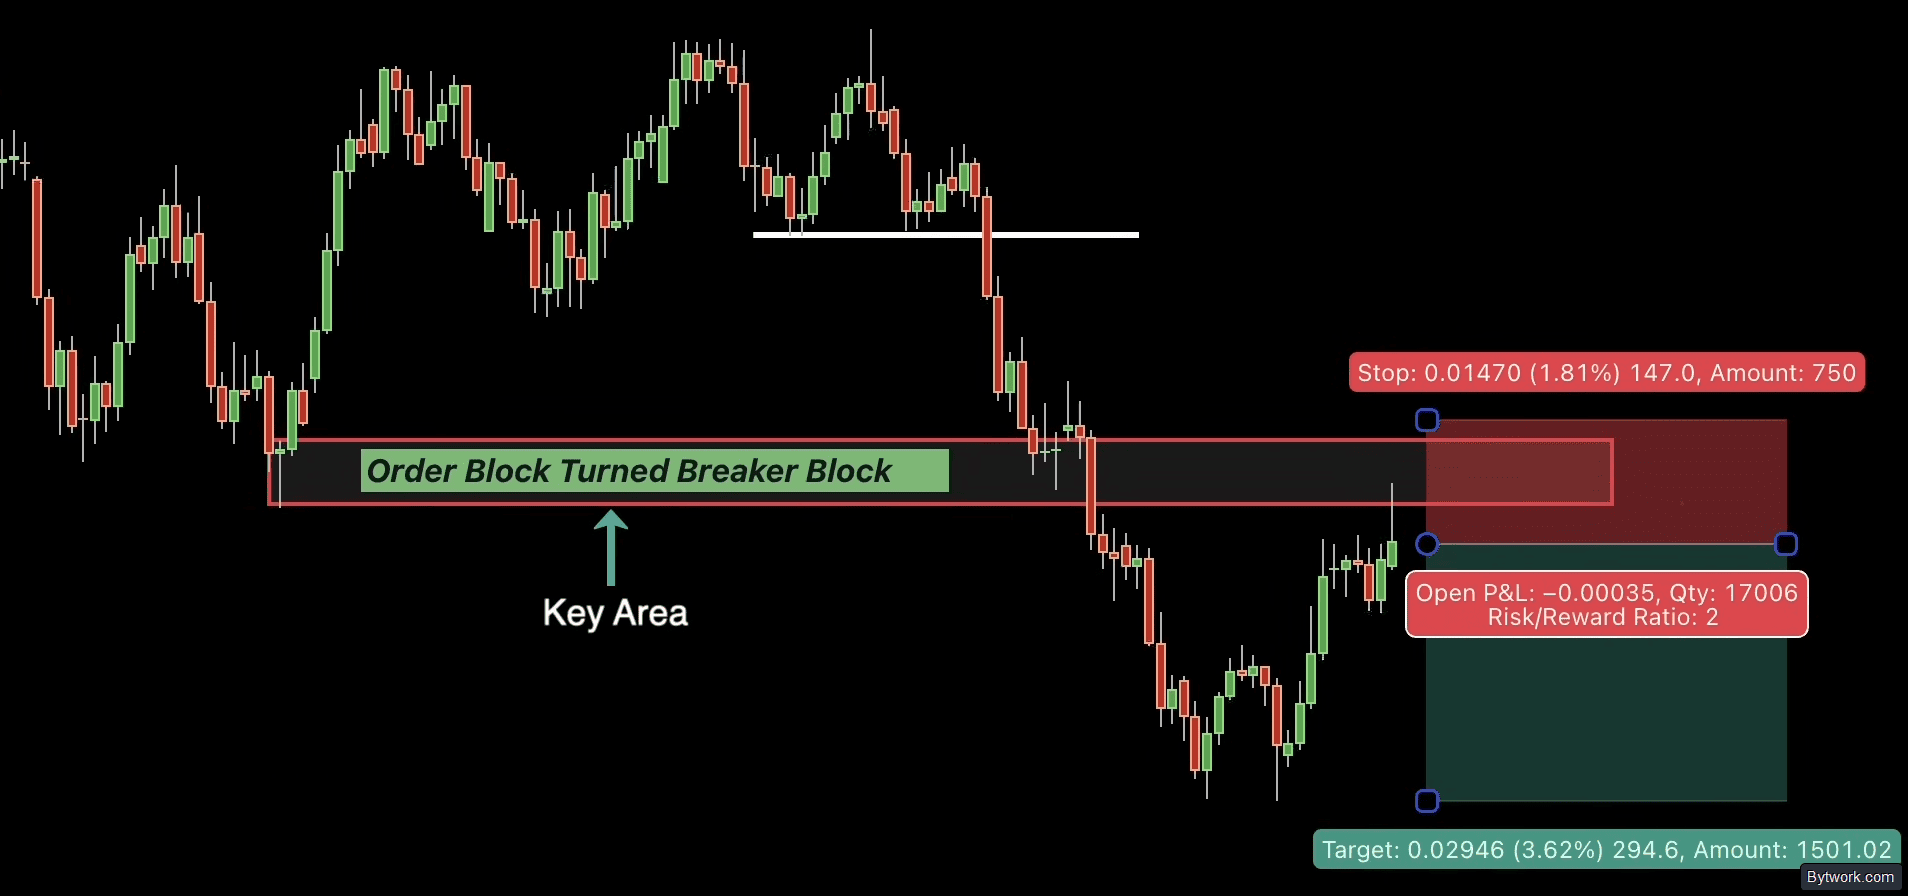
An additional filter for assessing the strength of a pullback during zone retests is moving averages, which help confirm the medium-term slope of the dynamic trend.
Candle bodies convey the real story of market intentions, while wicks often inflict damage on retail traders. Always wait for the candle to close on your working timeframe for final confirmation of a bearish MSS.
What ICT Strategies Exist?
There are many ICT strategies and entry models based on liquidity.
Do not try to use all strategies at once. From experience, it is better to choose 1–3 concepts that you understand and practise them until they become second nature.

ICT Strategies:
- Silver Bullet – combination of market structure shift, liquidity sweep, and FVG. Entry after price breaks the daily high/low, returns inside, and forms a confirming structure shift.
- Cambrian Model – look for liquidity attraction on the hourly chart, then on the 5-minute chart – stop-run and entry via FVG on lower timeframes.
- Inversion FVG – if price violates a formed FVG, it signals continuation in the direction of the violation. Entry on a pullback to the zone.
- Turtle Soup – entry after price sweeps liquidity above a recent high while an FVG exists in the opposite direction. Used to catch reversals after false breakouts. Essentially, this strategy is the best way to profit from those who blindly trade classic Double Tops or Double Bottoms, expecting a reversal where market makers instead collect liquidity.
- Candle Range Theory – each candle sets liquidity levels. The second candle makes the sweep, the third gives the entry. Traded after price returns inside the candle's range.
- Optimal Trade Entry – entry at Fibonacci 0.618–0.786 retracement of a swing move for better risk/reward and avoiding early stops.
- Change in Character of Delivery – pattern of a sharp change in impulse. Entry after price returns to the overlap zone of FVG and inversion FVG.
- Power of 3 – 3 phases – accumulation, manipulation, distribution. Entry after confirmation of a false break on a lower timeframe.
Before choosing a strategy, understand which trading style suits you:
- Determine your trading style.
- Pick 2–3 ICT concepts to avoid analysis paralysis.
Collect statistics:
- Backtest the model on historical data over the last few months.
- Keep a journal and record numbers and your emotions.
- Identify the best conditions and times for trading.
Also important is risk management. The strategy must withstand 8–10 consecutive losses. Reduce your risk per trade to avoid disaster.
What Are the Drawbacks and Risks?
Every system has flaws, including ICT. For example, many patterns (like MSS structure breaks) can be fake liquidity sweeps rather than real trend reversals. In turn, a risk of 5-10% per trade during a series of 8 losses (which is entirely possible) leads to a loss of 30% to 52% of the entire deposit. And that is psychologically devastating for a trader.
Other risks and how to deal with them are summarised in the table below:
|
Category |
Risks (Cons) |
Consequences and Solutions |
|
1. Psychology |
Noise, ego-trading, Dunning-Kruger effect. |
Analysis paralysis, overleveraging. |
|
2. Technical |
Search for the perfect entry, slippage, fake signals. |
Missed profit, stops during news. |
|
3. Market |
Absence of 100% setups, manipulations. |
Phases where TA is useless, losing streaks. |
|
4. Money management |
Excessive risk (5-10%), strict prop-firm rules. |
Account blow-up, demoralisation. |
|
5. Theory criticism |
Subjectivity (FVG in hindsight), rebranded Wyckoff. |
Illusion of a "holy grail", blind faith in IPDA algorithm. |
Many believe that ICT concepts are simply old technical analysis in a fashionable wrapper. The author took ideas from 100 years ago and rebranded them for modern traders.
How does it look in the old paradigm?
- Smart Money – classic Richard Wyckoff method (the big player).
- Order Block – ordinary support and resistance levels.
- FVG (Imbalance) – standard price gap.
- OTE (Optimal Trade Entry) – Fibonacci retracement levels.
One could say that marketers simply changed the labels to sell classic concepts as a secret Holy Grail?
However, an Order Block is a one-time zone. It loses strength after the first retest and price reaction. Unlike repeatedly tested levels, it is formed from a single aggressive impulse. Also, an order block is drawn as a wide zone from low to high of the source candle, not as a thin line. So there is indeed a difference from classic TA.
And here is a practical example. A classic liquidity hunt is seen in the case of tokenised gold, where price precisely broke the high to sweep stop-losses, then instantly reversed and moved 200 pips in the opposite direction.
Q&A
- Why is a system of 5 concepts considered incomplete?
Despite strong elements (structure, liquidity, time, impulse, order blocks), it lacks a strict entry criterion on pullbacks. Without clear rules on pullback depth and volume, a trader risks entering a false move.
- Are Fair Value Gaps ineffective?
Backtesting 500 trades on classic FVG showed a win rate of 15%. Price is not obliged to return to these zones; most are random noise, not reflections of real market imbalances.
- What are footprint charts and why are they better than FVG?
Footprint charts show real volumes, aggressive buyers and sellers at each level, and absorption zones. These are objective data, not arbitrary gaps between three candles.
- How to distinguish a real breakout from a liquidity hunt?
A breakout above a high or below a low is often a deliberate stop sweep, followed by a reversal. This is confirmed by a sharp return and a long wick – the classic liquidity above/below pattern.
Conclusion
ICT is a working but complex concept, which, if not simplified and customised to your own style, may only generate losses. Therefore, before using any trading strategy on a live account, be sure to backtest it on at least 100 trades over a period of at least one year.
Through experience, we have found 5 mandatory entry filters:
- Liquidity is swept at previous highs/lows.
- A Fair Value Gap (FVG) is recorded after the liquidity grab.
- A structure shift has occurred (new extreme against the trend).
- Price has returned to the 61.8% – 78.6% zone of the impulse according to Fibonacci.
- Key US news release times and 4-hour or daily candle close/open times are taken into account.
To filter out garbage, noisy price gaps, we switch TradingView from RTH to ETH. The regular session (RTH) creates false gaps that confuse trading algorithms. Without market context, all FVG trades have a win rate akin to a coin toss or a horoscope.
From experience, FVG becomes "golden" and more significant if it coincides with Fibonacci levels of 50% or 61.8% of the impulse move. The Optimal Trade Entry (OTE) zone is strictly tied to two Fibonacci levels – 0.62 and 0.79. The midpoint of the zone is 0.75.
So, does ICT trading work or not? In a general sense, yes. Because price inevitably moves either toward liquidity (stop-loss zones beyond old highs and lows) or toward price imbalances (FVG) to rebalance them. However, even the best strategy is useless without iron discipline.
Postscript: we have been trading since 2018 and have tested hundreds of strategies and indicators. Choose your trading system in the trading section! Your editor – Pavel Grachev for bytwork.com.

Now reading


In DePin, people create networks themselves, share traffic or capacity, and receive rewards in tokens from these projects.





The Ellipal firmware update enhances security (fixes vulnerabilities), adds support for new cryptocurrencies and tokens, and optimizes the interface and operational stability.


