DropsTab: What is it? Review and comparison with CoinMarketCap
DropsTab is an extremely useful service that will come in handy if you are involved in trading.
DropsTab is a rating site for tracking cryptocurrencies with tools such as overbought/oversold detection, Bounces and Dips, and Accumulation Phases, when coins are being accumulated by large players.
It also features advanced functions for investment analysis, tracking token vesting and unlocks, a section with potential token airdrops, and portfolio functionality.
Why use it if CoinMarketCap exists?
At first glance, it might seem like just a copy of CoinMarketCap, and partly it is, since most of the information overlaps. However, CoinMarketCap, after being acquired by Binance, added many intrusive features, making it inconvenient for many to track metrics.
DropsTab also distinguishes itself with useful widgets, such as a Bitcoin dominance chart, Fear & Greed Index, and Longs/Shorts ratio. Let's explore all the capabilities in this review.
Functionality Overview
DropsTab identifies undervalued and overbought coins, shows leaders in growth and decline, finds assets in accumulation, signals bounces and dips, and compares tokens across sectors.
The sections (tabs) here implement tools for tracking activities in the crypto space: analytics, pricing, token movements, portfolios, and much more. Let's look at this more clearly in the tables.
| Section | Description |
| VWAP Radar | Automated analysis of fair price: finding undervalued/overbought coins. |
| Top Gainers/Losers | Leaders in growth and decline for a selected period. |
| Accumulation Phase | Finding assets in the accumulation phase (sideways movement with increasing volume). |
| Bounce And Dip | Finding bounces and dips for entry points. |
| Categories | Comparing tokens within sectors (e.g., Solana, networks, DeFi, stablecoins, etc.). |
The service also tracks token events: ranks coins by chances of a free airdrop, highlights new trends, graphically shows vesting and lockups, assesses buyback volumes, and presents fresh tokens.
| Section | Description |
| Potential Airdrop | Ranking of coins with a high chance of an airdrop. |
| Crypto Activities | New and trending activities in the market. |
| Token Unlocks | Token unlock schedule (vesting, lockups). |
| Token Buybacks | Ranking of tokens by buyback volume. |
| Recently Added | New tokens |
Next, we will examine all these functions in more detail.
The tabs below show funding rounds, venture fund rankings, ETF applications, analysis of DEX tokens with perpetual contracts, market overviews, analytics, and long/short ratios.
| Section | Description |
| Funding Rounds | Information on investment rounds in crypto projects. |
| Investors & VCs | Ranking and data on venture funds and their investments. |
| Waiting ETF | List of ETF applications under review by regulators. |
| DEX War | Exchange tokens related to perpetual contracts on DEXs. |
| Research | Market overview, analytics, trends, long/short ratio. |
Finally, DropsTab allows you to create and manage your own portfolios, including the ability to create public portfolios for sharing information with the community.
| Section | Description |
| My Portfolio | Personal portfolio with profitability calculation and a convenient interface. |
| Public Portfolios | Public portfolios for sharing strategies and ideas. |
| Watchlist | Custom coin lists for tracking. |
Let's look at specific tabs and their capabilities.
How to Use
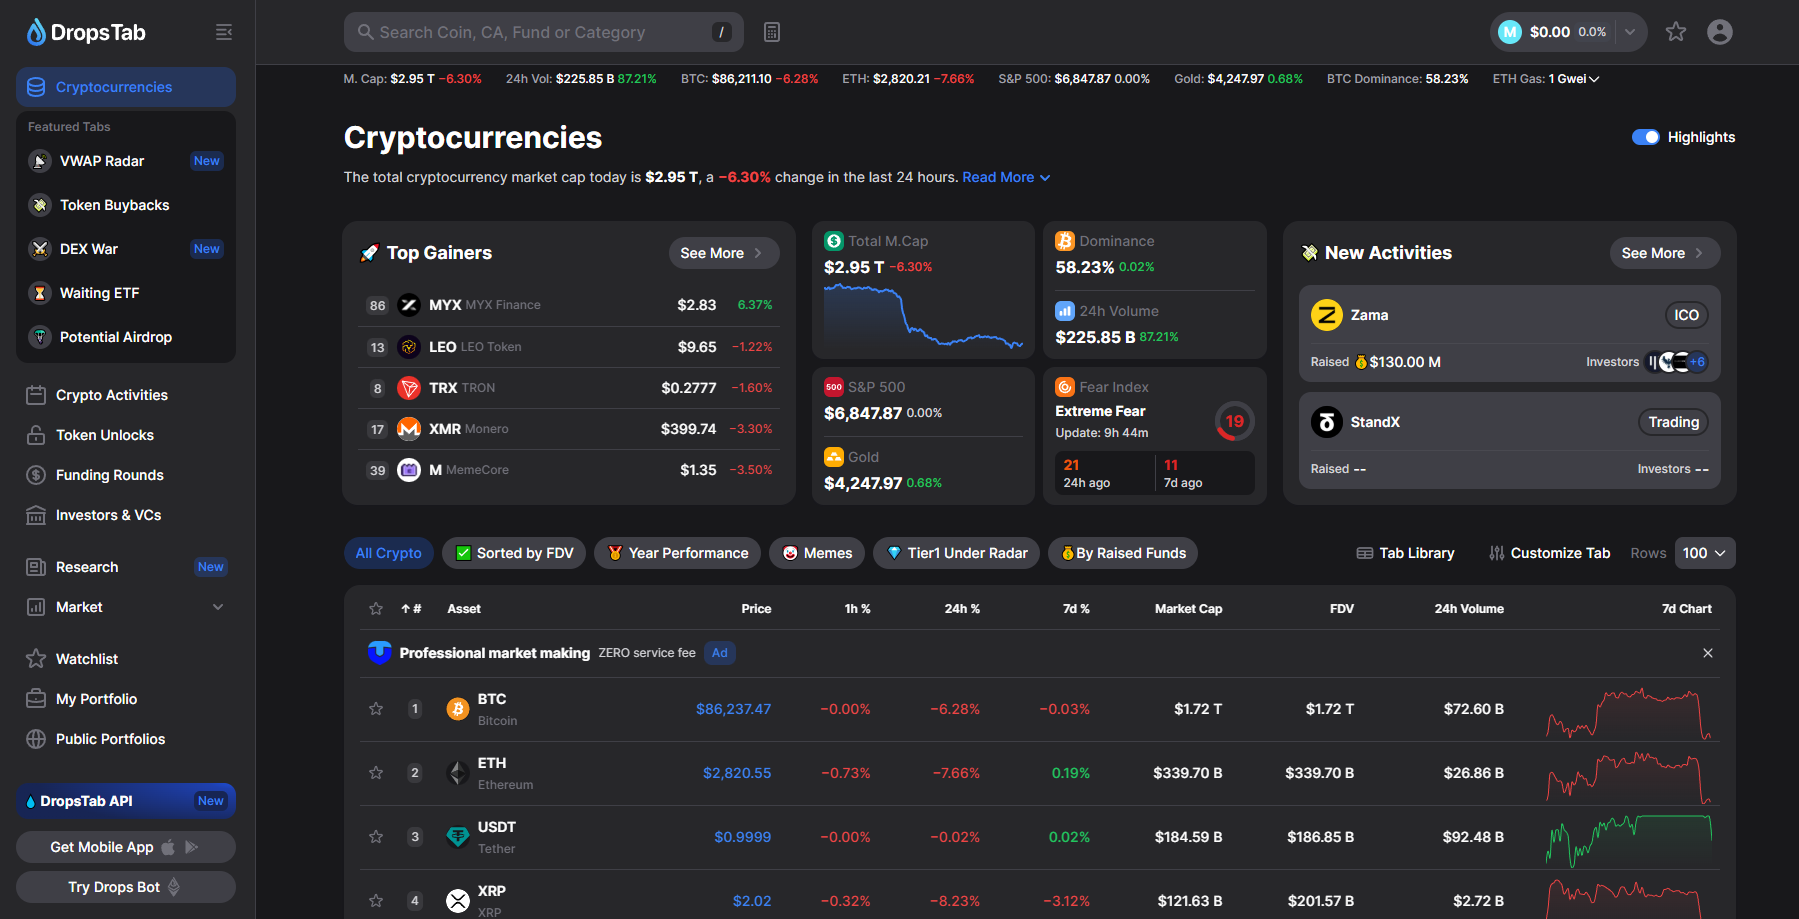
The main page displays 6 widgets:
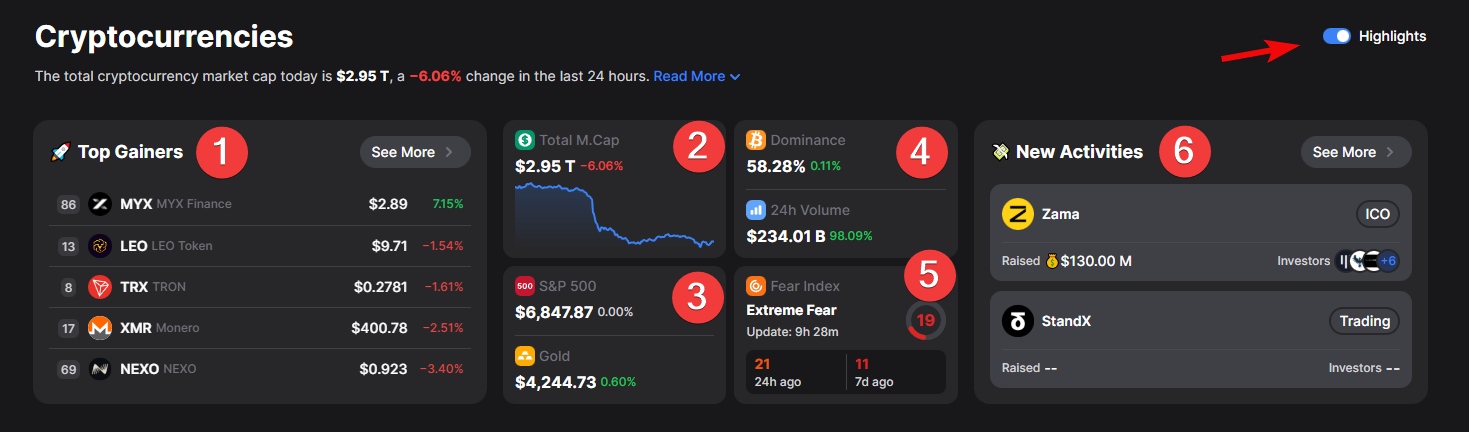
- Growth Leaders
- Total Market Cap
- S&P 500 and Gold
- BTC Dominance
- Fear Index
- New Activities
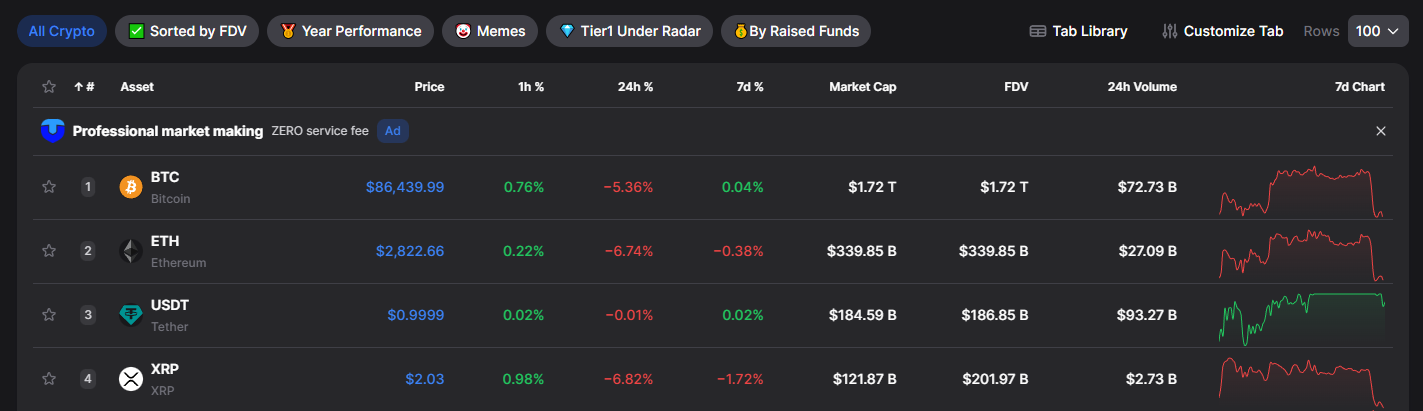
Widgets can be toggled on/off with the Highlights button. Below is a list of coins with information similar to CoinMarketCap: price, changes over hour, day, week, market capitalization, total 24-hour volume, and a small chart.
However, the most interesting part is inside. Clicking on a specific coin (for example, Sui) opens a detailed page with extended information.
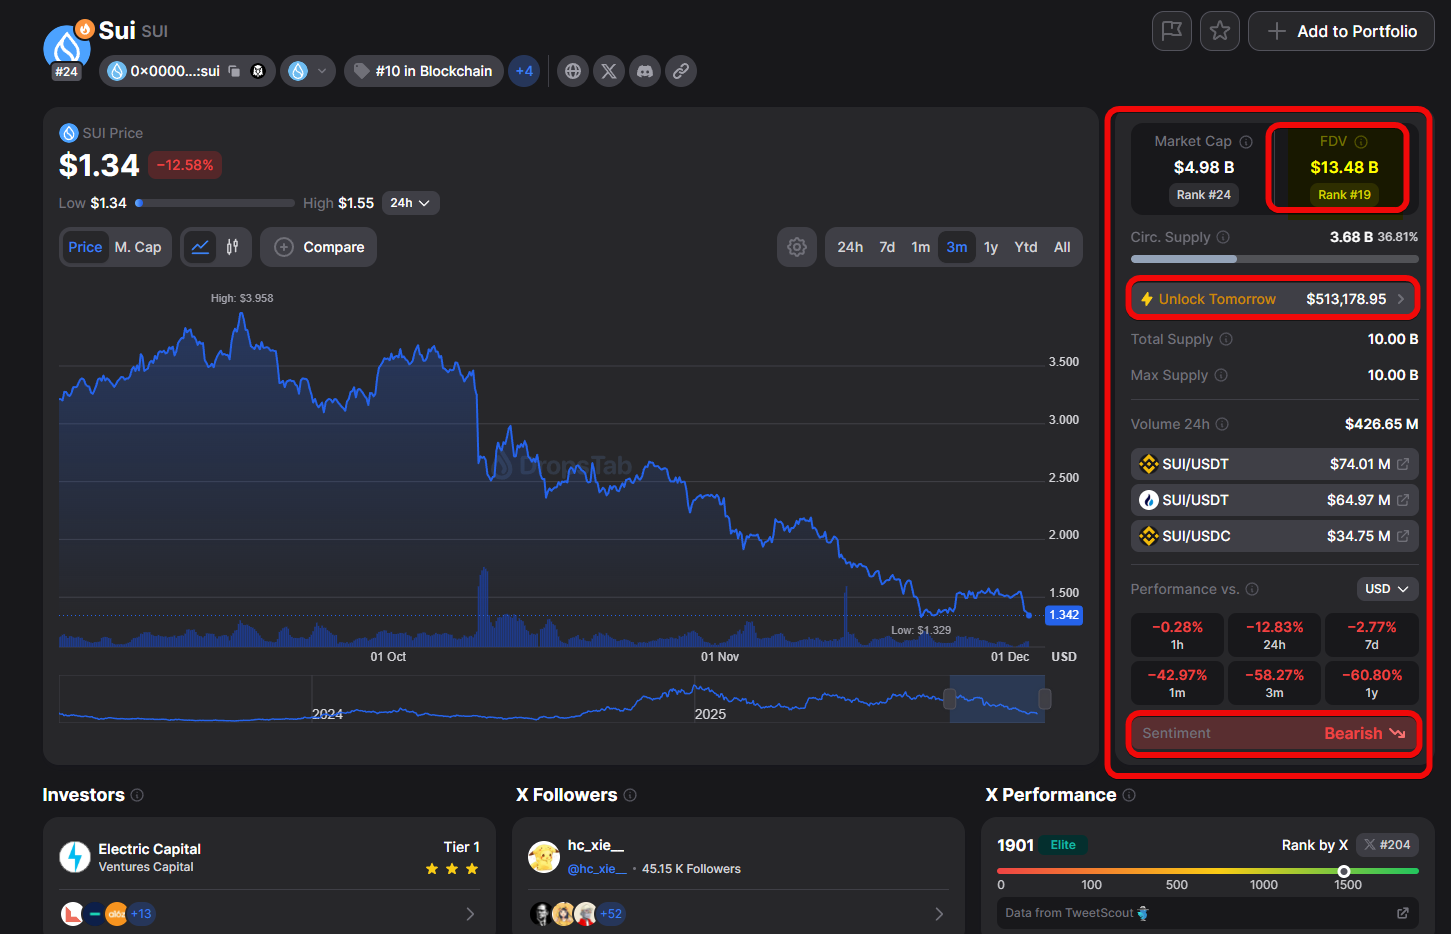
Here, besides the chart and price:
FDV- shows the theoretical capitalization if the entire maximum token supply were in circulation.Unlock Tomorrow– the volume of tokens unlocking that could affect sell pressure.Sentiment– aggregated market sentiment. Here – bearish.
The exchange section within each coin is especially useful. The service shows not just platforms, but specific trading pairs (e.g., with USDT or USDC), which sets it apart from analogues.
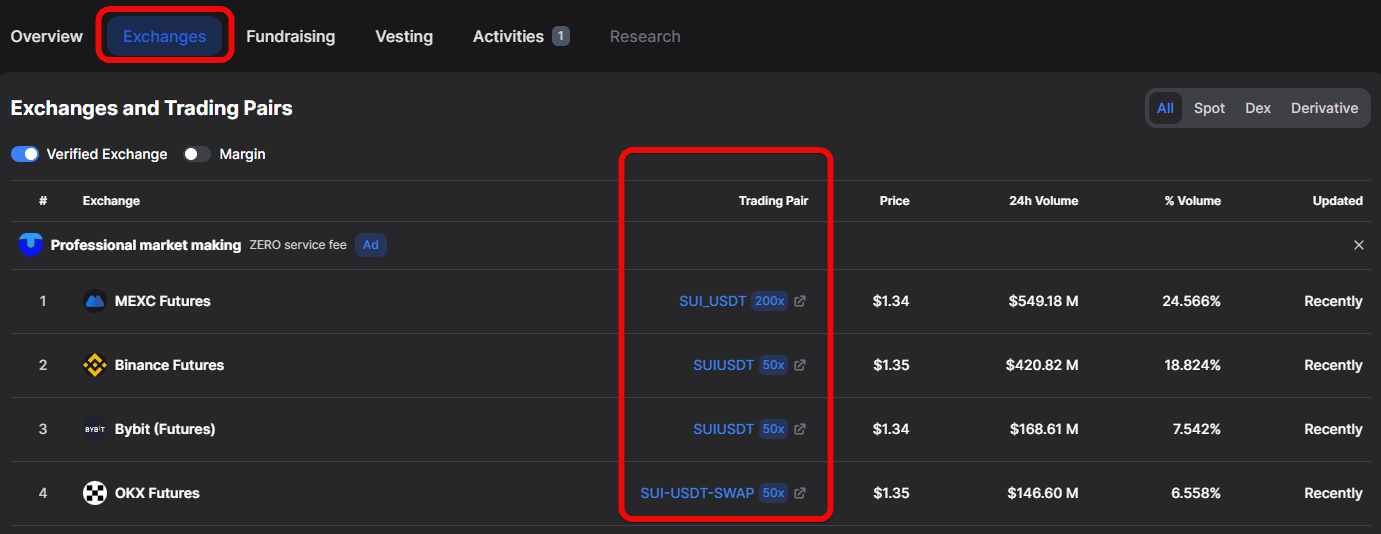
This allows you to quickly assess liquidity on different exchanges (spot and futures) and choose the most suitable exchange for trading, where the chart will be more technical with fewer squeezes.
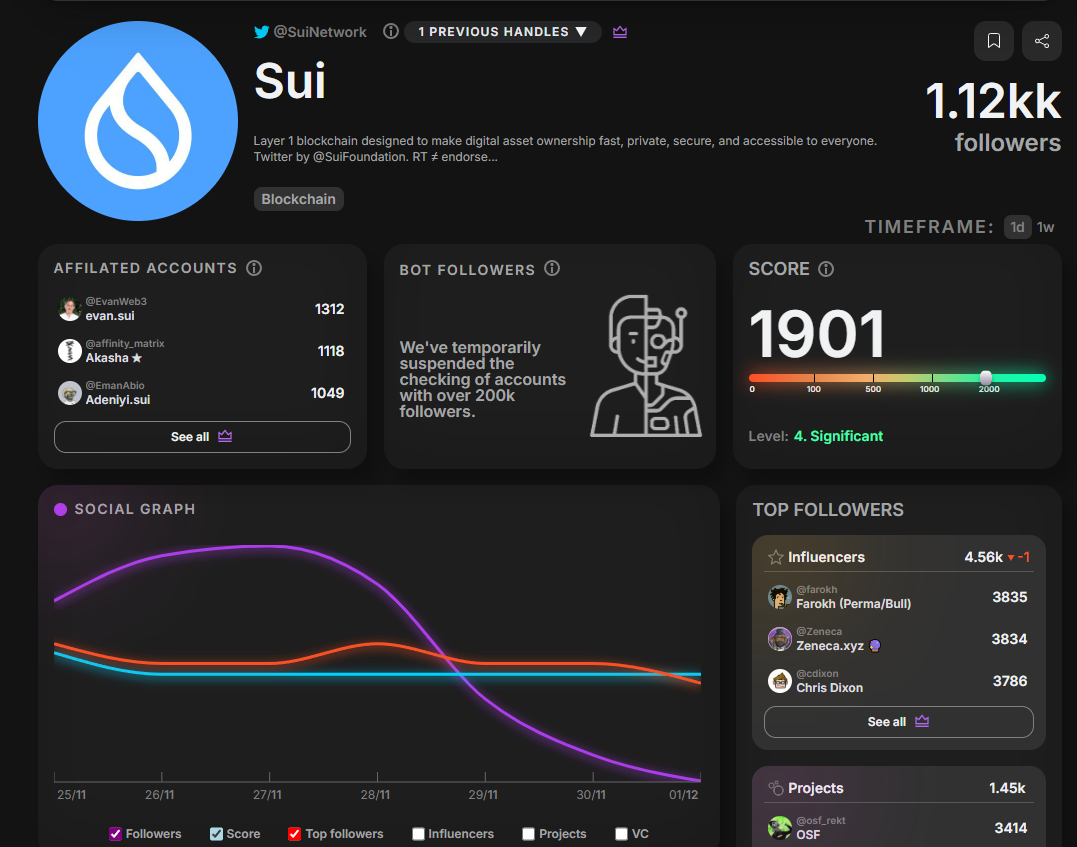
Here you can also conveniently quickly see who the investors are for a coin, the number of followers on X/Twitter, and the social activity ranking.
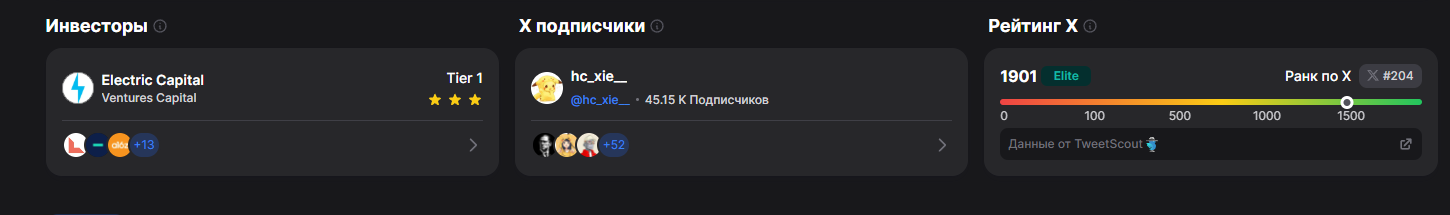
This shows community interest in the coin.
Now let's look at specific tools.
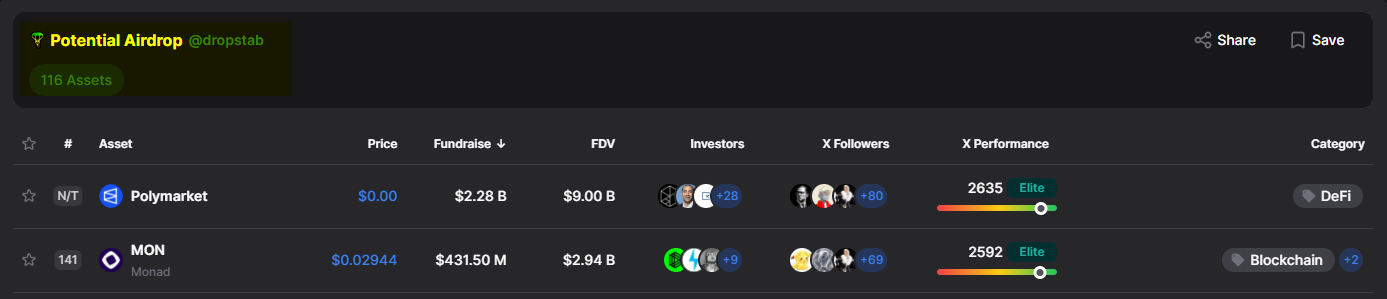
Potential Airdrop – how to find possible token distributions?
The Potential Airdrop section is designed to present cryptocurrencies that, according to the service's assessment, are closest to imminent airdrops. This feature is useful for people engaged in collecting tokens that are not yet listed on exchanges but may reward early users for activity in the future. This is called retro drops or retro hunting – searching for new projects to receive retrospective rewards later.
Although most tokens have no price and are not listed on exchanges or have not officially launched, there are also listed tokens here.
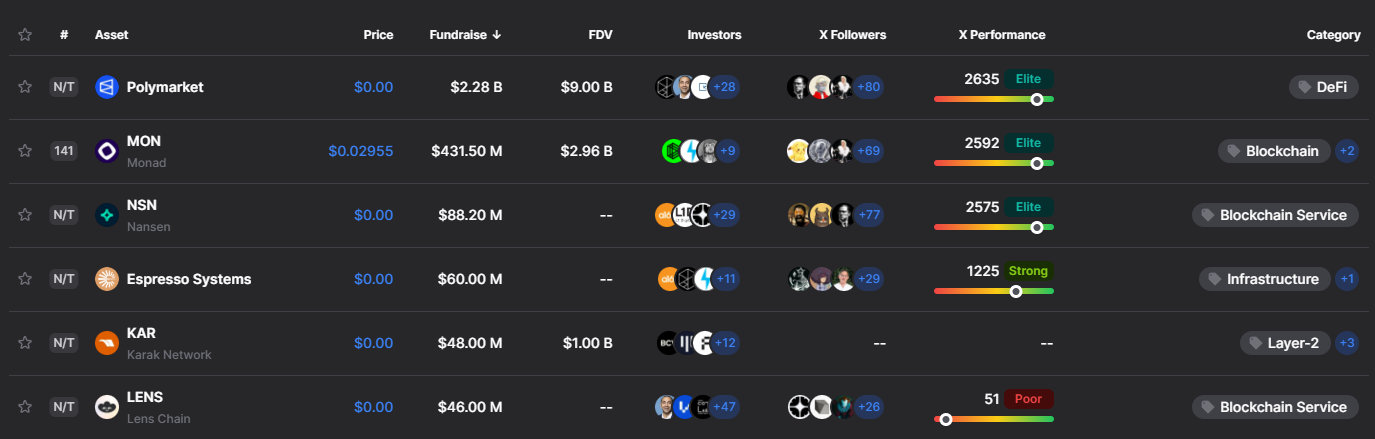
For each project, information is available on how much funding it has raised in investment rounds (for example, Polymarket raised $2.28 billion).
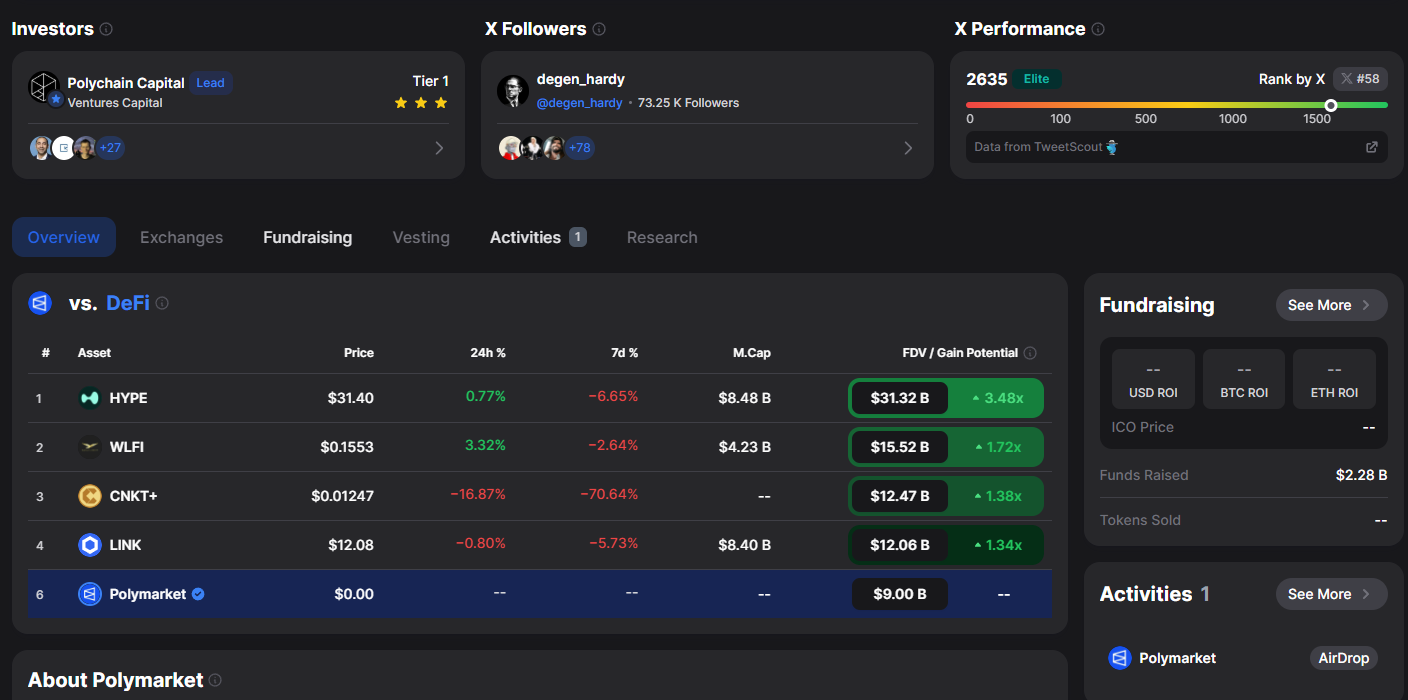
Clicking on a coin shows additional information about the project, including a list of all investing funds, X/Twitter statistics, a list of top followers, and the category the project belongs to.
VWAP Radar – how to find undervalued coins?
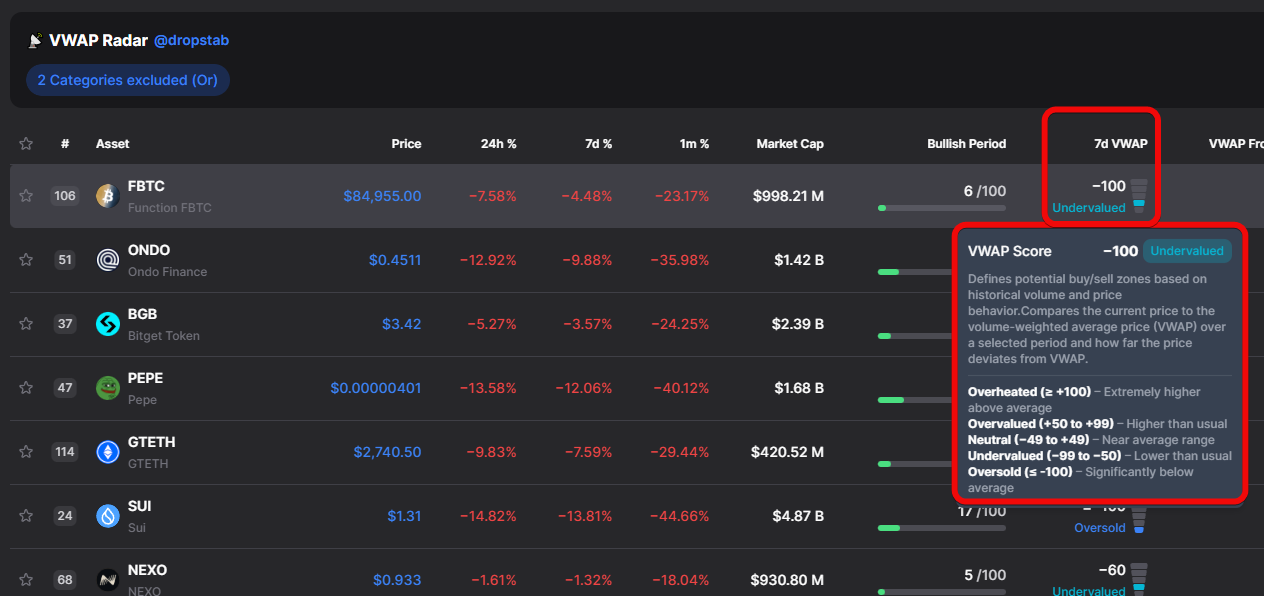
VWAP Radar - this is [volume weighted average price]. The metric scans the market and shows which coins are undervalued, which are overbought, and where there is potential for a reversal.
Why do you need VWAP Radar?
- The function helps determine entry or exit points for an asset on spot, without leverage.
- Shows how many coins were bought at each price, reflecting the fair market price.
- It is used by large players and algorithms for evaluation and decision-making, and deviation from VWAP serves as an indicator for traders.
The VWAP Score shows how much the current price deviates from the fair price over a period. The lower the value, the more attractive the coin is for buying; the higher - a correction is likely. 7d VVAP is the 7-day assessment.
Here:
- 100 (Overheated / Oversold) - extreme deviation above or below VWAP.
- +50 to +99 (Overvalued) - price significantly above VWAP.
- -49 to +49 (Neutral) - price close to VWAP.
- -50 to -99 (Undervalued) - price significantly below VWAP.
Simply put, the lower this score (e.g., in the range from -85 to -100), the more attractive the coin looks for purchase, as it is heavily oversold. Conversely, the higher the score, the greater the likelihood of an imminent correction!
The ideal situation for market entry (searching for a cheap asset) occurs when the VWAP score shows strong oversold conditions (e.g., from -85 to -100) combined with a growing, but not too strong, Bullish Trend indicator (e.g., from 20 to 50). Such a combination signals that the asset was undervalued relative to VWAP, but volumes have already started to appear, indicating the formation of a new trend. Additionally, the tool can help identify exit points when coins become highly overheated.
Here, besides the price, we see Bullish Period - a column assessing the strength of the upward movement.
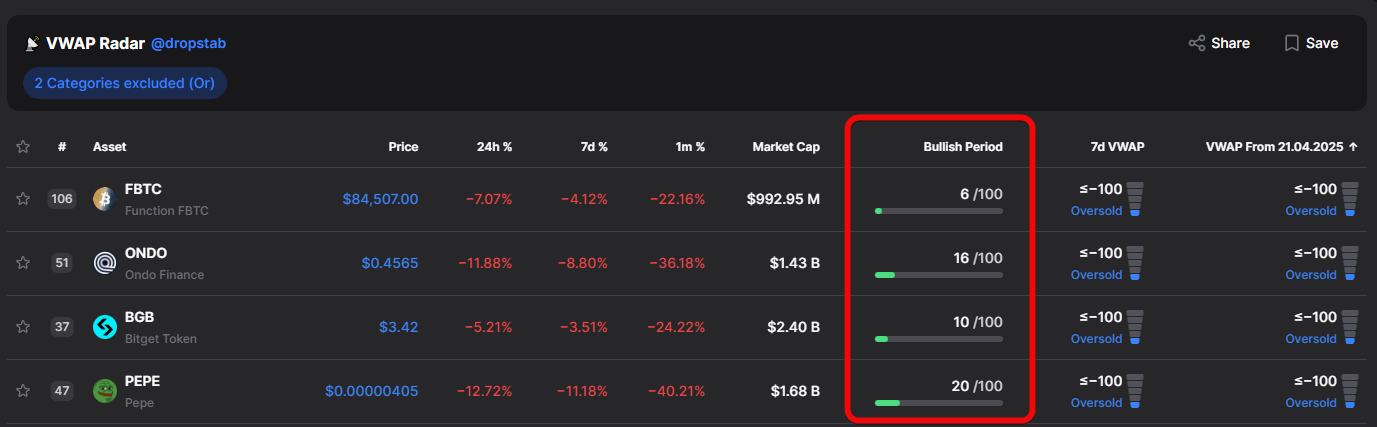
It helps understand whether the growth is random or a sustained trend. The calculation considers buying volumes, price action, price relation to VWAP, momentum, and supply-demand balance. Traders prefer entry during moderate growth from 20 to 50, indicating a forming bullish structure.
In the end, it's worth understanding this function because it is one of the fundamental ones.
If you are seriously involved in trading, be sure to learn about basic indicators:
Now let's consider even more subtle tools.
Bounce and Dip – how to identify bounces and drops?
The Bounce and Dip tool is designed to identify 2 key trading situations:
Buy the Dip (BTD), meaning buy the dip, andDead Cat Bounce (DCB), or in trader language - a dead cat bounce.
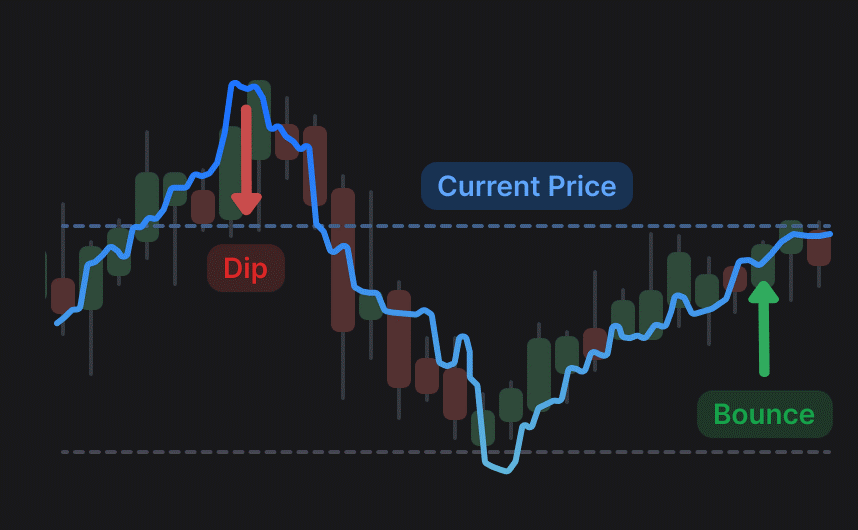
Buy the Dip- a strategy used when a price drop is considered temporary, as the asset is in a long-term upward trend.Dead Cat Bounce, on the contrary, describes a situation where the price bounces from lows, but a further decline is forecast in the long term.
Here there are these 2 indicators and a timeframe selection.
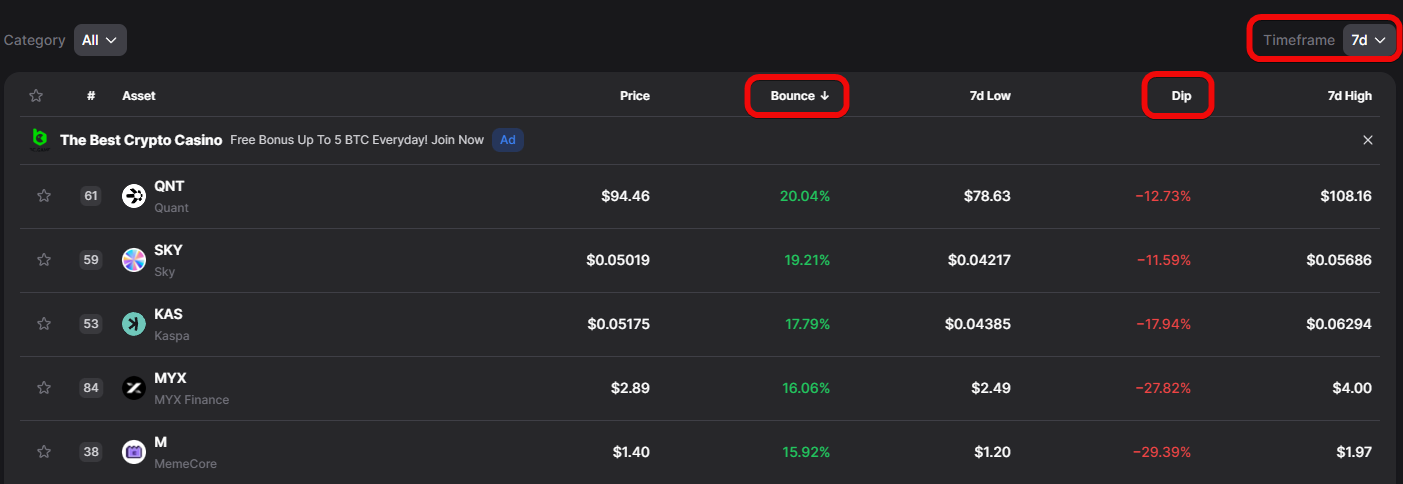
To determine a healthy correction (BTD) worth buying, traders look for coins meeting the following criteria: momentum strength (Bounce) should be in the range of 40% to 150% (less than 40% is weak momentum, and above 150% is often a parabolic pump, turning the purchase into catching a falling knife).
At the same time, the Drop (Dip) should be in the main entry zone from -10% to -35%. A correction deeper than -45% is considered a no-go zone (trend breakdown or transition into a prolonged downtrend).
This tool perfectly complements other analytical tools, such as the Accumulation Phase.
Accumulation Phase – how to find coins being accumulated?
The Accumulation Phase section is a tool for finding coins that are in a period of sideways price movement after a significant decline. This phase is characterized by the asset's price standing in a range for some time, and the price behavior resembles large players accumulating positions rather than panic or pump.
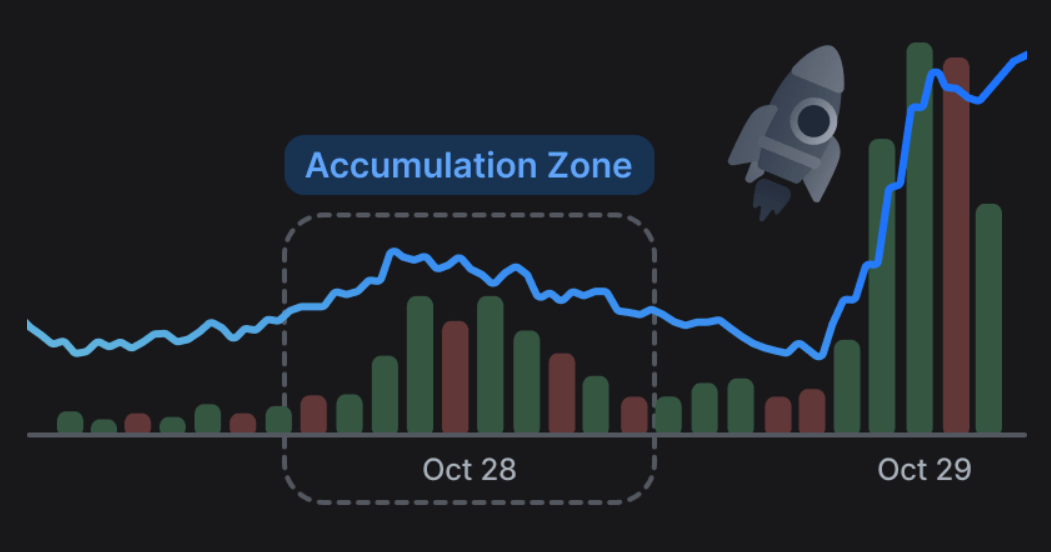
Here you can see how long the coin has been in accumulation, its price change over different periods (day, 7 days, 1 month), as well as volume change over 7 days and 1 month.
If volumes increase 5–10 times while the price hardly changes, this is a strong sign of hidden accumulation!
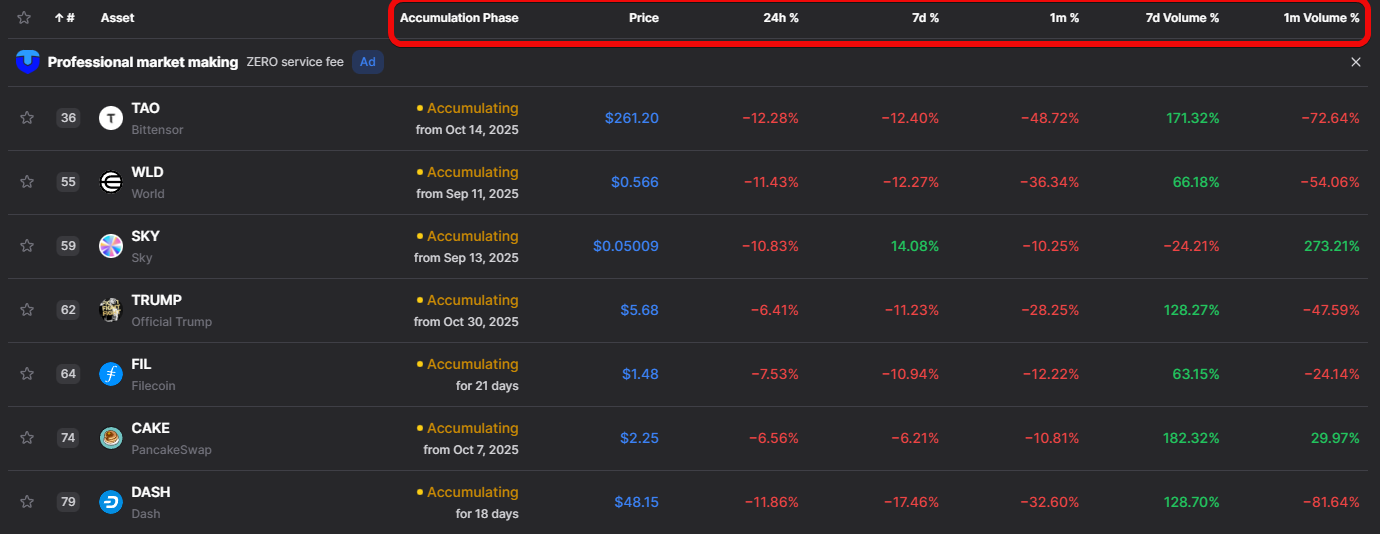
Investors aim to find coins with long accumulation (e.g., from several months to half a year or a year), since the longer a coin stays in this zone, the higher the chance it will start to grow.
This tool helps filter out noise and focus on assets where something is happening, but it is not a guarantee of growth.
Investments – how to analyze crypto funds?
The Investors & Funds tab allows you to study in detail who and when invested in a project, which is an important indicator of large capital's trust. Here you can analyze investment rounds, learn the price at which investors bought the coins, and how much funding was raised.
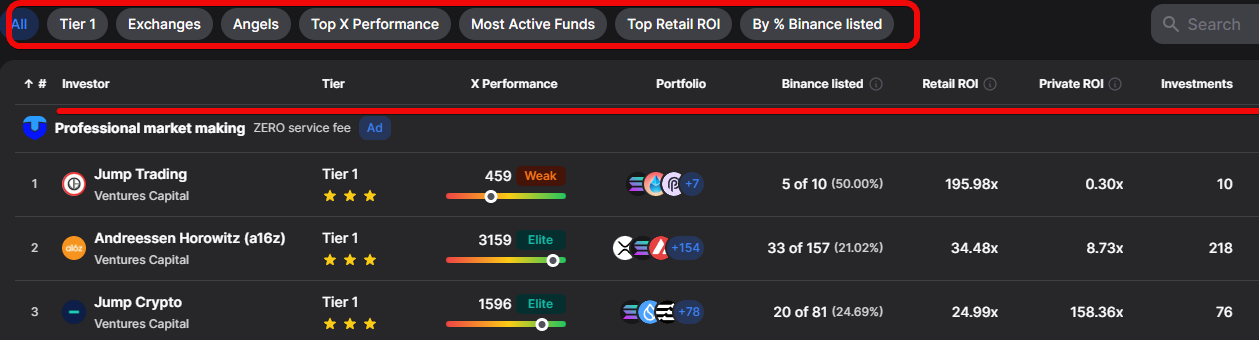
In this table:
Investor- name of the investment company/fund.Tier- level (here all are from the first (top) tier).X Performance- assessment based on objective statistical indicators and interest from significant community participants.Portfolio- brief display of known projects in the portfolio.Binance listed- the share of invested projects that eventually got listed on the Binance exchange. Shows the ability to pick successful projects.
Next are the profitability metrics:
Retail ROI- return on investment for retail investors (shows how much public investments would have grown).Private ROI- return on investment in private (closed) funding rounds.Investments- total number of deals/investments.Latest Round- date of the latest investment round.
Special attention is paid to Fund Tiers (Tier 1): the presence of such large investors as, for example, 3 Tier 1 stars in the case of Sui, serves as an additional plus for the project's credibility.
As an example, let's open the investment analysis for SUI.
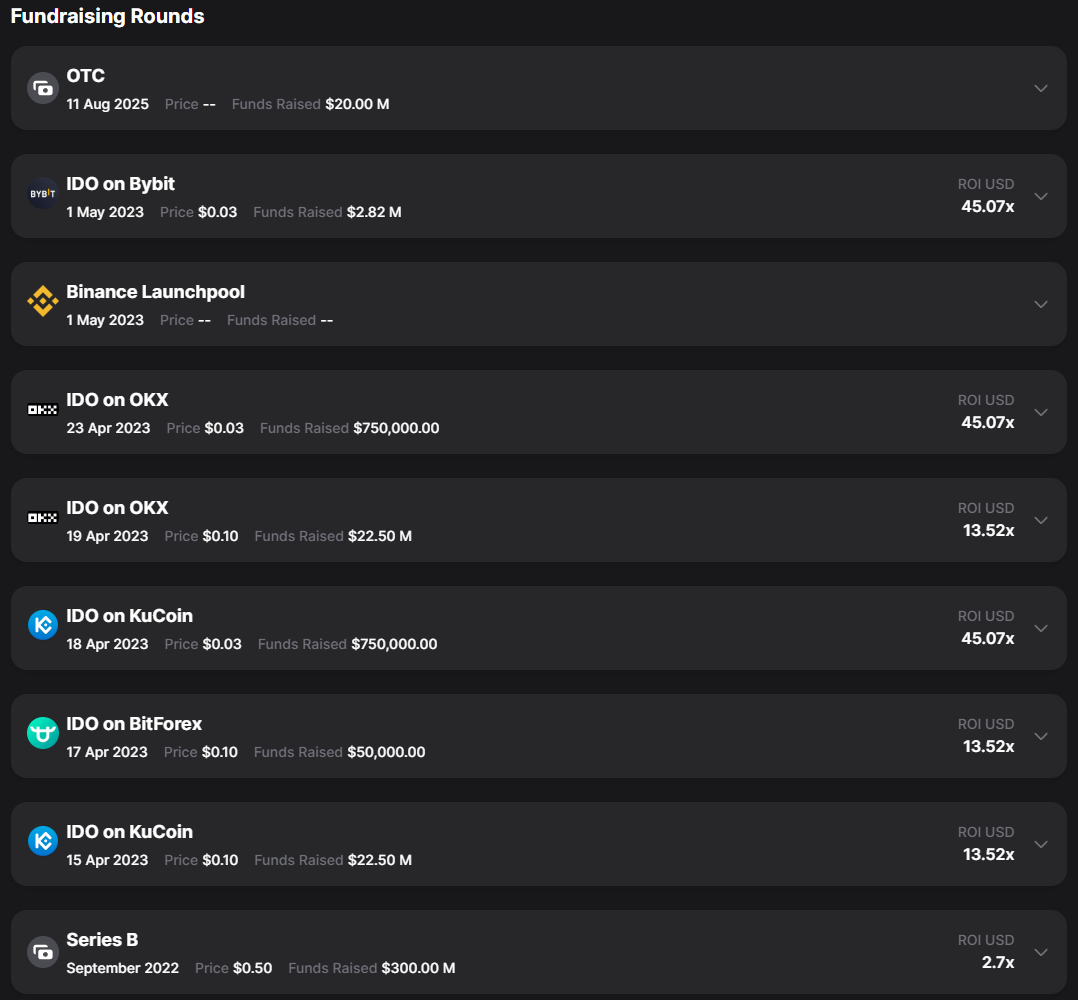
By analyzing investors, you can calculate the average entry point of large capital (cost basis), below which the price of a good project typically does not fall.
In each round (e.g., Series B) you can find out the price at which investors bought the coins. For example, SUI investors bought coins at $0.50 in Series B.
Expanding the details, you will see that, for example, the Bybit exchange bought 94 million tokens, receiving a 45.07x return (ROI).
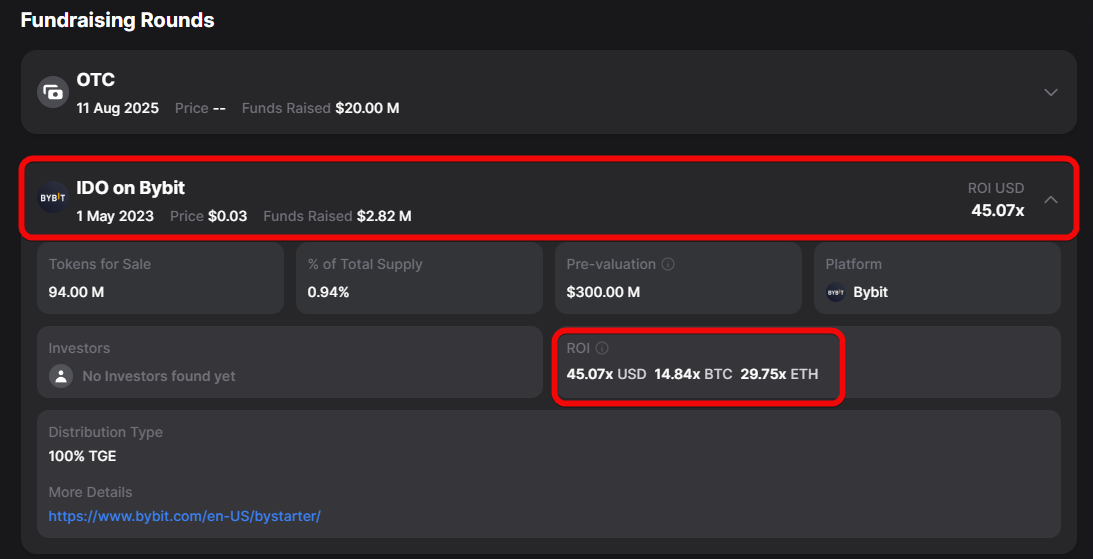
It is also important to check co-investments to understand whether funds might collude or manipulate an asset.
Token Unlocks – how to track vesting?
First, a reminder: Vesting is the gradual unlocking of tokens over time, so participants don't sell everything at once.
Token Unlocks allows you to track upcoming and past token unlocks to avoid potential price pressure (dumps). You can see the date, time, number of unlocking coins relative to market capitalization.
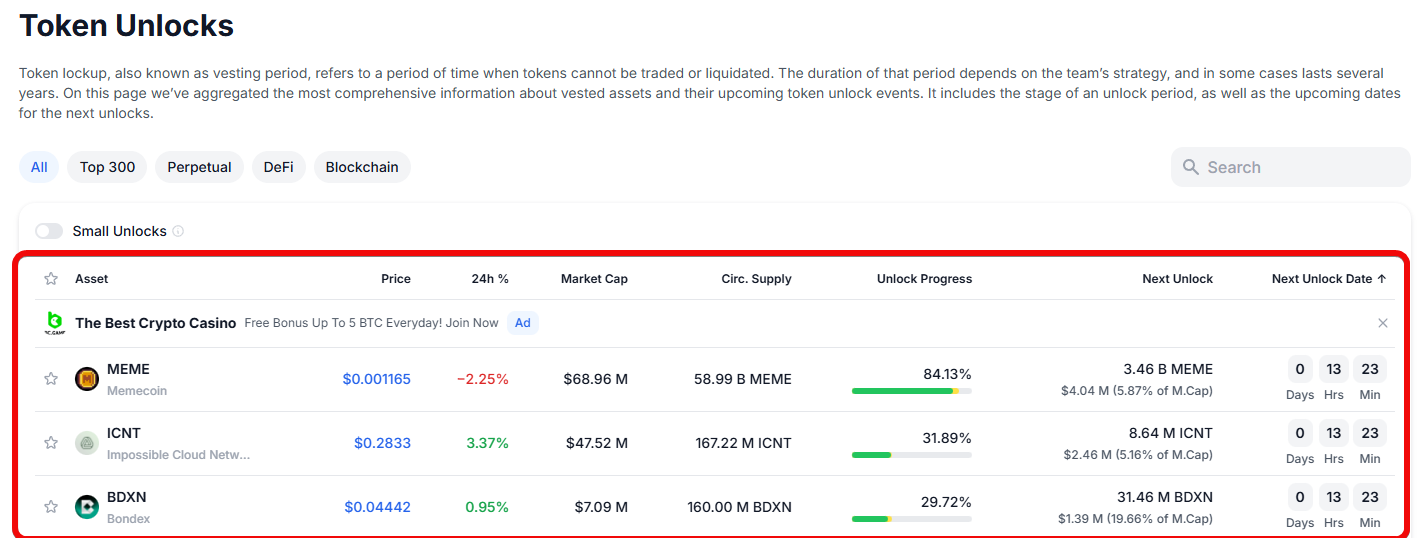
This information is critically important, as a large unlock, especially if it happens once a year, can significantly affect the price!
Portfolio Tracker – how to create portfolios or track others'?
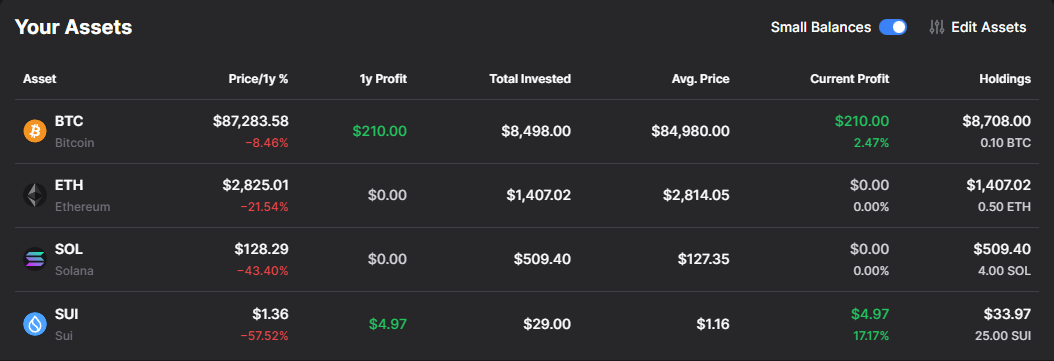
The My Portfolio section allows you to create your own investment portfolio and track it effectively.
You can add assets by specifying the purchase amount, price, date, time, and even fee.
The service automatically recalculates the quantity of the purchased asset or the amount spent on it, depending on the entered data. This allows accounting for transactions, including Dollar-Cost Averaging (DCA) strategy, by adding new entries.
The portfolio displays overall dynamics, top gaining and top losing assets. By entering your data, you can view profit or drawdown over a specific time.
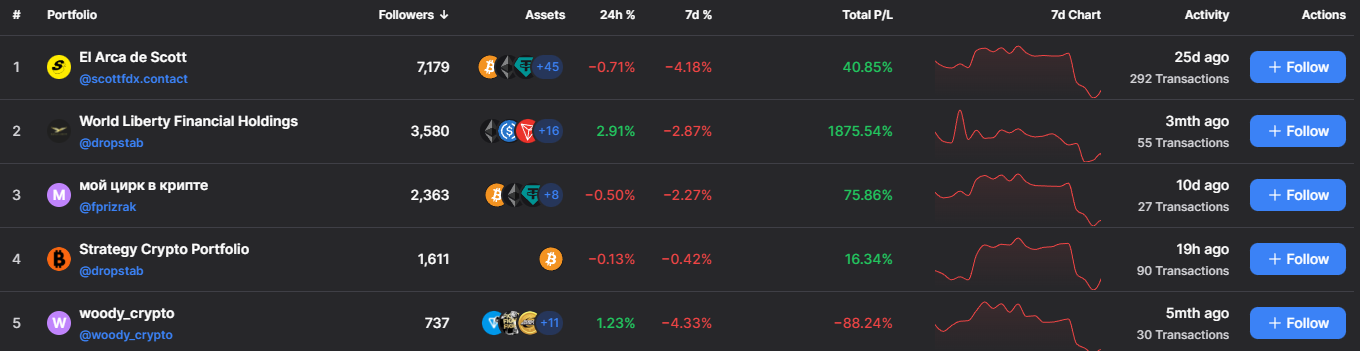
An important feature is the ability to create public portfolios. You can share a link to your public portfolio with friends or post it in your Telegram channel so others can see its transactions and results.
This is useful for those who want to peek at others' portfolios and gather investment ideas, although such portfolios do not always reflect reality.
You can also create an unlimited number of portfolios (e.g., one for core investments and another for meme coins).
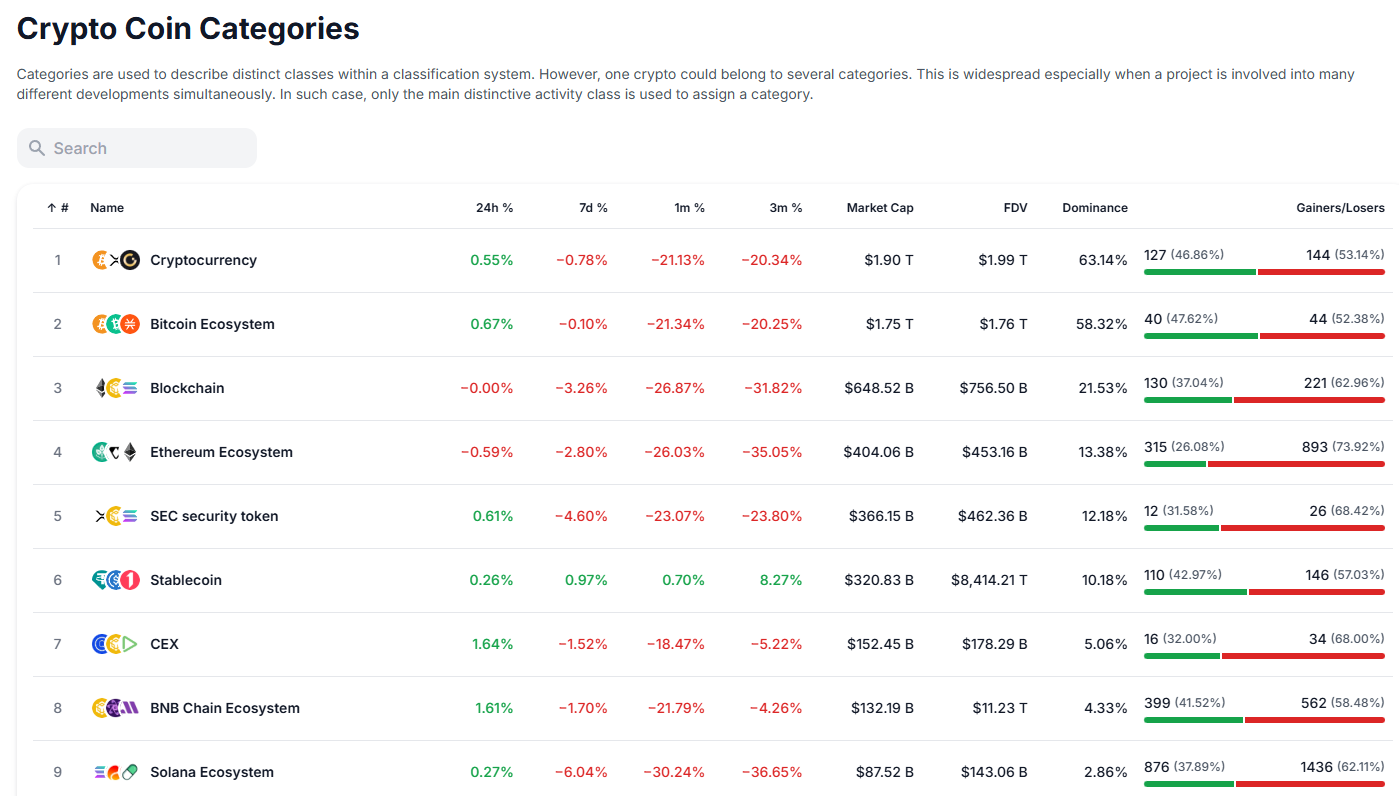
Categories – how to analyze crypto sectors?
The Categories section is a convenient tool for sorting and analyzing cryptocurrency projects by sectors and ecosystems.
How to analyze the market through categories?
- You can sort projects by various ecosystems, such as Solana, Memes, Web3. This helps find promising assets in developing niches. If you've heard that the Solana ecosystem is growing, you can open the corresponding category and find interesting projects.
- You can open the memes tab and see the total market capitalization of the entire sector (e.g., $41 billion), as well as its change dynamics over a certain period (e.g., the sector dipped 8.9% over 7 days).
- You can compare projects from different sectors. For example, you can compare the capitalization of 2 meme coins (Pepe and Doge) with the capitalization of a fundamental blockchain like Sui. Such a comparison helps see the imbalance between technological projects and meme coins in the crypto market.
Conclusion: here you can search for investment ideas in a specific sector.
Summary
DropsTab is a useful service for crypto traders, tracking prices, analyzing overbought/oversold conditions, accumulation phases, bounces and dips, as well as vesting, unlocks, and potential airdrops.
The DropsTab tracker goes far beyond simple price tracking like CoinMarketCap and lacks intrusive advertising or an excess of unnecessary features.
Are there drawbacks? There always are.
| Drawbacks | Essence |
| Incomplete data | OTC and hidden rounds are not always visible → incorrect conclusions |
| Lagging metrics | VWAP and others ignore news and market manipulation |
| Black box | Closed trend algorithm cannot be verified |
| Fake portfolios | Public strategies may not reflect reality or play guessing games |
| Data leaks | Centralization of sensitive information when creating portfolios |
| Illusion of complete analysis | Convenient tables replace own thinking → risk of losses |
However, it's better to have analytical information than none at all.
Disclaimer: All information provided in this article should not be taken as financial advice! The article was created for educational purposes.


